

Khanchit Khirisutchalual
Many investors think of alpha as absolute returns in excess of a benchmark like the S&P 500 (SPY). In other words: if the market delivers gains of 10% in a given year and the investor earns 12% instead, the 200-basis point outperformance tends to be thought of as alpha.
But I like Seeking Alpha’s definition of alpha better: “a performance metric used to evaluate the returns of an investment security or a portfolio after adjusting for market-related volatility.” The key difference here is the volatility adjustment component, which I believe is crucial.
Think of Harry Markowitz’s efficient frontier curve — see graph below. Higher expected return (y-axis) can be and often is associated with higher volatility (x-axis). For example, speculative tech stocks often produce market-beating returns, as they did in 2020 and last year, but not without exposing the investor to substantially higher risks.
Efficient frontier (Investing Caffeine)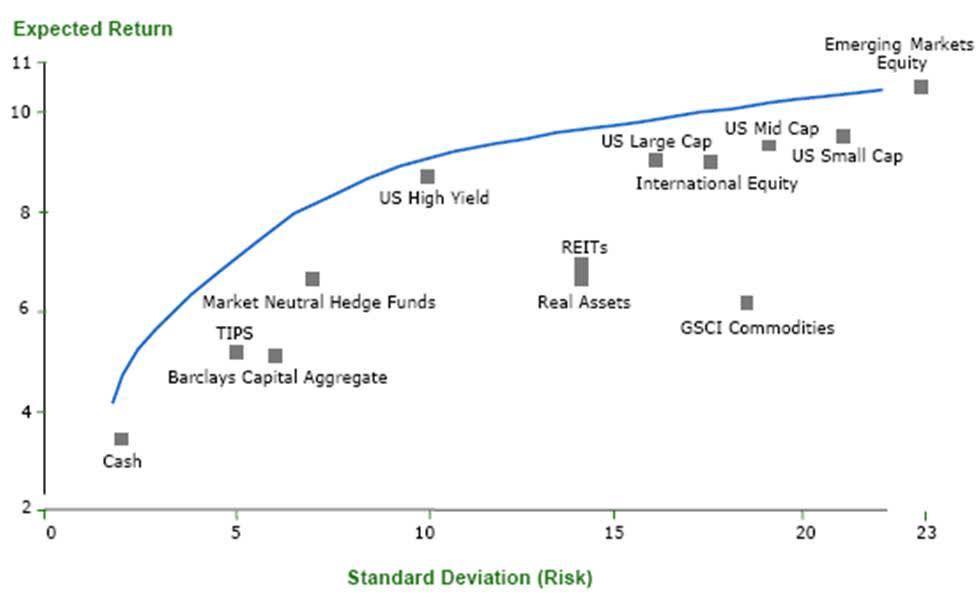
For this reason, I focus my alpha-seeking efforts on producing higher returns per unit of risk, the latter of which is often measured by volatility levels. This is why I like the AGFiQ U.S. Market Neutral Anti-Beta Fund (NYSEARCA:BTAL).
What is BTAL?
BTAL, a fund advised by AGF Investments, has the goal of providing “a consistent negative beta exposure to the U.S. equity market”. The idea is simple: when the S&P 500 is down over a period of time (say, day or week), BTAL aims at being up. The fund tries to achieve this goal by being (1) long low beta like H&R Block (HRB) and Dollar General (DG) and (1) short high beta US equities like Block (SQ) and Plug Power (PLUG).
Historically, BTAL has largely delivered what it promises. The chart below shows the rolling one-year correlation between BTAL and the S&P 500. On average, the correlation coefficient has been quite low at -0.43, with a maximum of -0.03 around mid-2015 and a minimum of -0.69 only a few weeks ago.
BTAL vs. SPY: 1-Yr Rolling Correlation (Yahoo Finance)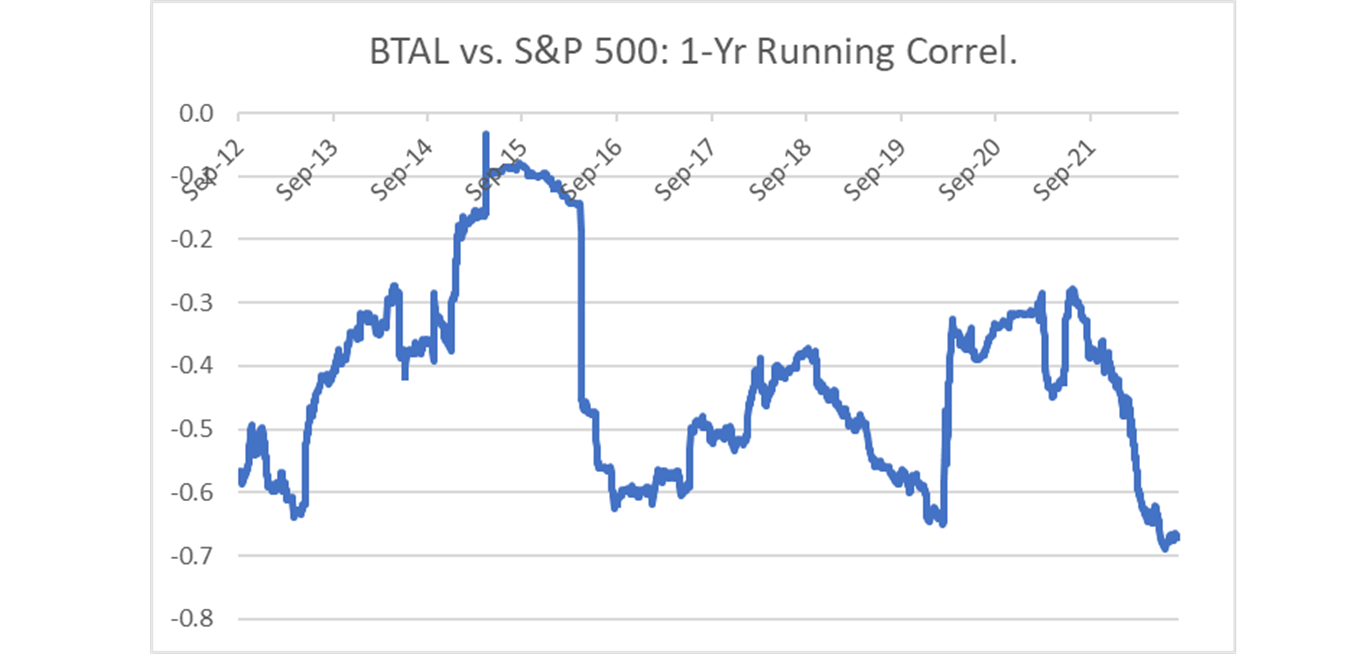
Wait… negative historical returns?
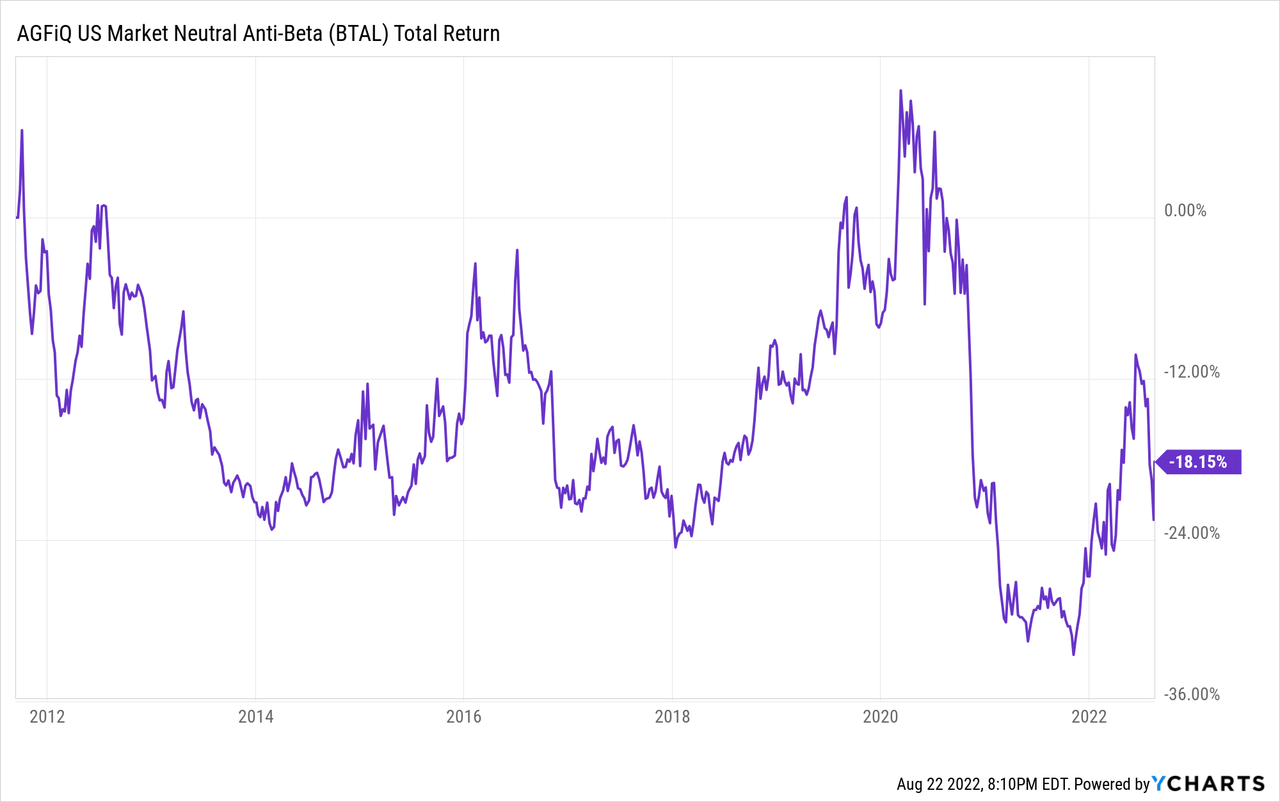
The more attentive reader may have noticed something very discouraging about this ETF. Since its inception, BTAL has returned -18% for an annual loss of around 2%, see chart below.
Why would anyone want to invest in an instrument with such pitiful track record? At best, shouldn’t BTAL be used as a speculation tool for those who have a view on how low vs. high beta stocks will perform in the future?
This is where the definition of alpha described above comes into play.
Investors that seek diversification in order to produce superior risk-adjusted returns over time probably agree on one thing: negative correlation (or negative beta, if you prefer) is a very rare but highly desirable feature to have in a portfolio. The diversification that BTAL has been able to provide to an all-equities portfolio in the past years has more than offset the small negative annual returns produced.
The chart below shows the performance of a simple portfolio over the past decade or so: 75% S&P 500 and 25% BTAL that is rebalanced quarterly, in blue. The red line represents a plain investment in the S&P 500.
Notice how the broad equities market delivered better absolute returns since late 2011 of about 3.5 percentage points per year (first blue arrow below). From this data point alone, some may jump to the conclusion that the SPY + BTAL portfolio produced negative alpha over the period. But notice the other two blue arrows below. The SPY + BTAL portfolio:
- Had a maximum loss from a peak of only 12% vs. the S&P 500’s 20% drawdown (in both cases, using month-end prices).
- Produced superior risk-adjusted performance: Sortino ratio of 2.07 vs. the S&P 500’s 1.67.
Portfolio Visualizer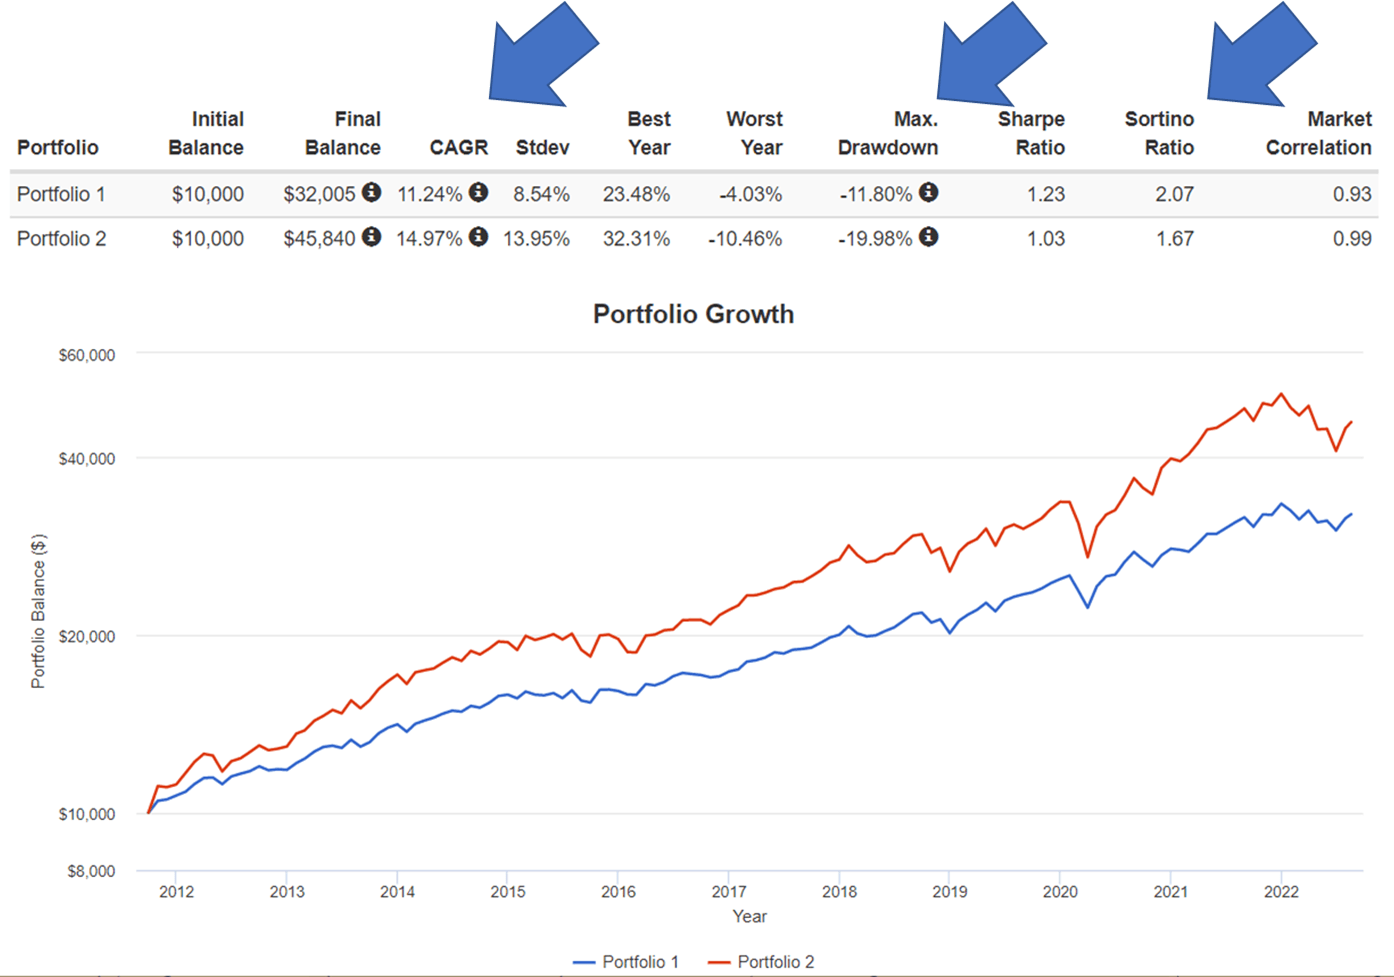
BTAL’s historical ability to zig when the stock market zags has been a huge benefit for owners of this little-known ETF. In 2022 specifically, the market-neutral fund would have helped to soften the blow of a weak stock market: the 75/25 portfolio described above would have produced YTD losses of only 4% against the S&P 500’s 11% decline so far.
Interestingly, BTAL trades a fairly low average of $6.6 million worth of shares per day, according to Yahoo Finance. Considering the usefulness of this fund as a diversifier and the low trading volumes, I believe that BTAL could be one of the best-kept secrets to producing alpha in a simple way, without the need for investors to be consistently successful at picking stocks.
What if you are a growth investor?
Some readers could be asking: “I’m a long-term, growth investor. Why should I care about better risk-adjusted performance, if what I am looking for is absolute returns over many years?”
Regardless of an investor’s time horizon and risk tolerance, I always like to think of portfolio strategy from a risk-adjusted perspective first. Once I figure out an optimal allocation that gives me the most bang for my buck, I can take advantage of reasonable levels of leverage to increase my expected return, as needed.
The chart below shows the performance of a portfolio composed of 60% twice-leveraged S&P 500 (SSO) and 40% BTAL, for notional exposure of 120% to the S&P 500. Since 2011, this portfolio would have matched the S&P 500 on maximum drawdown and volatility, while producing about 160 bps in extra returns per year — true alpha, by my definition.
Porfolio Visualizer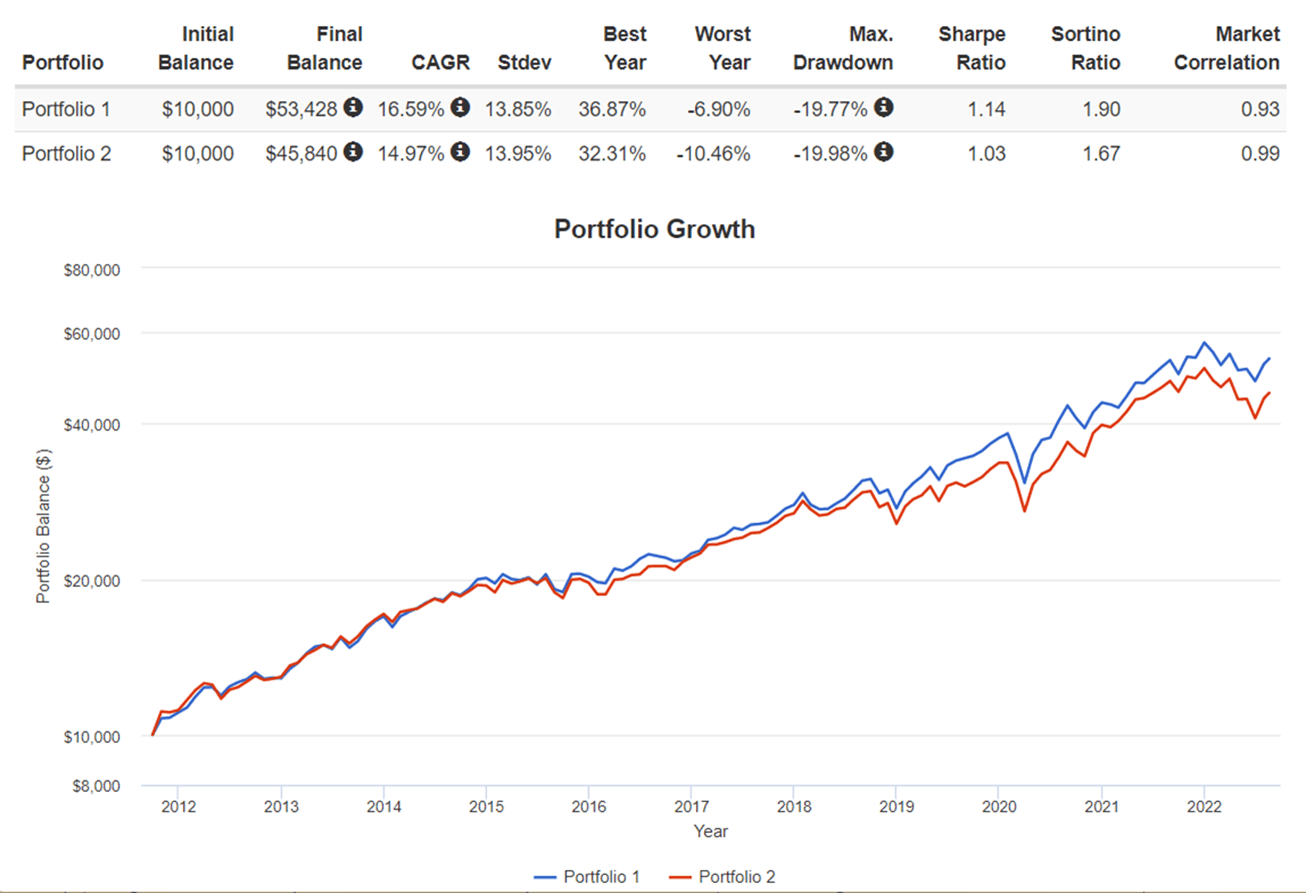
Be the first to comment