

Tippapatt/iStock via Getty Images
Adyen
In our previous coverage of Adyen N.V., (OTCPK:ADYEY) we examined its solid track record of gaining enterprise customers driving its transaction volume growth including Uber (UBER), Spotify (SPOT), eBay (EBAY) and Microsoft (MSFT) as its North America segment grew 66% and outperformed its total company growth of 28%. We expected its transaction volume growth to continue to be strong as eBay transitioned to its platform and secured new customers. Moreover, believed its partnerships with BNPL providers Afterpay (OTCPK:AFTPF), Klarna (KLAR) and Affirm (AFRM) could provide a transaction volume growth opportunity as the market was forecasted to grow at a 21% CAGR through 2027. Lastly, we examined its expansion across the payment stack with card issuing for its merchants and estimated it to generate $20 bln in transaction volume for 1 mln cards issued translating to a revenue opportunity of $200 mln based on a 1% take rate assumption.
In this analysis, we analyzed Adyen’s enterprise segment and its customers such as eBay as it transitioned to Adyen and projected its total transaction volume growth going forward. Moreover, examined its fee structure and compared it against competitors. Based on a take rate assumption, we forecasted its revenue growth with our transaction volume projection. Lastly, we analyzed its mid-market segment and contribution to its total transaction volume and compared it against competitors.
Company Growth Buoyed by Enterprise Market
Adyen focuses on processing payments for larger companies. Its Enterprise segment represents over 96% of its transaction volumes with the remainder from the Mid-Market segment which consists of businesses with annual sales of up to EUR25 mln ($28.5 mln) according to its company report.
We previously highlighted the eBay switch to Adyen which is significant due to the incremental volumes added to Adyen. eBay also announced that it is compulsory for sellers to use its managed payments system instead of its earlier statement that said sellers could still choose it as a secondary option. Based on eBay’s gross merchandise volume and Adyen’s transaction volume in 2021, we estimated eBay’s contribution to Adyen’s transaction volumes.
|
Share of eBay Transaction Volumes |
2021 |
|
eBay Gross Merchandise Volume ($ bln) |
87.37 |
|
Adyen Transaction Volume ($ bln) |
610.1 |
|
eBay as % of Adyen volume |
14% |
Source: Statista, Adyen, Khaveen Investments
Beyond eBay, we believe that there is still a massive opportunity for Adyen to grow to target larger sellers. According to the US Census and Bureaus of Labor Statistics from Block’s presentation, the US is dominated by enterprise sellers with over $100 mln in sales representing $6.2 tln in gross sales and merchants with over $25 mln in sales at $1.3 tln in total gross sales.
Block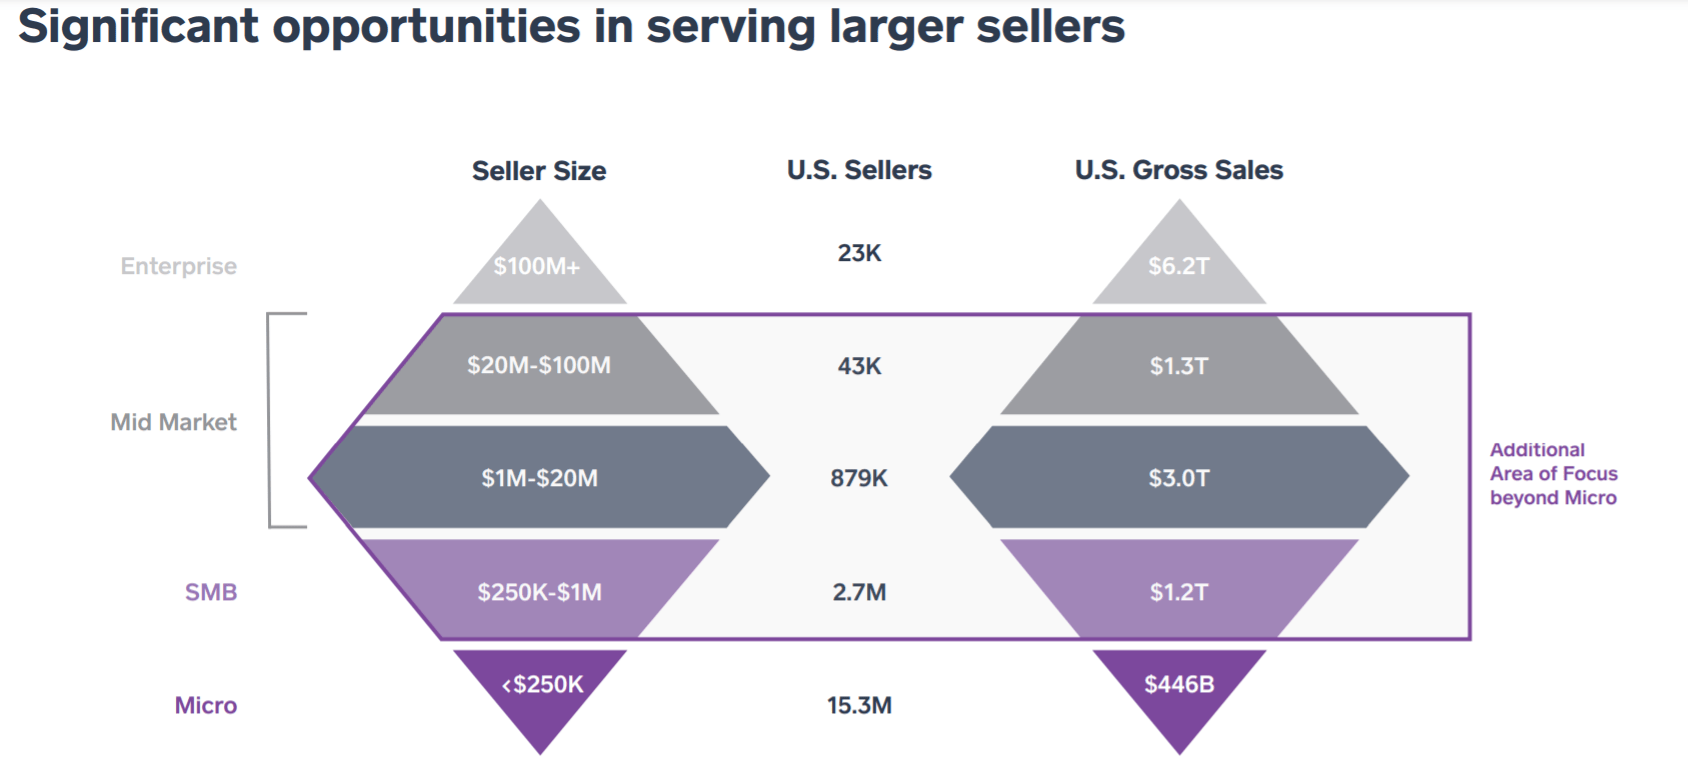
To highlight the potential transaction volumes growth, we compiled the companies which are known to be using Adyen. This includes key customers such as Microsoft, eBay, Airbnb, Uber and more. We summed up the total transaction volumes of these companies as the opportunity for Adyen’s volume growth totaling $490bln.
|
Company |
Transaction Volume ($ bln) |
|
Microsoft (MSFT) |
143.02 |
|
eBay |
87.37 |
|
Uber (UBER) |
57.0 |
|
Wise (OTCPK:WPLCF) |
53.76 |
|
Netflix (NFLX) |
24.9 |
|
Airbnb (ABNB) |
23.9 |
|
Booking.com (BKNG) |
23.9 |
|
McDonald’s (MCD) |
21.08 |
|
Gap Inc (GAP) |
13.8 |
|
Etsy (ETSY) |
10.3 |
|
Spotify (SPOT) |
8.9 |
|
|
8 |
|
Tory Burch |
6.2 |
|
KLM (OTCPK:KLMR) |
5.8 |
|
Groupon (GRPN) |
1.41 |
|
Mango |
0.88 |
|
de Bijenbkorf |
0.173 |
|
Evernote |
0.05 |
|
O’neill |
0.05 |
|
Total |
490.49 |
Source: Company Data
We revised our transaction volume projections in 2022 based on its past 5-year average growth rate (51.5%) but tapering down by 5% per year as a conservative assumption.
|
Adyen Transaction Volume Projections |
2018 |
2019 |
2020 |
2021 |
2022F |
2023F |
2024F |
2025F |
2026F |
|
Transaction volume (EUR bln) |
159 |
239.6 |
303.6 |
516 |
756 |
1,070 |
1,460 |
1,920 |
2,430 |
|
Transaction volume (USD $ bln) |
188 |
268 |
346 |
609 |
892 |
1,262 |
1,723 |
2,266 |
2,867 |
|
Change % |
53.2% |
43.0% |
29.0% |
75.9% |
46.5% |
41.5% |
36.5% |
31.5% |
26.5% |
Source: Adyen, Khaveen Investments
Overall, Adyen’s growth has been driven by its Enterprise segment catering to large corporations with the likes of eBay accounting for 14% of its transaction volumes. The switch of eBay to Adyen has benefited the company with incremental transaction volume growth and we expect its growth to be sustained with its key clients, including Microsoft, Wise, Uber and more with a total transaction volume pool that we estimate at over $500 bln in 2020. With the large opportunity targeting larger sellers, we expect robust growth in its transaction volumes at 46.5% in 2022.
Pricing Attractiveness of Adyen to Larger Merchants
We analyzed and compared the merchant acquirers based on fees and countries available. Adyen has the lowest price among all as it adopts the interchange + + pricing model, whereas the competitors use a blended fee structure. However, PayPal topped the number of countries available where it provides payment processing services in more than 200 countries while Adyen is only nearly 50 countries.
Source: Adyen, Block, Paypal, Stripe, Worldpay, First Data, Global Payments, CardFellow
The key difference between Adyen and competitors is the pricing model it adopts which is called interchange ++. According to Adyen, the model breaks down the payment fee into an interchange fee that goes to the bank that issues the card, a scheme fee that goes to Visa or Mastercard and a processing fee charged by the payment service provider. On the other hand, the blended pricing model consists of a flat rate of usually between 2.5% to 2.9% plus a fixed fee which depends on the region.
A fixed fee model is simpler and relatively more straightforward. However, in an interchange ++ model, it is more transparent by breaking down the fees to the card-issuing bank, card schemes (Visa or Mastercard) and the payment service provider respectively. More importantly, this pricing model could have a lower overall fee if the interchange rate is low, as depicted by the diagram below.
Adyen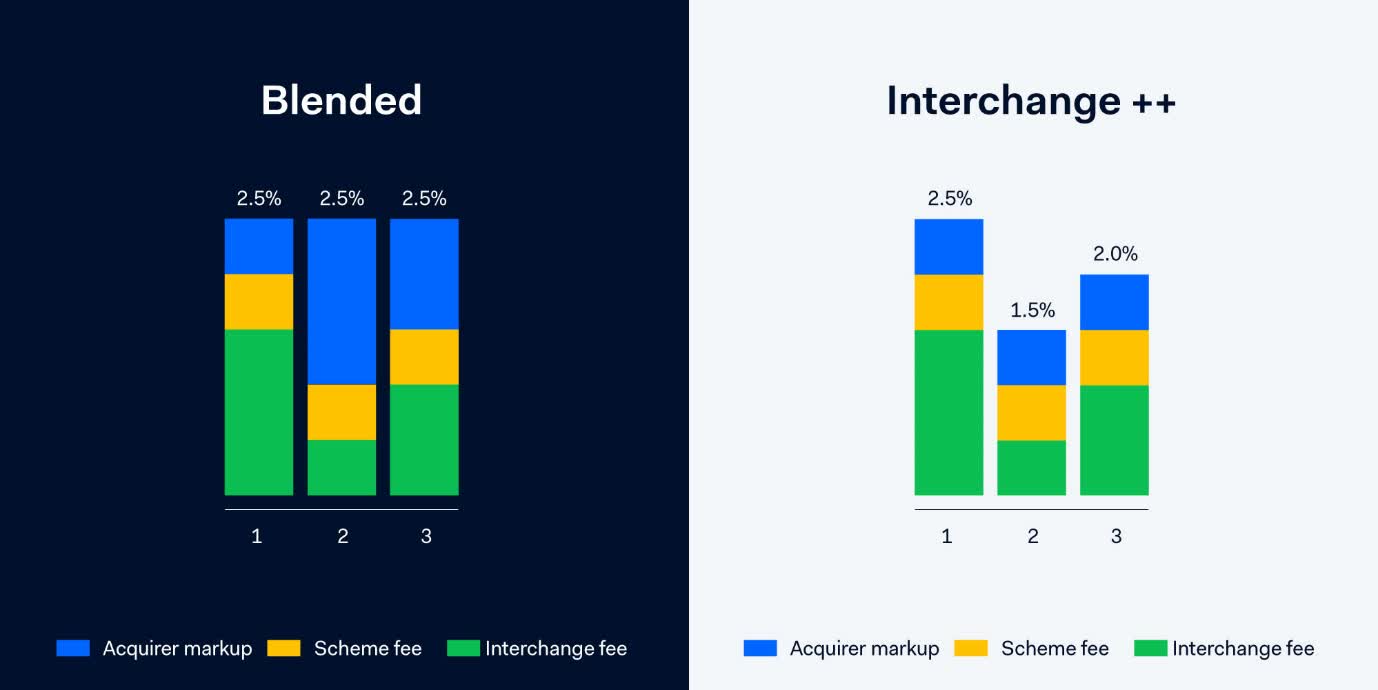
In order to maintain its competitiveness to attract its target market, we continue to expect its take rate to remain stable going forward. In the past 5 years, its take rate has ranged between 0.99% to 1.2%. We assumed a stable take rate of 1.2% through 2026 to derive our total revenue projections for the company in the table below.
|
Adyen Transaction Revenue Projections |
2018 |
2019 |
2020 |
2021 |
2022F |
2023F |
2024F |
2025F |
2026F |
|
Transaction volume (EUR bln) |
159 |
239.6 |
303.6 |
516.0 |
756.0 |
1069.8 |
1,460 |
1,920 |
2,430 |
|
Change % |
46.7% |
50.7% |
26.7% |
70.0% |
46.5% |
42% |
37% |
32% |
27% |
|
Take Rate |
1.0% |
1.1% |
1.2% |
1.2% |
1.2% |
1.2% |
1.2% |
1.2% |
1.2% |
|
Revenues (EUR bln) |
1.65 |
2.66 |
3.64 |
6.00 |
8.78 |
12.43 |
16.97 |
22.31 |
28.23 |
|
Revenues ($ bln) |
1.95 |
2.98 |
4.15 |
7.07 |
10.36 |
14.67 |
20.02 |
26.33 |
33.31 |
|
Revenue Growth |
70.6% |
52.6% |
39.5% |
70.4% |
46.5% |
41.5% |
36.5% |
31.5% |
26.5% |
Source: Adyen, Khaveen Investments
Overall, we cite Adyen’s attractive fee structure as being its competitive advantage against competitors. The company adopts an interchange ++ model which enables a significantly lower and more transparent fee structure which may be advantageous to larger sellers with global operations. While it is growing faster than competitors, the downside is that its take rate and revenue generation per transaction is lower than competitors. Additionally, the company’s competitive advantage could be changed if competitors decide to adopt a similar fee structure.
Struggling in the Mid-market Segment
As mentioned, Adyen primarily targets larger customers with higher sales known as its Enterprise customers accounting for over 96% of volumes. The remainder comprises the Mid-market segment targeting customers with up to EUR25 mln in annual sales. Globally, Statista estimates around 213 mln SMEs worldwide. In the US, it is around 31.7 mln small businesses and approximately 22.5 mln in the EU.
In comparison to its Enterprise segment, its Mid-Market segment growth has underperformed growing by 27% in 2021 versus 71.6% for its Enterprise segment based on its interim reports. Among factors which we believe could explain its underperformance is the greater competition in this space. Based on data from GetApp, we summarized the number of features that each company offers such as cash management, multi-currency, invoice management, reporting & statistics etc. In addition, we also examined software integrations with third-party software providers including Big Commerce, Shopify (SHOP), WordPress, Slack and more. We found that Adyen has the lowest number in terms of features and total integrated platforms. Thus, we believe that this places it at a disadvantage to target smaller merchants by being outcompeted by competitors in terms of value-added features and services.
|
Company |
Adyen |
Block |
Stripe |
Paypal |
|
Number of Features |
31 |
36 |
34 |
79 |
|
Total Integration |
67 |
84 |
1381 |
987 |
Source: GetApp
Compared to its competitors, Adyen’s Mid-market segment transaction volume growth is lower than Block, PayPal and Stripe but had higher growth than Block on a 2-year average.
|
Company |
Transaction Volume ($ bln) |
2-year Average Growth % |
|
Adyen (Mid-Market Segment) |
EUR13.70 |
23% |
|
Block |
152.8 |
21% |
|
Paypal |
1,250 |
33% |
|
Stripe* |
350 |
133% |
*2020 figures
Source: Adyen, Block, Business of Apps, CBinsights
With the greater attractiveness of competitors’ offerings, we do not expect this segment to outperform its core Enterprise segment going forward and expect it to remain only a minor portion of its transaction volumes. We projected the Mid-Market segment in 2022 based on its past 2-year average growth rate of 23.4% tapered down by 5% per year as a conservative estimate.
|
Transaction Volumes (EUR bln) |
2019 |
2020 |
2021 |
2022F |
2023F |
2024F |
2025F |
2026F |
|
Enterprise |
230.6 |
292.8 |
502.3 |
739.1 |
1049.8 |
1437.6 |
1895.8 |
2404.1 |
|
Growth % |
48.8% |
27.0% |
71.6% |
47.1% |
42.0% |
36.9% |
31.9% |
26.8% |
|
Mid-Market |
9 |
10.8 |
13.70 |
16.91 |
20.03 |
22.71 |
24.63 |
25.47 |
|
Growth % |
125.0% |
20% |
27% |
23.4% |
18.4% |
13.4% |
8.4% |
3.4% |
|
Total |
239.6 |
303.6 |
516 |
756.0 |
1,070 |
1,460 |
1,920 |
2,430 |
|
Growth % |
50.7% |
26.7% |
70.0% |
46.5% |
41.5% |
36.5% |
31.5% |
26.5% |
|
Mid-Market as % of Total |
3.8% |
3.6% |
2.7% |
2.2% |
1.9% |
1.6% |
1.3% |
1.0% |
Source: Adyen, Khaveen Investments
All in all, while we believe that the company has a significant advantage towards larger clients with an attractive fee structure, its lower attractiveness to smaller merchants relative to key competitors such as Block and Paypal inhibits its growth in the Mid-market segment which only represents 2.7% of its total transaction volumes. We compared the range of value-added features and third-party software integration among its competitors and believe its lack of features places it at a disadvantage to competitors. Based on our projection, we expect its mid-market segment to remain a small contributor to its transaction volume through 2026.
Risk: Limited Upside to Take Rate
As highlighted, the company has an attractive fee structure by incorporating an interchange ++ pricing model compared to the flat fee-based model. While we believe this provides it with a significant advantage compared to competitors, we highlight the risk of the company increasing its take rate going forward. We believe that if the company increases its fees to merchants to raise its take rate to generate more revenues, this could diminish its competitiveness among large merchants and threaten its ability to sustain its high growth. Also, as the company targets larger merchants, we believe that the bargaining power of buyers is relatively higher than in the mid-market and SMBs market. All in all, we believe this to be a risk if transaction volume growth slows and the company has limited opportunity to raise its take rate without sacrificing its competitive advantage.
Valuation
Adyen has had average revenue growth of 58% for the past 5 years. Its gross and net margins have a 5-year average of 14.6% and 7.8% respectively. With the intense competition, we believe its margin upside is limited and projected its margins as shown in the chart below.
Adyen, Khaveen Investments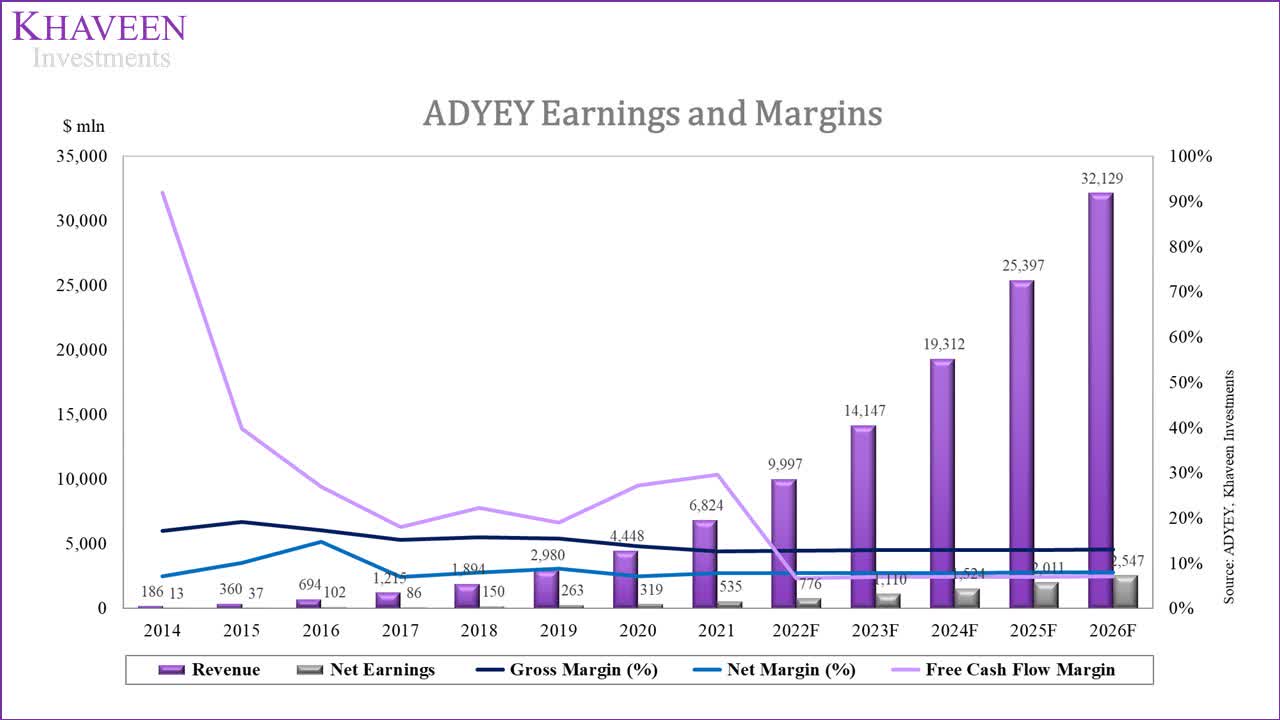
Adyen’s FCF margins have been an average of 23.23% for the past 5 years. The company’s average capex as % of revenue is 0.8% in the past 5 years which indicates its asset-light model. The company’s operating cash flows are affected by changes in receivables and payables to merchants and financial institutions. The flow of payments that it facilitates between buyers and sellers takes up to 2 days for the funds to be reflected in the merchant’s account according to Adyen. This affects the balances of the payables and receivables regarding the flow of funds. In our cash flow forecasts, we excluded this impact for a more accurate forecast of its cash flows.
Adyen, Khaveen Investments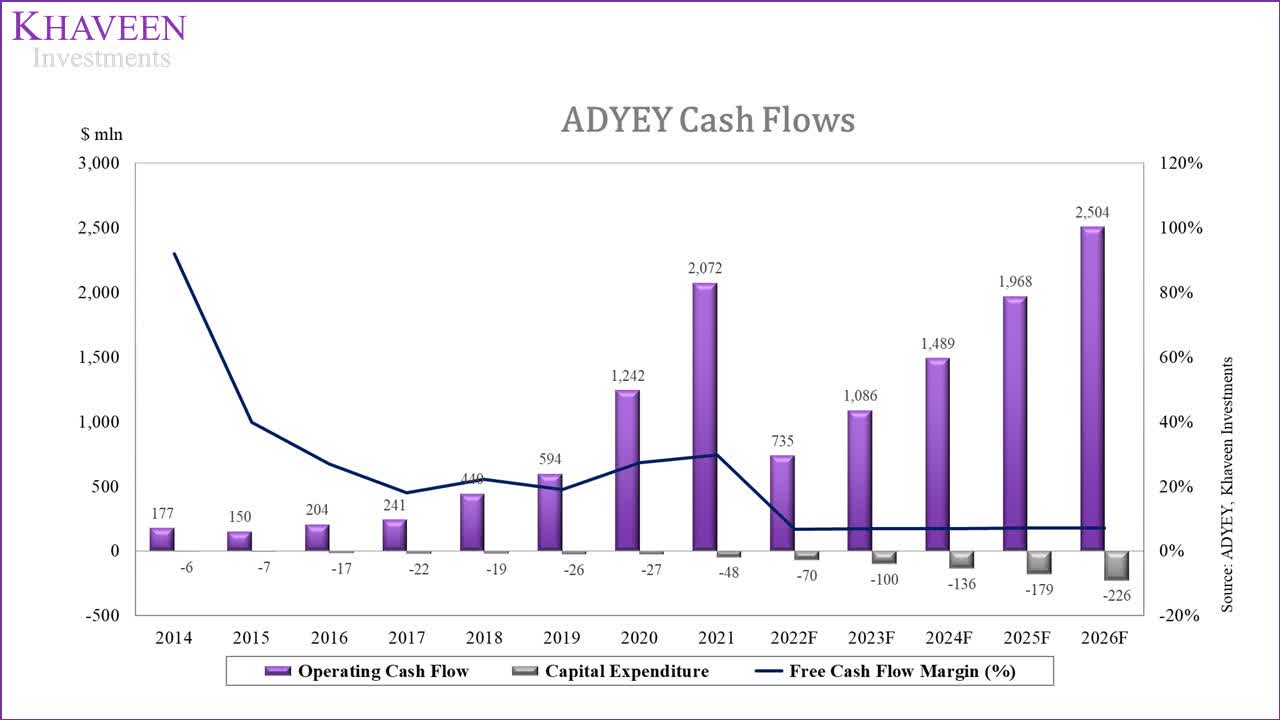
As the company has positive FCFs, we valued them using a DCF valuation with the terminal value based on an EV/EBITDA average of selected fintech companies at 29.32x.
SeekingAlpha, Khaveen Investments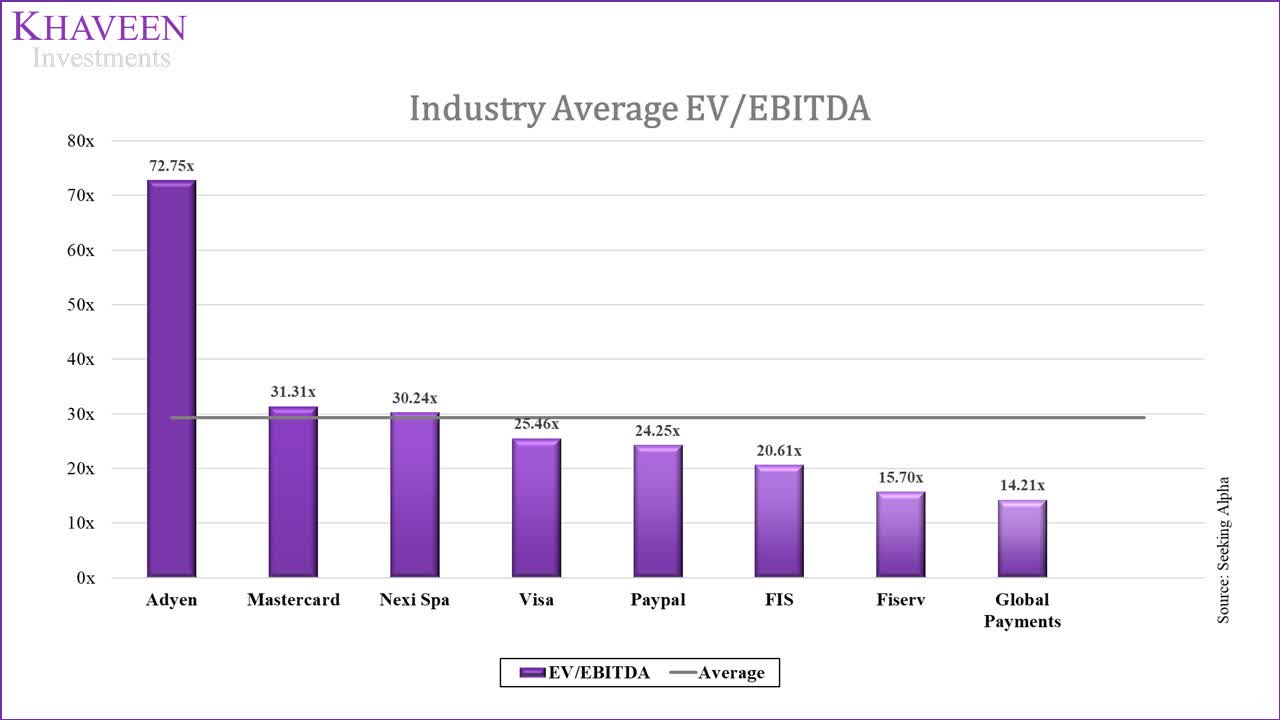
We projected its revenue growth based on its transaction volumes and take rate assumptions as summarized in the table below.
|
Adyen Revenue Projections |
2018 |
2019 |
2020 |
2021 |
2022F |
2023F |
2024F |
2025F |
2026F |
|
Revenues (EUR bln) |
1.65 |
2.66 |
3.64 |
6.00 |
8.78 |
12.43 |
16.97 |
22.31 |
28.23 |
|
Revenues ($ bln) |
1.95 |
2.98 |
4.15 |
7.07 |
10.36 |
14.67 |
20.02 |
26.33 |
33.31 |
|
Revenue Growth |
70.6% |
52.6% |
39.5% |
70.4% |
46.5% |
41.5% |
36.5% |
31.5% |
26.5% |
Source: Adyen, Khaveen Investments
Based on a discount rate of 9.1% (the company’s WACC), we obtained an upside of 54%. Overall, our valuation is higher than our previous analysis of $57.90 (pre-stock-split), as the stock price has declined by around 32%, while the company’s strong fundamentals still remain intact.
Khaveen Investments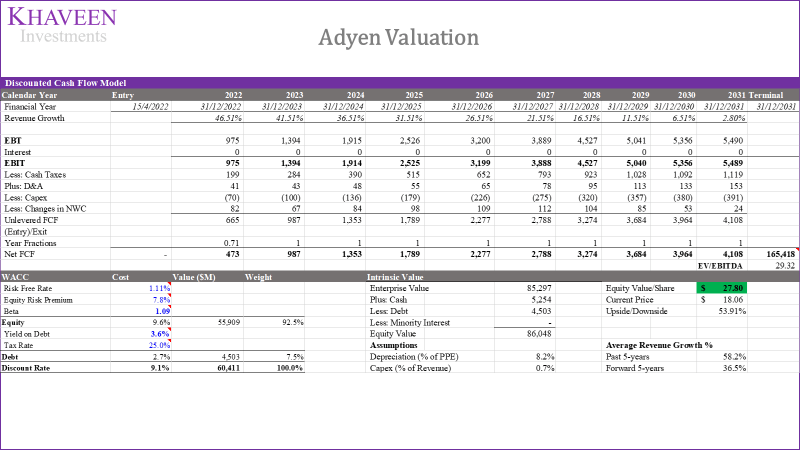
Verdict
In this analysis of Adyen, we focused on its Enterprise segment as a core segment representing 96% of its transaction volumes. We highlighted its massive opportunity in targeting larger sellers and its customer relationships with key companies which we estimate a transaction volume opportunity of around $500 bln based on these clients. Driven by its enterprise segment growth, we forecasted its transaction volume to grow by 46.5% in 2022. Moreover, we highlighted its strengths with a competitive fee structure using the interchange ++ pricing model and compared its fees against competitors using a flat-based fee model. With a take rate assumption of 1.2% based on its 2021 figure, we forecasted its revenue growth through 2026 as we expect competition to limit the growth of its take rate. Finally, we determined that its Mid-market segment is at a disadvantage to competitors as it underperformed its Enterprise segment and highlighted its weakness in terms of the breadth of features and third-party software integrations, and forecasted its mid-market segment to only account for 1% of total volumes by 2026. Thus, we rate the stock as a Strong Buy with a price target of $27.80.
Be the first to comment