

Kostikova
Investment summary
After a tremendously strong quarter across its portfolio, we have revised our rating on AdaptHealth Corp. (NASDAQ:AHCO) up from a hold to a buy. In our previous note on AHCO, we noted several supportive factors in the investment debate, but we viewed little scope for upside at its valuation of $16-$18.90. Since the last report, AHCO shares have rallied ~15% and pushed ahead of this target range. Consequently, we are now far more constructive on AHCO stock.
What’s changed from our previous coverage:
- AHCO’s growth trends normalizing to more sustainable levels of 9-10% at the top line. We see good carry of this income down the P&L when looking ahead.
- Management made a negligible revision to FY22 guidance and now sees $2.95-$3.01Bn at the top (vs. $2.84-$3.04Bn previously) – still 22.3% YoY upside in turnover, driven by the company’s base of 3.9mm patients.
- We see tremendous EPS upside that may yet be fully reflected in the share price.
- Supporting technicals.
Net-net, we rate AHCO a buy and are seeking an initial return objective of 25% in the name.
AHCO Q3 earnings demonstrate strong EPS upside ahead
Turning to AHCO’s earnings snapshot, 90% of turnover stemmed from rental or recurring revenue, with ~10% from one-time sales. Overall revenue grew 15.8% YoY to $765.5mm, driven by growth across the portfolio and favorable product mix (Exhibit 1).
Drilling in deeper, we note the sleep division outpaced expectations, with a 14.6% YoY gain to $270.6mm. It contributed ~36% to the topline and hence carried through well to overall revenue growth in the quarter.
Similar growth routes were seen in the diabetes segment, up 25.6% YoY to $173mm and building on a strong previous quarter.
Exhibit 1. AHCO’s Q3 revenue breakdown
Data: AHCO Q3 FY22 Financial Supplement pp. 4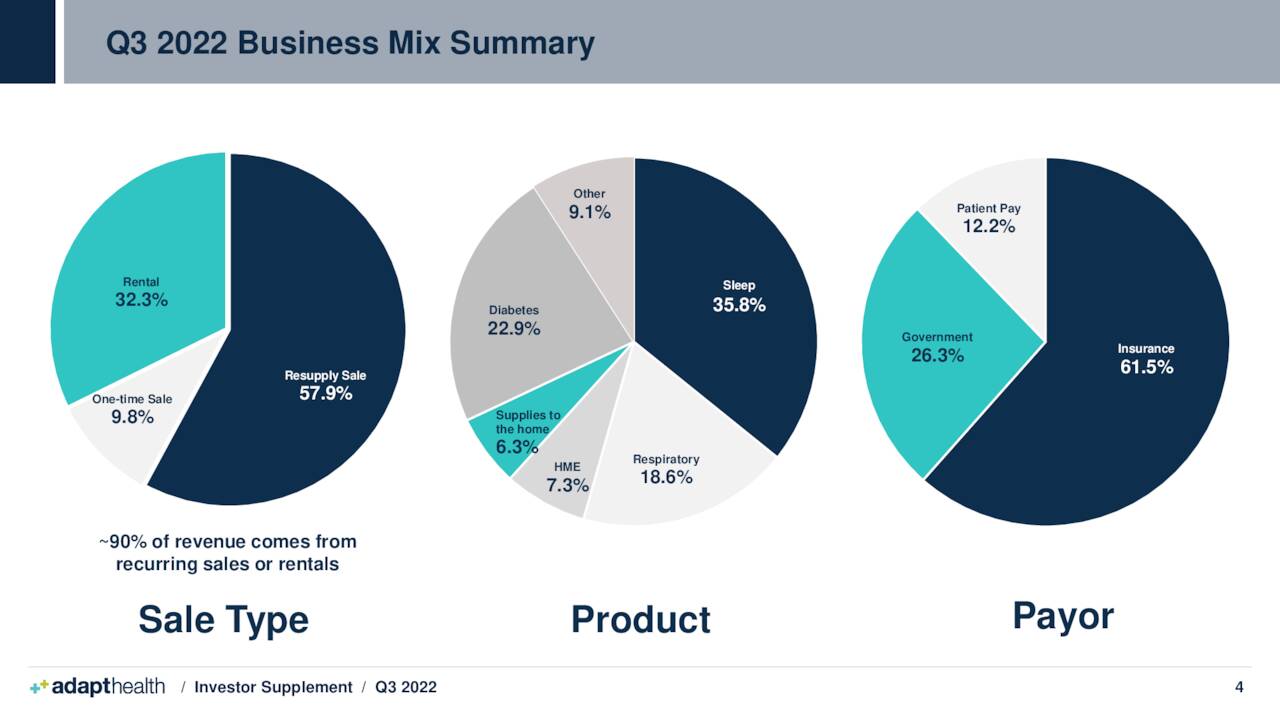
We should note the company’s strong cash conversion as well, with a net CFFO of $107mm clipped for the quarter, up from c$27mm the year prior. It made this on CapEx of $94.2mm, or 12.3% of turnover. Formerly, we noted it was c.10.5% of turnover in Q2 FY22.
As we also touched on previously, free cash flow (“FCF”) and ROIC have both trended south for AHCO. Profitability wise, however, it is still well-positioned against sector peers. It delivered a TTM return of equity of 4.20%, and 3.6% return on capital last quarter, above the sector median’s -38% and -21.95% respectively.
With the growth numbers seen last period, it’s equally as pleasing to see management retain guidance within a firm range, despite a slight revision downward. It now sees $2.95-$3.01Bn at the top instead of $2.84-$3.04Bn, as mentioned beforehand. We’d note this is still >22% YoY upside, and we see this carrying down well vertically through the P&L.
This presents us with very exciting growth percentages on a forward-looking basis, seen in Exhibit 2. We see 74% EPS growth in Q4 FY22, stretching up to 199% YoY growth in Q2 FY23. This is driven by a projected $630.3mm in FY22 core EBITDA, lifting up to $729.5mm the year afterward. Full projections are seen in Exhibit 3.
We don’t feel the market has correctly factored this into the AHCO share price.
Exhibit 2. Tremendous EPS growth upside yet to be factored into share price.
- Note: Growth assumptions underpinned by revenue upsides this quarter and sustained revenue growth at 9-10%.
- Represents growth to 3.9x FY22 EBITDA and 4.5x FY23 EBITDA, respectively.
- We see this pulling to EPS of $0.20 in Q1 FY23 and $0.27 in Q2 FY23.
Data: HB Insights Estimates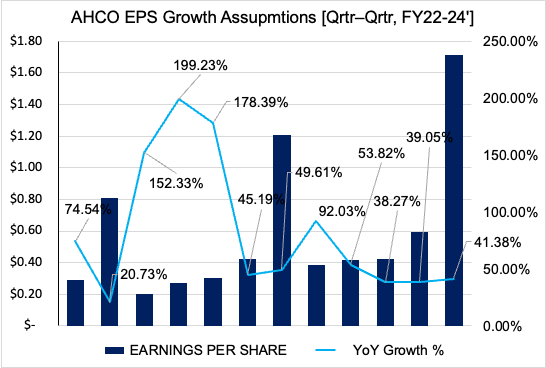
Exhibit 3. AHCO projections (qrtly, annual) FY22-24′.
Note: EPS estimates in red circle:
Data: HB Insights Estimates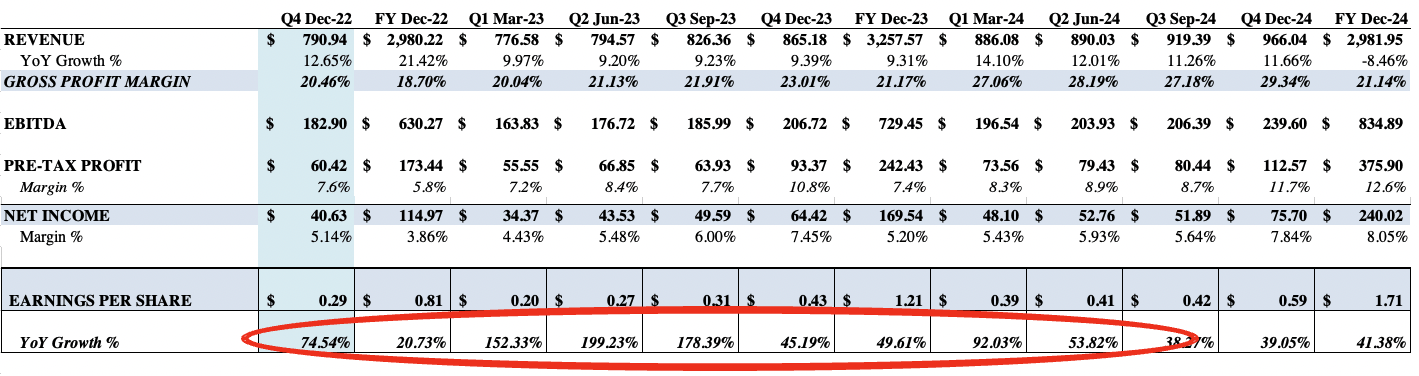
The technical picture for AHCO
Momentum seen on the chart below (via technical studies) adds further weight to the risk/reward calculus. Shares bounced from May lows and have continued within the ascending channel shown (Exhibit 4).
The 50DMA and 250DMA crossed in June and have been on trend ever since, corresponding to strong price action. The first upside move from May extended 14 weeks, before consolidating back to range, closing below the 50DMA.
It then reversed with strong volume and has closed above the 50DMA the last 5 weeks. Another turn off this ascending base would be a great signal for further upside in our estimation.
Exhibit 4. Technical data supportive of further upside – riding 50DMA with support, testing ascending base. Volume trend increasing.
Data: Updata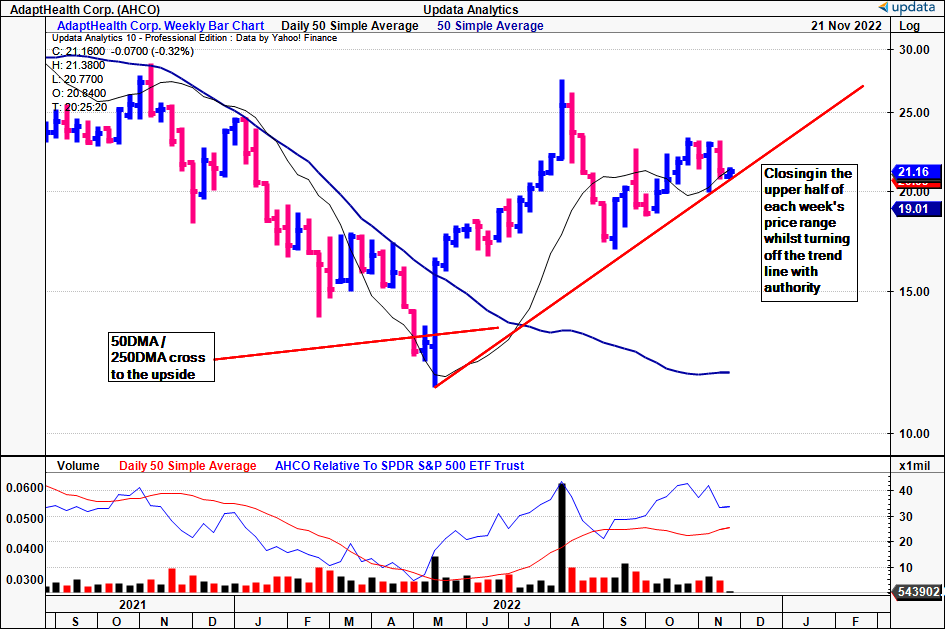
Meanwhile, there’s supportive price action up to targets of $27.25 from point and figure charting (Exhibit 5). These charts are terrific in removing the noise of time, and just seeing price action instead.
To date, the AHCO share price has displayed good confluence to these targets, giving confidence in their use looking ahead.
Exhibit 5. Upside targets to $27.25.
Data: Updata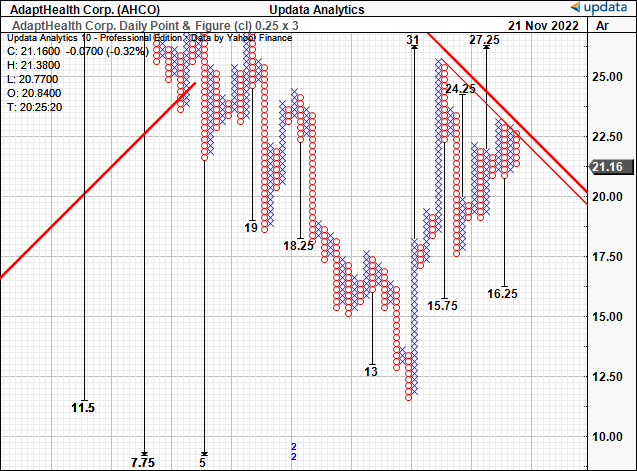
Valuation and conclusion
Checking where AHCO is being priced by the market, we see that the consensus estimates it to trade fairly at ~28x forward earnings. This is on a PEG ratio of 1.2. This heavily underweights the company’s EPS upside in our opinion. Either way, the S&P 500’s forward P/E estimate for FY22 is 18.18x. Thus, I expect AHCO to outpace the benchmark.
Using our FY22 EPS growth assumptions, we believe AHCO should price up at 32.38x forward P/E. Assigning the 32.38x multiple to our FY22 EPS estimates derives a price target of $26.20 (Exhibit 6).
We see a target of $26.20 when assigning calculating AHCO’s Q1 FY22 TTM estimates, seen in Exhibit 7. It is also a shade off the technical target derived above.
Both instances represent nearly 25% upside potential and, therefore, $26.20 serves as our initial price objective.
Exhibit 6. FY22 EPS Est. x 32.38 fair P/E = $26.20.
Note: Fair forward price-earnings multiple calculated as 1/fair cost of equity. This is known as the ‘steady state’ P/E. For more and literature see: [M. Mauboussin, D. Callahan, (2014): What Does a Price-Earnings Multiple Mean?; An Analytical Bridge between P/Es and Solid Economics, Credit Suisse Global Financial Strategies, January 29 2014] (Data: HB Insights Estimates)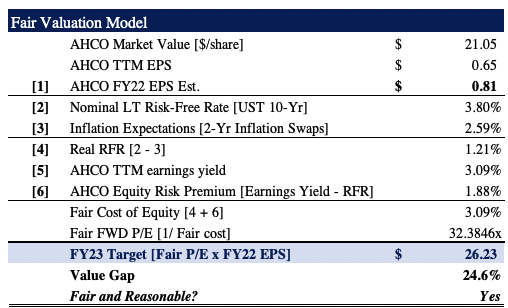
Exhibit 7. FY23 EPS Est. x ~26 fair P/E = $26.20. Good confidence around this target.
Note: As above (Date: HB Insights Estimates)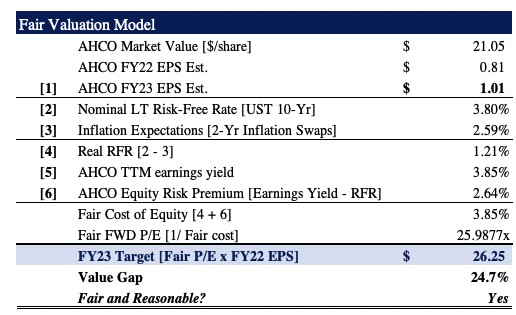
Net-net, we’ve revised our rating on AHCO from a hold to a buy following its growth trajectory and recent fundamental momentum. We see supporting technicals in favor of this, also. In addition, we see a return potential of 25% to an initial price objective for AdaptHealth Corp. of $26.20. Rate AdaptHealth Corp. buy.
Be the first to comment