

majorosl/iStock via Getty Images
Produced by Ryan Wilday with Avi Gilburt and Jason Appel
In my article, Bitcoin And Ethereum Are Parting Ways, I explained how Ethereum (ETH-USD) was far more likely to reverse out of its bear market than Bitcoin (BTC-USD). This was assumed to be true, as long as Ethereum held $1000. So far, not only has Ether held $1000, but it has staged a solid, impulsive reversal, which opens the door to $10K and beyond.
Ethereum, daily (Motivewave Software)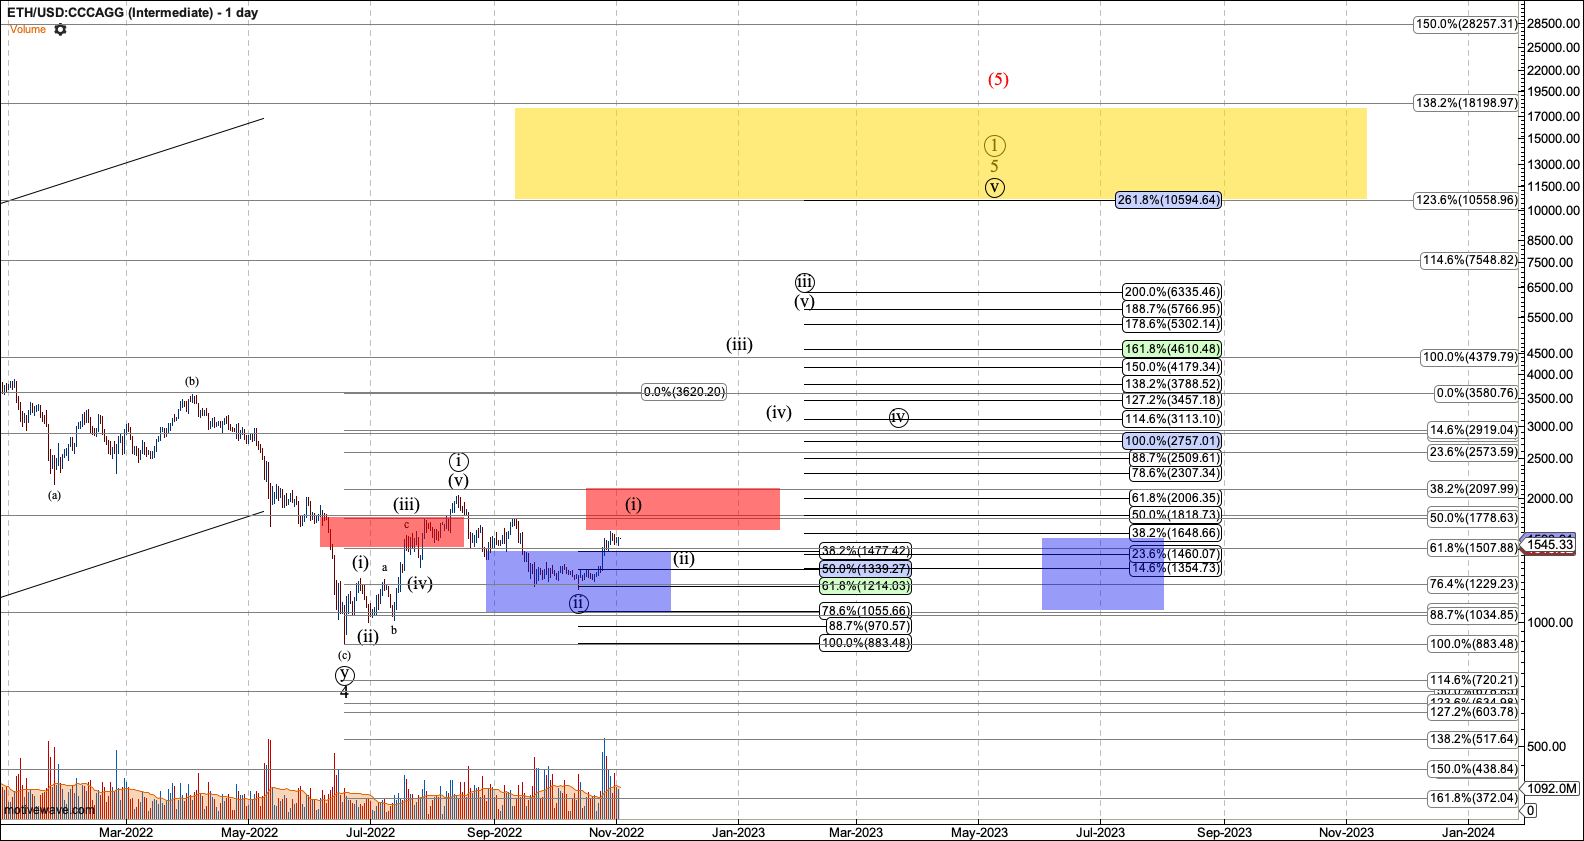
The ETH/BTC chart is also evidence of Ether’s relative strength and is gunning for 0.10+ Bitcoin per Ether.
ETH/BTC (Motivewave Software)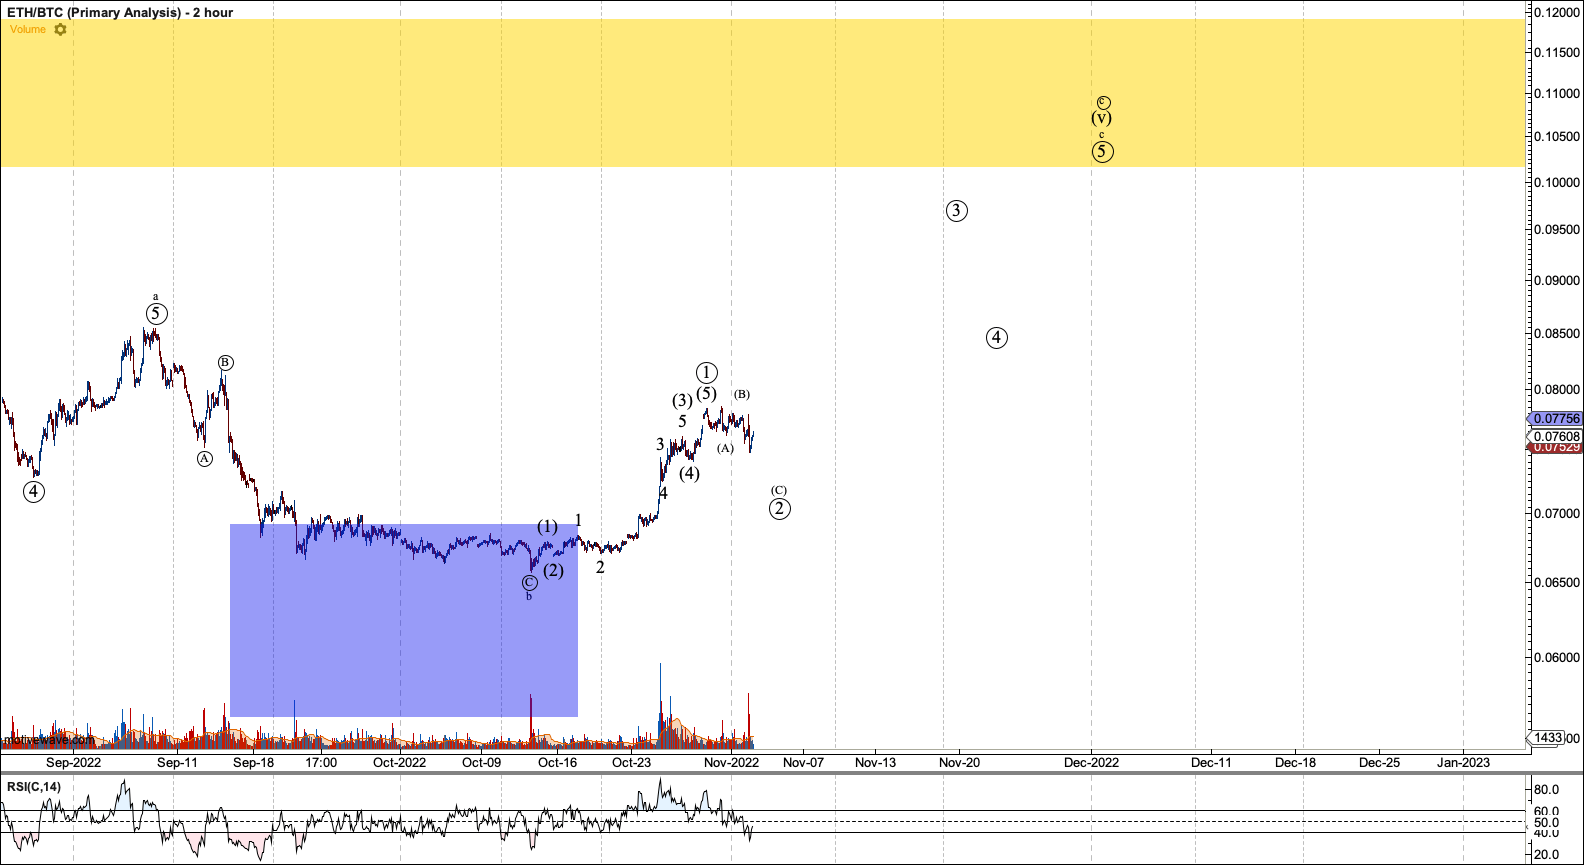
To be clear, despite Bitcoin’s recent rally, the risk of breaking $16K still looms. More importantly, the Bitcoin chart is less certain. So, unless you are looking for long-term dollar cost averaging, it’s good to wait for Bitcoin’s trend to clarify. Either Jason or I should post a Bitcoin article once the situation becomes clearer.
Sometimes, Ether strength can portend strength in other altcoins. In the Crypto Waves service, we selected several altcoins, other than Ethereum, that we wanted to focus on during the latter part of 2022. Jason highlighted three of our picks in a series of articles:
I wanted to use this article to focus on AAVE, as there are very clear signals that it should finish the year strong and possibly continue higher into 2023.
Before I start, both Jason and I like to remind readers and subscribers that altcoins are speculative investments. Most altcoins do not outperform Bitcoin from cycle to cycle. And many are bullish for one cycle but do not survive the inevitable bear market. Thus, we consider most altcoins great swing trade vehicles, not long-term investments.
Further, when we list levels where a count and its target are unreliable and that level is breached, we will most likely change our view. And that means we may cut the position to fumes or stop out completely. We don’t make money by being right all the time. We make money by taking trades close to stops, cutting the risk when they fail and building on the winners.
AAVE: Positioned For Wave Five
In his article on AAVE, Jason gave a nice breakdown of the long-term chart, which had a strong third wave into its 2021 top. Provided that the fourth wave held the 50% retrace of the third, the chart was well positioned for a fifth wave. The 50% retrace of the third is $24, which held with room to spare in the June low. Should that low continue to hold, my ideal fifth wave target is $2200 to $3300. It may fall short or go higher. But this would be the ideal target region.
AAVE, daily (Tradingview.com)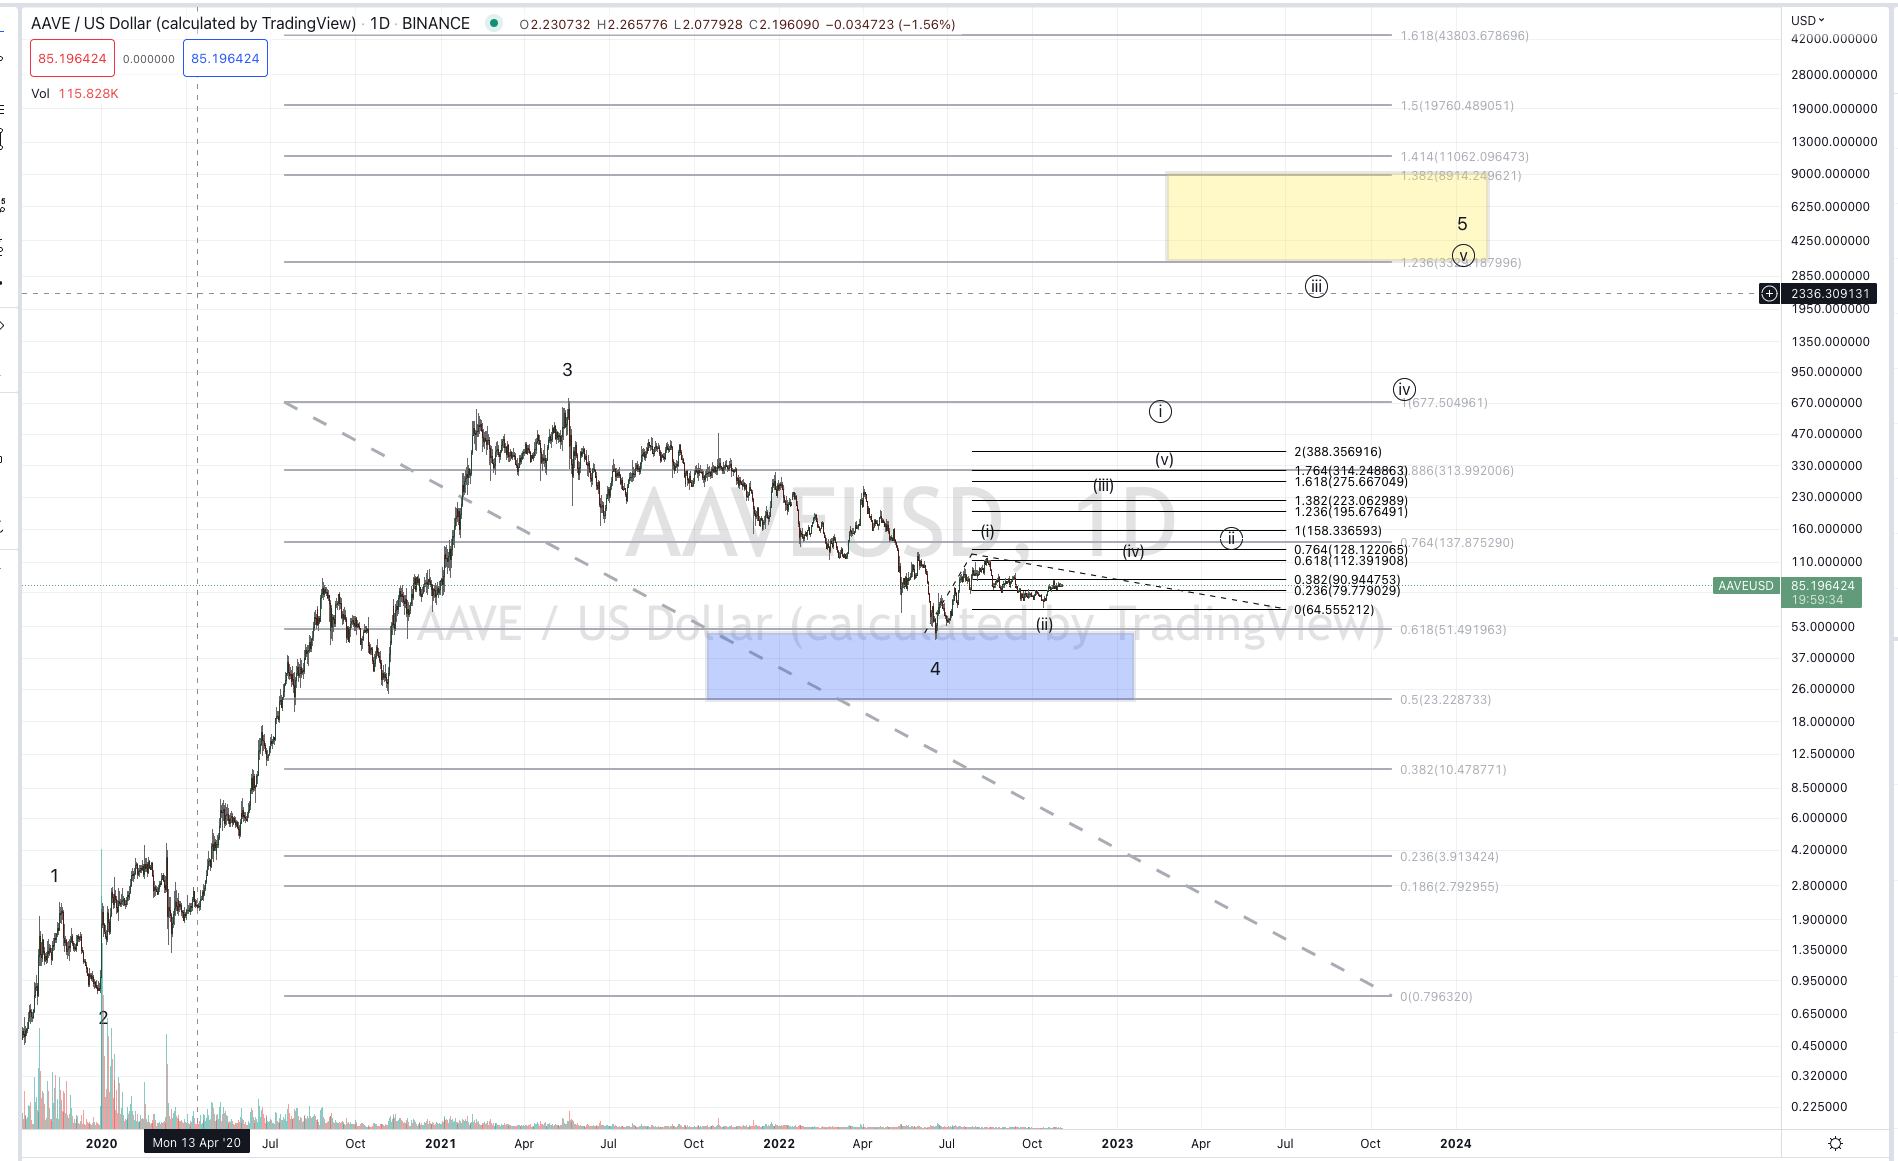
The Swing Setup
To be honest, AAVE’s move off the June low for wave (i) is imperfect. However, it does seem to have a solid leading diagonal, which is a fairly frequent pattern for first waves. However, because leading diagonals are suspect, the wave (ii) support becomes the litmus test between a tradeable setup and one to avoid.
AAVE’s wave (i) topped at $115.80. Support for wave (ii) is the .764 log retrace back to the June low. That level was $56. After topping in wave one, AAVE formed a clean wave (ii) with the commensurate A-B-C structure. And, rather than breaking down to the .764 retrace, it held the more desirable .618 retrace at $65.
Since hitting that low at $65, AAVE has staged a strong impulsive rally, which is still in progress today. This rally is aiming at $94–96, which is where we expect an interim top. That top should mark the first wave of wave 3 (i of (iii)).
We should never expect markets to offer us certainty. Trading and investing require that we do our best to ascertain the probability of success, the risk involved in a trade along with how much the potential profit might be. Ideally, risk and potential profit are measurable. That said, Elliott Wave analysis can identify when the probability is “cascading” in favor of a trade. One indication that the trend is turning is when wave one forms with all five waves. If after wave one tops, a three-wave pullback in wave two holds support, we have another uptick in the probability of a successful trade. Finally when the first wave of the third forms, the probability improves further.
This is the state of the AAVE chart today. AAVE has completed waves (i) and (ii) and is close to completing wave-i of (iii).
AAVE, daily zoomed in (Tradingview.com)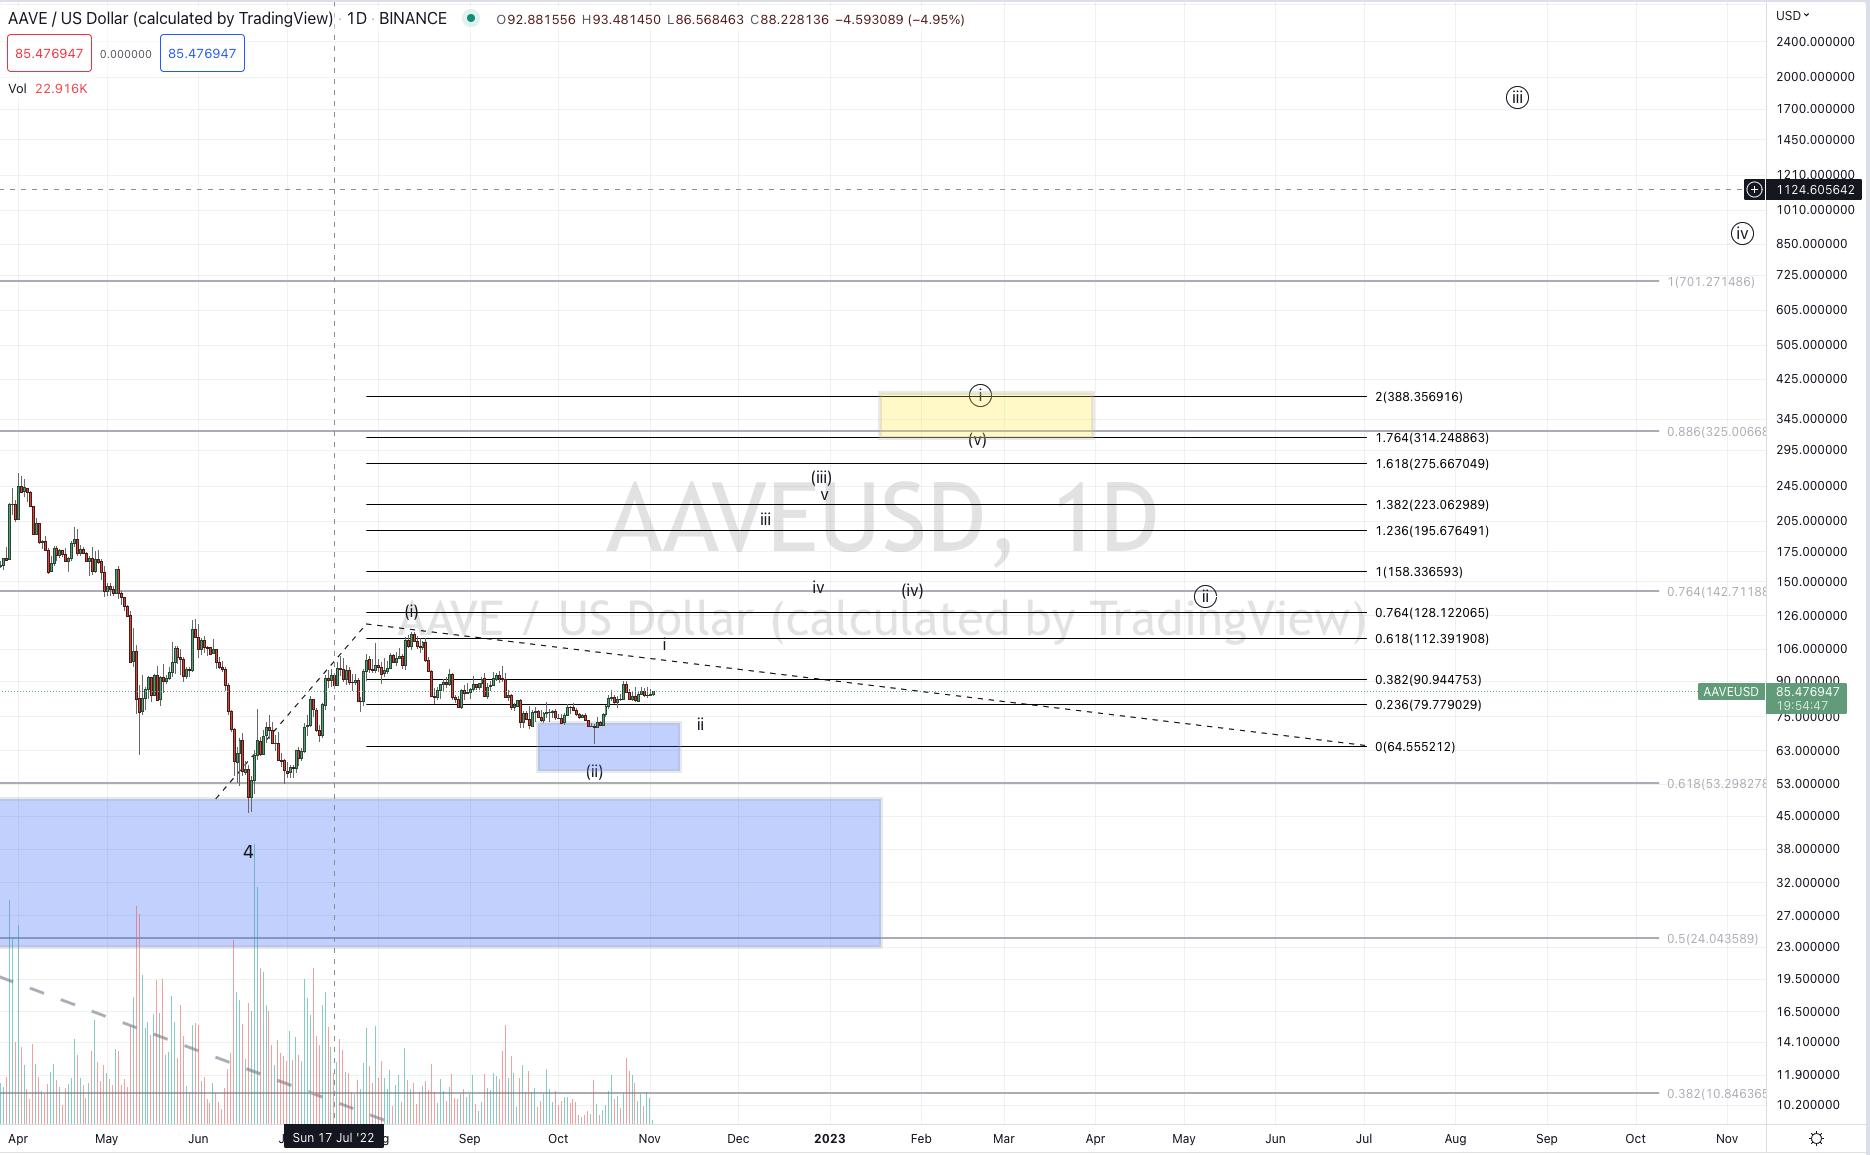
Finally, if the second wave of the third holds, the market is not going to give us any better confidence in success. Again, confidence is not certainty. I estimate that once AAVE tops at $94-96, we will want AAVE to hold $71 or wave ii.
The stop on this trade is the recent low at $65. Since we are taking this trade with a $2200 target, you can risk $6 for $2190 or so of potential profit. Of course, we can’t say that AAVE will drop back all the way to $71. That is why we scale into trades and we don’t position too large until close to the stop.
Note that there is likely to be another degree wave one (circle-i), which will be in the $300–400 region before circle-ii retraces much of circled i. If confirmed, we may make some adjustments to our positions to capture this volatility. Though, at times, third waves can extend through a degree. This is very common for crypto.
Conclusion
In conclusion, while we wait for Bitcoin to make up its mind, we have found that many altcoins seem about to enter a new bull market. AAVE is one of those altcoins, provided its June low holds. Further, the current structure, which formed during the $65 low, has given us a low-risk entry. This setup, should it work, offers immense reward potential. All one must do is enter smartly, ideally scaling into the stop region, and manage the risk if $65 fails to hold.
Be the first to comment