

jroballo
Goldman Sachs Physical Gold ETF (BATS:AAAU) and SPDR Gold Trust ETF (NYSEARCA:GLD) are exchange-traded funds (ETF) that track the spot gold price (CUR). Gold is considered a safe-haven asset against inflation and market volatility. ETFs are used to diversify investment portfolios by providing exposure to the gold market.
AAAU and GLD are good options for investment in 2023, due to diversification, inflation protection, liquidity, convenience, and cost-effectiveness. Gold is a non-correlated asset because it is not directly linked to any financial instrument. Adding a non-correlated asset to a portfolio reduces risk and increases diversification. On the other hand, the Federal Reserve is likely to raise interest rates further in 2023 to combat inflation, but inflation is likely to persist for the foreseeable future. Gold is viewed as a hedge against inflation, since the value of gold increases with the cost of living. Therefore, AAAU and GLD are viewed as potential investment instruments in an inflationary environment.
This article provides a technical assessment of AAAU and GLD in light of the appearance of a bullish price structure in the gold market. Based on the inverted head and shoulder pattern and bull flags, both ETFs are expressing bullish price structures. Currently, the price has reached the limit of the bull flag and is correcting lower. A retracement to the support level in AAAU and GLD appears to be an excellent buying opportunity for long-term investors in the gold market.
ETF Performance
Typically, GLD and AAAU ETFs provide similar exposure to the gold market; however, there is a slight difference that makes one ETF a better choice for investors than the other.
The total trading volume for gold ETFs has increased by 18%, from $1.43 billion in December 2022 to $1.69 billion in January 2023 GLD has a 30-day average daily trading volume of 6.119 million and an Assets Under Management (AUM) of $55.05 billion. While AAAU’s 30-day average daily trading volume and AUM are only 0.89 million and 601.55 million, respectively. The total AUM has an impact on the performance and liquidity of ETFs.
The total AUM for GLD in August 2020 was $84.24 billion, while AUM dropped by 42% from the peak in August 2020 to $48.81 billion in November 2022. GLD’s AUM is currently rising continuously from the lows of $48.81 billion. On the other hand, AUM for AAAU is much lower than for GLD, but the data shows a significant rising trend. AAAU’s AUM is steadily increasing and currently stands at 601.55 million. The continuous rise in AAAU AUM demonstrates the demand for AAAU.
A high level of AUM for GLD is a positive indicator and suggests that the ETF is popular and widely held by investors. The expense ratio of GLD is 0.40%, while the expense ratio of AAAU is only 0.18%. AAAU’s lower expense ratio makes it an appealing option for investors looking for a low-fee investment.
Bullish Prices Structures In AAAU and GLD
The monthly chart below presents an extremely bullish outlook for GLD. The price is supported by the inverted head and shoulders pattern, which serves as the foundation for future price increases. Between the consolidation in July 2013 and May 2019, the inverted head and shoulders were developed. The six-year consolidation ended in June 2019 when the price closed above the neckline at $130. In August 2020, the price reached a high of $194.45 after breaking through the $130 resistance. The inverted head and shoulders pattern is a bullish reversal pattern and indicates an upward change in the GLD price. Since the pattern was broken at $130 in June 2019, the GLD has maintained a strong uptrend.
The price of GLD increased by 1,658.14% after the breakout, from August 2018’s low of $11.06 to August 2020’s high of $194.45, as depicted in the chart below. This price increase of 1,658.14% marked the bull flag on the chart. The bull flag is a bullish price pattern that indicates a pause in an uptrend and is used to identify possible buy signals. The chart depicts a bull flag in which the 1658.10% price increase represents the flagpole and the consolidation from the peak of $194.45 in August 2020 to the current price represents the flag. Investors and traders use the appearance of a bull flag as an opportunity to invest in the market. Currently, the bull flag on the price chart for GLD indicates that the boundary of the bull flag is $182, so a breakout above this level will be a strong buy signal.
GLD Monthly Chart (StockCharts.com)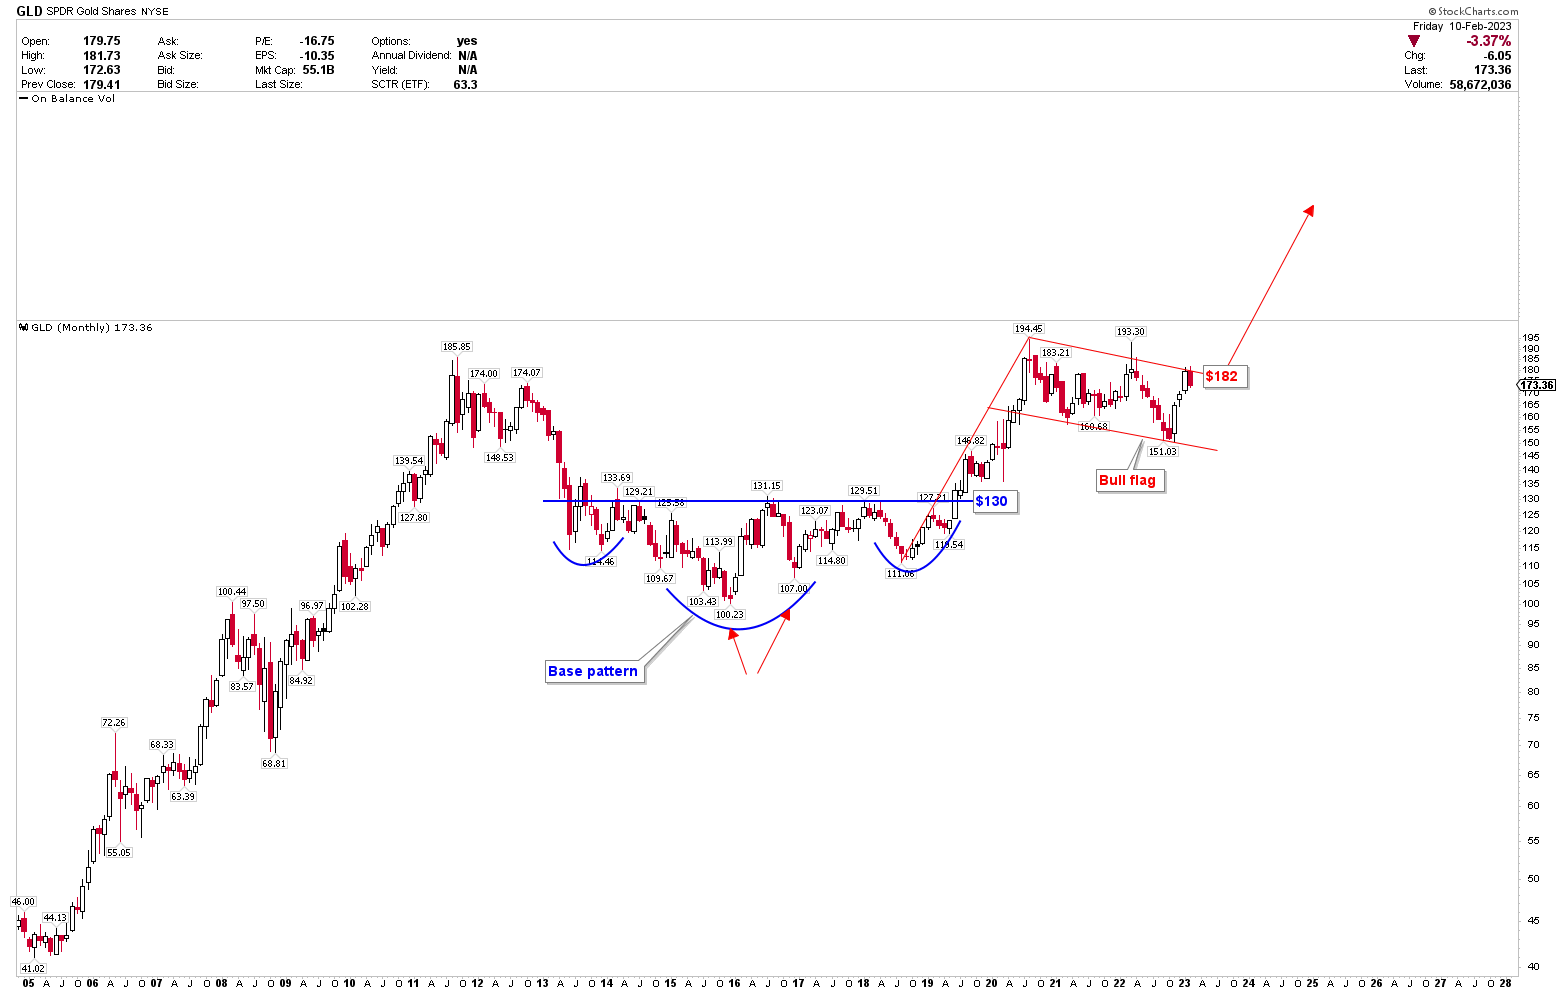
Since GLD and AAAU both track the spot price of gold, they exhibit identical bullish patterns. Similar to the price action of GLD, the bullish price pattern for AAAU is observed on the weekly chart below. The bull flag observed in the monthly chart for GLD can be expanded on the weekly chart for AAAU. The price shows consolidation in the region between $16 and $20. The initial contact with the lower trend line in March 2021 produced a double bottom, followed by a 23.25% price increase. The price has recently reached a triple bottom in October 2022 in the $16 region, and it is rising. In addition to the recent price increase, an inverted head and shoulder pattern with a neckline at $17.75 appeared on the weekly chart. The neckline was breached in December 2022, and the price is currently approaching the upper trend line in the $19 region.
The recent price correction from the upper channel line is extremely constructive and signals a strong buying opportunity. If the price of AAAU continues to decline, the region around $17.75 will be a strong area for long-term investors to add positions to portfolios. Since AAAU and GLD have identical price behavior, the price of GLD would be around $168 when AAAU emerges a buy signal at $17.75. The price is also observed to be consolidating in a wide range, and only a breakout from $19.50 will initiate the next strong upward move. However, investors will likely enter the AAAU market in the region of $17.75.
AAAU Weekly Chart (StockCharts.com)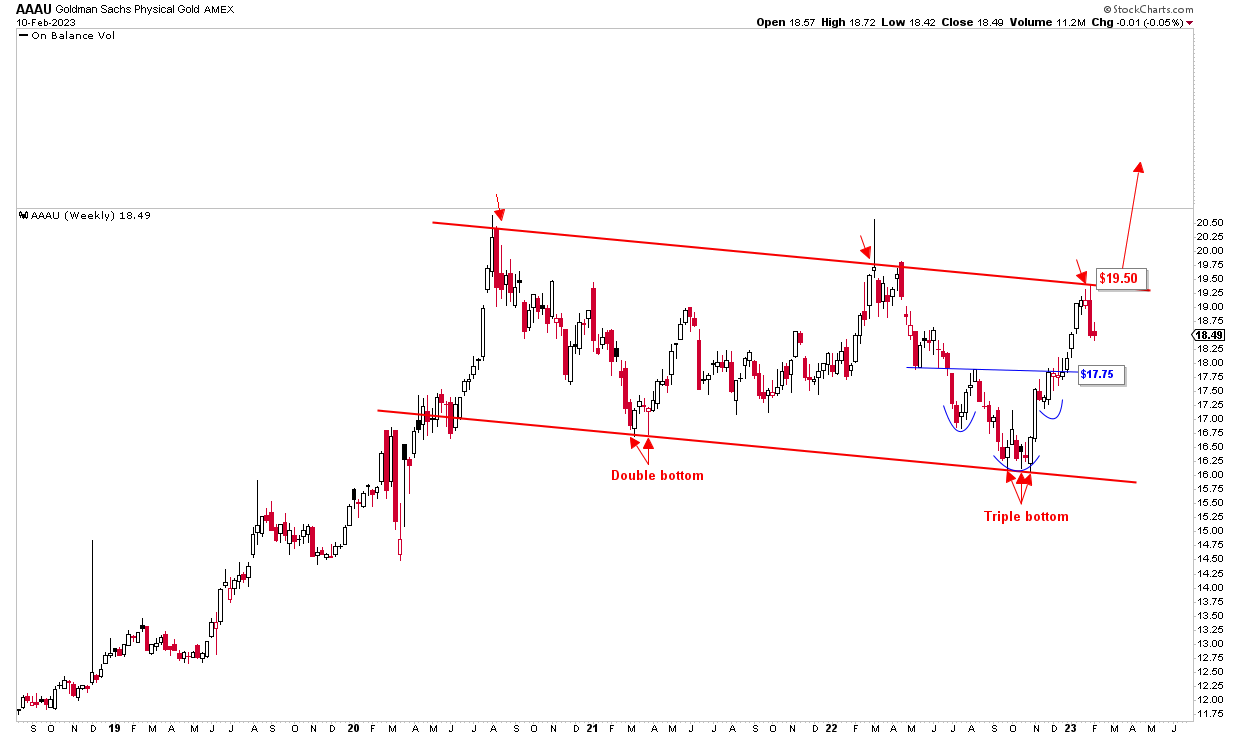
The above discussion clearly demonstrates that the gold price outlook is strongly bullish based on the fundamental and technical analysis of the gold market discussed previously. As both GLD and AAAU track the spot price of gold, they exhibit similar price behavior. Long-term investors view the recent decline in gold’s price as an excellent buying opportunity, and GLD and AAAU are excellent investment vehicles for investing in the gold market.
Market Risk
Market volatility is escalating as a result of the inflationary environment and increases the risk in the overall financial market. The buying activities of central banks increase the gold market’s demand, whereas high-interest rates increase the stock market’s uncertainty. On the other hand, price increases are not guaranteed by bull flags and inverted head and shoulder patterns. A price decline below $151.03 in GLD would negate the bullish outlook. Likewise, a break below $16 in AAAU would negate the recent bullish structure and a further decline in prices. A break above $19.50 in AAAU would decrease the risk in the gold market and indicates much higher prices.
Conclusion
The gold market is retracing from the significant resistance zone. The correction in the gold market is very constructive at the moment and offers a good investment option in AAAU and GLD.
An investment in AAAU looks more attractive than GLD due to the lower expense ratio. Furthermore, the AAAU exhibits a consistent upward trend in AUM, which demonstrates the buying interest and demand for the ETF. Due to the appearance of an inverted head-and-shoulders pattern and a bull flag, AAAU and GLD are generating strong market buying interest during this correction.
Based on the discussion of technical data, the inverted head and shoulder pattern in GLD and triple bottom pattern in AAAU increase the likelihood that the gold market will break out of the bull flag to run higher. A breakout above $19.50 on the AAAU and $182 on the GLD confirms the bull flag and signals a significant price increase. Investors may benefit by accumulating long positions on the gold market by entering at $17.75 and $168 in AAAU and GLD, respectively.
Be the first to comment