


Pgiam/iStock via Getty Images
Investment Thesis
You just read it in the bullets above, if your advanced age puts you there. If not, it is NEVER too soon to think about it, because ultimately you will have concern and the escaped time can never be recovered.
So here is a today-practical first-step example of what CAN be done: Swap a Taiwan Semiconductor (TSM) stock holding into a Power Integrations, Inc. (POWI) semiconductor stock holding.
Reason: That’s what major investing “Institutions” are doing and the Market-Making community of block-trade “facilitator” MM firms and necessary Wall-street pro hedging firms, by their own self-protective actions tell how they think your alternative choices look.
First, what are TSM and POWI? Then, what are the market pros betting that those stocks’ prices are likely to do in time periods that can reasonably be forecast?
Descriptions of the Investment Alternatives
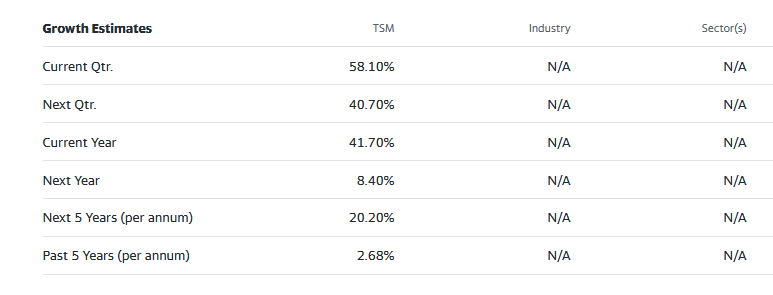
“Taiwan Semiconductor Manufacturing Company Limited manufactures, packages, tests, and sells integrated circuits and other semiconductor devices in Taiwan, China, Europe, the Middle East, Africa, Japan, the United States, and internationally. It provides complementary metal oxide silicon wafer fabrication processes to manufacture logic, mixed-signal, radio frequency, and embedded memory semiconductors. The company also offers customer support, account management, and engineering services, as well as manufactures masks. Its products are used in mobile devices, high performance computing, automotive electronics, and internet of things markets. The company was incorporated in 1987 and is headquartered in Hsinchu City, Taiwan.”
Source: Yahoo Finance
Yahoo Finance
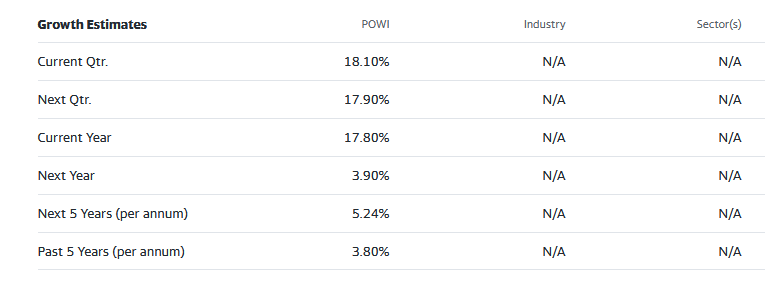
“Power Integrations, Inc. designs, develops, manufactures, and markets analog and mixed-signal integrated circuits (ICs), and other electronic components and circuitry used in high-voltage power conversion worldwide. The company provides a range of alternating current to direct current power conversion products that address power supply ranging from less than one watt of output to approximately 500 watts of output. The company sells its products to original equipment manufacturers and merchant power supply manufacturers through direct sales force, as well as a network of independent sales representatives and distributors. Power Integrations, Inc. was incorporated in 1988 and is headquartered in San Jose, California.”
Source: Yahoo Finance
Yahoo Finance
These growth estimates have been made by and are collected from Wall Street analysts to suggest what conventional methodology currently produces. The typical variations across forecast horizons of different time periods illustrate the difficulty of making value comparisons when the forecast horizon is not clearly defined.
Risk and Reward Balances Among Semiconductor Providers
Let’s consider selections from at an “Opportunity Set” of comparable companies ranging across areas of Semiconductors. Among the many active participants are two in which we have an interest, TSM and POWI.
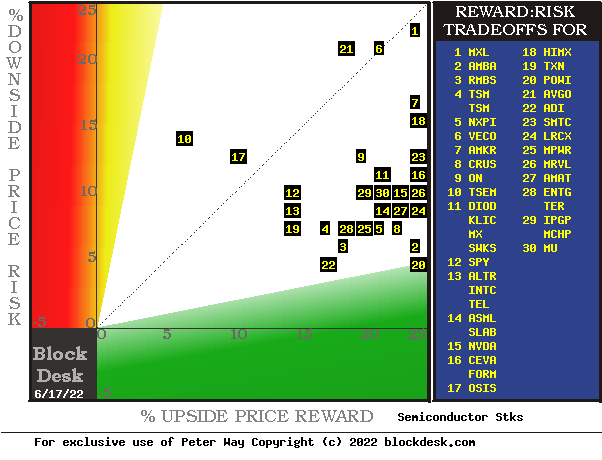
Here in Figure 1 is how the markets currently appraise their Reward ~ Risk trade-offs among competitors, based on behavioral analysis (of what investing systems require to be done, not of emotional investor errors) of actions by Market-Makers [MMs] as they protect their at-risk capital from possible damaging future market-price moves..
Figure 1
blockdesk.com
(used with permission)
The risk dimension is of actual price drawdowns at their most extreme point while being held in previous pursuit of upside rewards similar to the ones currently being seen. They are measured on the red vertical scale.
Both scales are of percent change from zero to 25%. Any stock or ETF whose present risk exposure exceeds its reward prospect will be above the dotted diagonal line. Capital-gain attractive to-buy issues are in the directions down and to the right.
Our principal interest is in TSM at location [4], midway between locations [19 and 22]. Down in the green area of forecast outcomes where five times as much gain as loss lives is POWI at [20]. A “market index” norm of reward~risk tradeoffs is offered by SPY at [12]. Most appealing by this Figure 1 view is POWI.
Comparing competitive features of Semiconductor Stocks
The Figure 1 map provides a good visual comparison of the two most important aspects of every equity investment in the short term. There are other aspects of comparison which this map sometimes does not communicate well, particularly when general market perspectives like those of SPY are involved. Where questions of “how likely’ are present other comparative tables, like Figure 2, may be useful.
Yellow highlighting of the table’s cells emphasize factors important to securities valuations and the security POWI of most promising of near capital gain as ranked in column [R].
Figure 2
blockdesk.com
(used with permission)
Why do all this math?
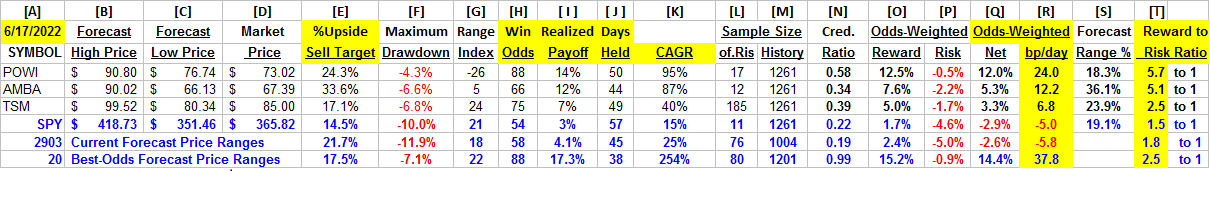
Figure 2’s purpose is to attempt universally comparable answers, stock by stock, of a) How BIG the prospective price gain payoff may be, b) how LIKELY the payoff will be a profitable experience, c) how SOON it may happen, and d) what price drawdown RISK may be encountered during its holding period.
Readers familiar with our analysis methods after quick examination of Figure 2 may wish to skip to the next section viewing price range forecast trends for TSM and POWI.
Column headers for Figure 2 define investment-choice preference elements for each row stock whose symbol appears at the left in column [A]. The elements are derived or calculated separately for each stock, based on the specifics of its situation and current-day MM price-range forecasts. Data in red numerals are negative, usually undesirable to “long” holding positions. Table cells with yellow fills are of data for the stocks of principal interest and of all issues at the ranking column, [R].
The price-range forecast limits of columns [B] and [C] get defined by MM hedging actions to protect firm capital required to be put at risk of price changes from volume trade orders placed by big-$ “institutional” clients.
[E] measures potential upside risks for MM short positions created to fill such orders, and reward potentials for the buy-side positions so created. Prior forecasts like the present provide a history of relevant price draw-down risks for buyers. The most severe ones actually encountered are in [F], during holding periods in effort to reach [E] gains. Those are where buyers are emotionally most likely to accept losses.
The Range Index [G] tells where today’s price lies relative to the MM community’s forecast of upper and lower limits of coming prices. Its numeric is the percentage proportion of the full low to high forecast seen below the current market price.
[H] tells what proportion of the [L] sample of prior like-balance forecasts have earned gains by either having price reach its [B] target or be above its [D] entry cost at the end of a 3-month max-patience holding period limit. [ I ] gives the net gains-losses of those [L] experiences.
What makes POWI most attractive in the group at this point in time is its ability to produce earnings most consistently at its present operating balance between share price risk and reward, the Range Index [G]. Credibility of the [E] upside prospect as evidenced in the [I] payoff is shown in [N]. For POWI it is .56
Further Reward~Risk tradeoffs involve using the [H] odds for gains with the 100 – H loss odds as weights for N-conditioned [E] and for [F], for a combined-return score [Q]. The typical position holding period [J] on [Q] provides a figure of merit [fom] ranking measure [R] useful in portfolio position preferencing. Figure 2 is row-ranked on [R] among alternative candidate securities, with POWI in top rank.
Along with the candidate-specific stocks these selection considerations are provided for the averages of some 2900 stocks for which MM price-range forecasts are available today, and 20 of the best-ranked (by fom) of those forecasts, as well as the forecast for S&P 500 Index ETF (SPY) as an equity-market proxy.
Current-market index SPY is not competitive as an investment alternative. With its Range Index of 24 the indication is 3/4ths of its forecast range is to the upside, but little more than half of previous SPY forecasts at this range index produced profitable outcomes, with enough losers to put its average in negative result.
As shown in column [T] of figure 2, those levels vary significantly between stocks. What matters is the net gain between investment gains and losses actually achieved following the forecasts, shown in column [I]. The Win Odds of [H] tells what proportion of the Sample RIs of each stock were profitable. Odds below 80% often have proven to lack reliability.
Recent Forecast Trends of Primary Subjects
Figure 3
blockdesk.com
(used with permission)
Figure 4
blockdesk.com
(used with permission)
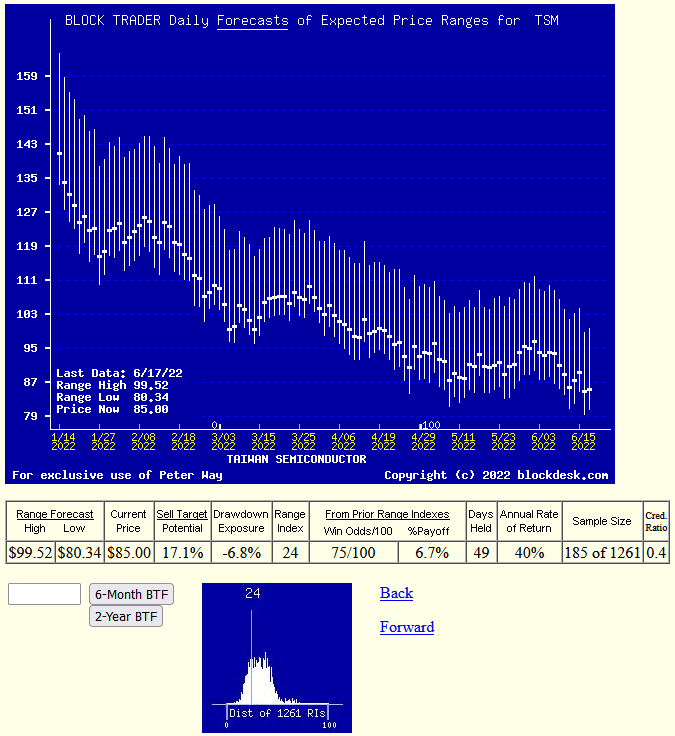
Many investors confuse any time-repeating picture of stock prices with typical “technical analysis charts” of past stock price history. These are quite different in their content. Instead, here Figures 3 and 4’s vertical lines are a daily-updated visual record of price range forecast limits expected in the coming few weeks and months. The heavy dot in each vertical is the stock’s closing price on the day the forecast was made.
That market price point makes an explicit definition of the price reward and risk exposure expectations which were held by market participants at the time, with a visual display of their vertical balance between risk and reward.
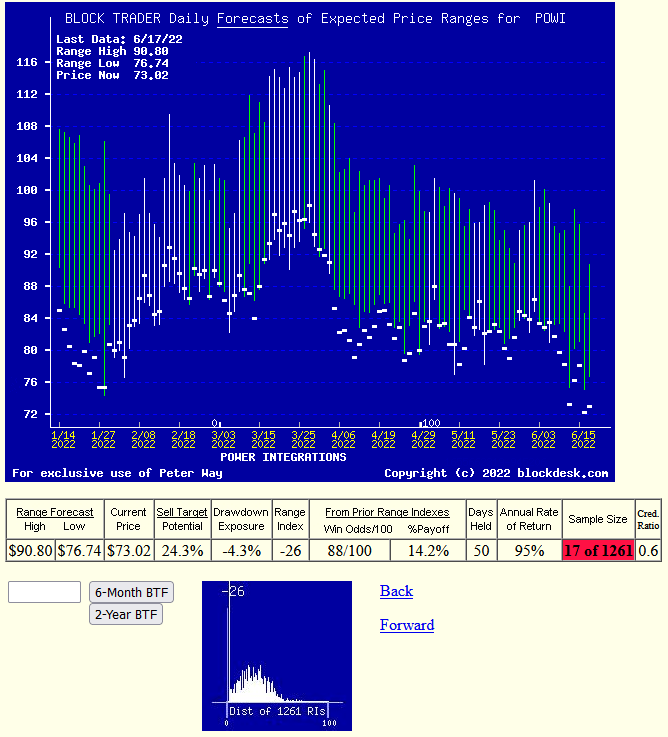
The measure of that balance is the Range Index (RI). Here in POWI, the current market price of $73 is below the lowest forecast price (of $76) regarded by hedging as reasonable. That produces a negative Range Index.
With today’s RI there is 24% upside price change in prospect and no downside. Of the prior 53 forecasts like today’s RI, 51 have been profitable. The market’s actions of prior forecasts became accomplishments of +14% gains in 50 market days. So history’s advantage could be repeated five times a 252 market-day year, which compounds into a CAGR of +95% which compares to less than half as much from TSM.
Also please note the smaller low pictures in Figures 3 and 4. They show the past 5 year distribution of Range Indexes with the current level visually marked. For POWI nearly all forecasts have been of higher prices and Range Indexes.
Conclusion
Based on direct comparisons with TSM and other Semiconductor producers, there are several clear reasons to prefer a capital-gain seeking buy in Power Integrations, Inc.
Be the first to comment