

Just_Super
By Jeremy Schwartz
The S&P family of growth and value style indexes conducted its annual rebalance in December, and there were some surprising twists and perhaps unexpected turnover this cycle.
Notably, value indexes outperformed growth indexes across the board in 2022, as fears about elevated valuations in technology stocks dominated markets.
Energy stocks were the lone, large, bright spot, but defensive sectors like Utilities, Consumer Staples and Health Care also outperformed the broader S&P 500.
2022 S&P 500 Sector Total Returns
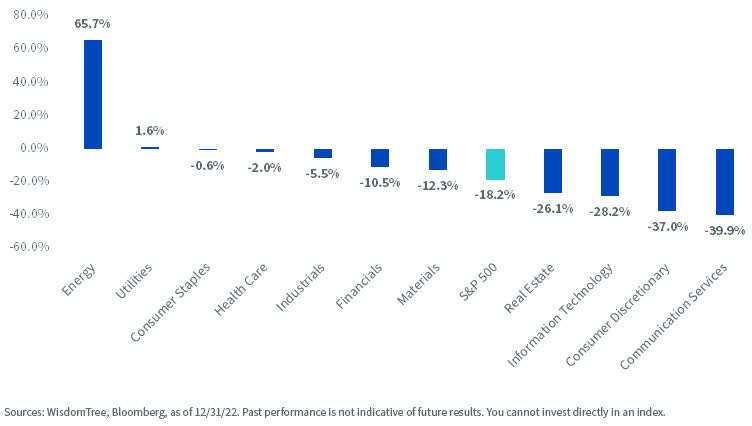
Despite Energy stocks remaining among the lowest sector valuations, the S&P value indexes dramatically reduced their weight while the growth indexes added more Energy exposure.
Below we will review Index composition changes across the large-cap (S&P 500), mid-cap (S&P MidCap 400) and small-cap (S&P SmallCap 600) benchmarks in the S&P family and explain what aspects of their style methodology caused these surprising shifts.
Within large-cap and the S&P 500 style benchmarks:
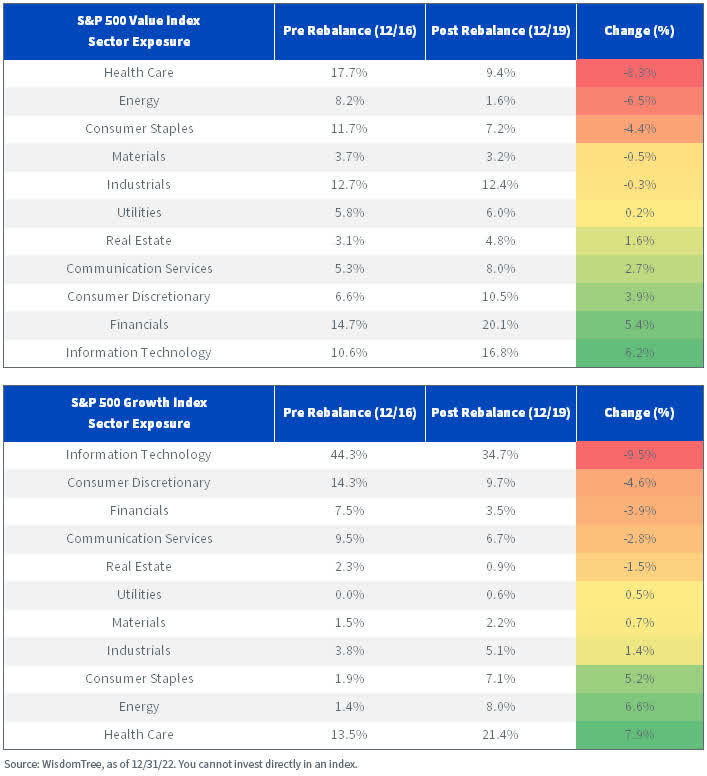
- In the S&P 500 Value Index, the greatest reductions in weight occurred in Health Care (-8.3%), Energy (-6.5%) and Consumer Staples (-4.4%). Those were three of the top four performing sectors in 2022.
- Meanwhile, three of the four sectors with the worst performance in 2022 (Information, Technology, Communication Services and Consumer Discretionary) received the largest increases in exposure.
- These same shifts were mirrored in the S&P 500 Growth Index, as the biggest increases in exposure included Health Care, Energy and Consumer Staples, while Technology sectors saw the greatest reduction in weight.
Notably, these shifts in Technology becoming more heavily weighted in value benchmarks, and Energy becoming more dominant in growth was not based on actual valuations.
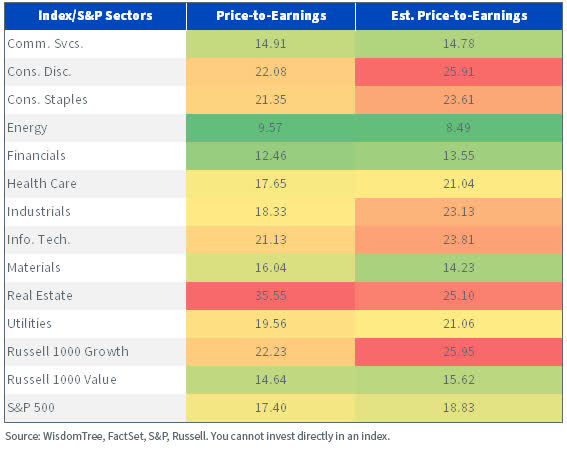
Energy, despite being the cheapest sector in the market by price-to-earnings (P/E) multiple, became the lowest-weighted sector in the S&P 500 Value Index.
The Technology, Consumer Discretionary and Communications Services sectors had the highest P/E ratios despite receiving the largest increase in weight in the value benchmark.
Fundamentals – as of 12/31/22
What explains the shifting sector weights, then? The below grid lists the factors in the S&P style family. Price momentum is one of the key growth factors utilized; clearly, that factor was an outlier in driving turnover.
The intersection of the S&P growth and value factor scores caused the Energy stocks to become weighted more heavily in growth, overcoming their low valuations.
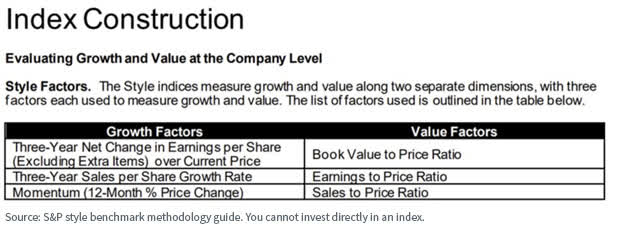
Technology, although priced at high multiples, had such negative momentum that its growth scores plummeted enough to become more value-heavy in S&P’s scoring system.
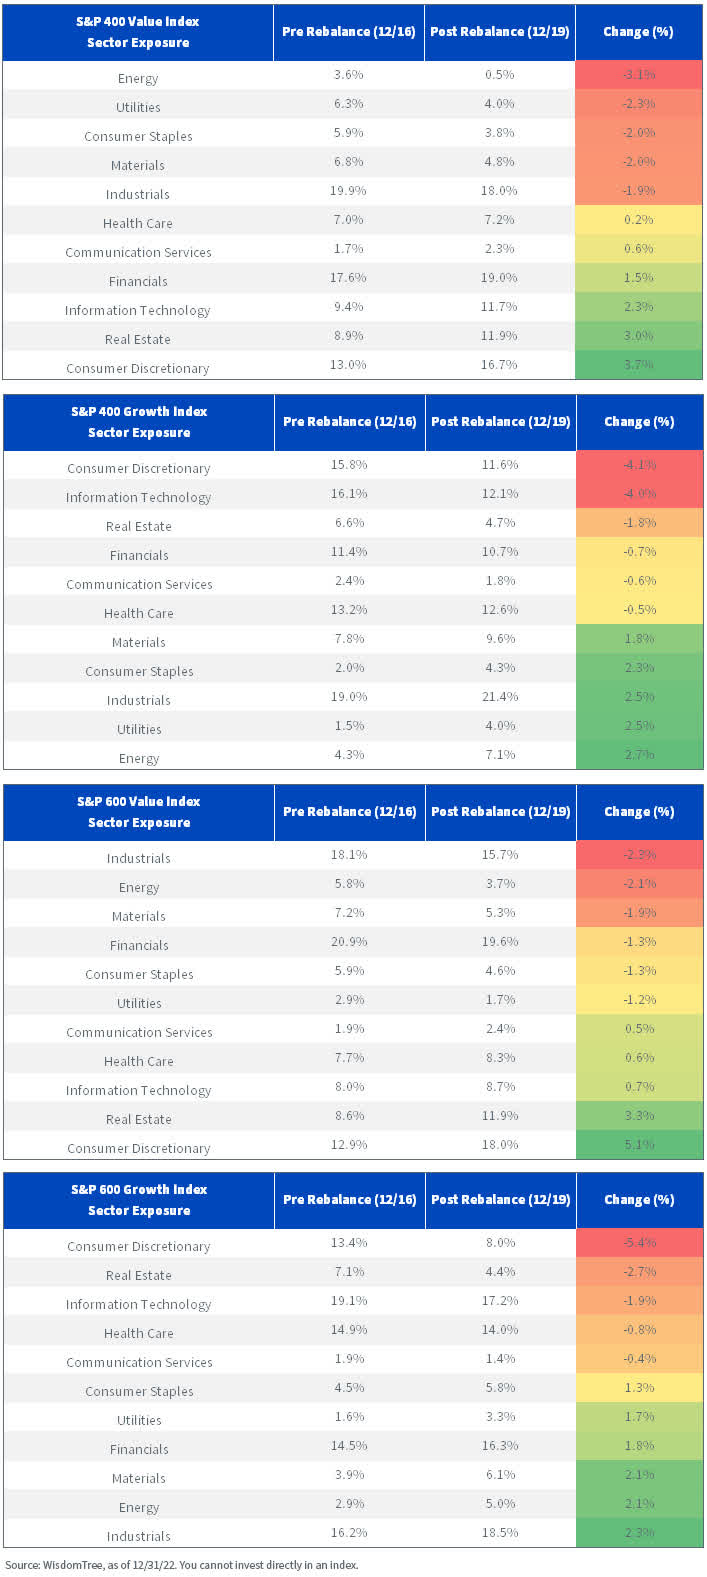
These changes were not limited to large caps. The tables below show similar shifts occurring in the mid- and small caps.
We see surprising shifts, like Utilities becoming more heavily weighted in the growth benchmarks. Energy and Consumer Staples moving from value to growth also occurred here in mid- and small caps.
WisdomTree also rebalanced its equity Index family in December, and we can share more specifics on each rebalance.
Because of the turnover discussed above, the S&P 500 Value Index only has a single P/E point lower valuation than the S&P 500 (16.4x vs. 17.4x).
The WisdomTree U.S. High Dividend Fund (DHS) has a P/E ratio of 10.8x, more than six points lower than the S&P 500.
The WisdomTree U.S. LargeCap Dividend Fund (DLN) has a P/E ratio about two points lower than the S&P 500 Value Index (14.5 vs. 16.4) and three points lower than the S&P 500.
Again, these same features are mirrored in mid- and small caps, which we believe have attractive valuations overall.
This was quite the interesting rebalance season. It serves as a useful reminder that methodologies matter, and looking under the hood to understand portfolio composition is important since portfolios are not stagnant.
|
Jeremy Schwartz, CFA, Global Chief Investment Officer |

Important Risks Related to this ArticleThere are risks associated with investing, including the possible loss of principal. Funds focusing their investments on certain sectors increase their vulnerability to any single economic or regulatory development. This may result in greater share price volatility. Dividends are not guaranteed, and a company currently paying dividends may cease paying dividends at any time. Please read the Fund’s prospectus for specific details regarding the Fund’s risk profile. U.S. investors only: Click here to obtain a WisdomTree ETF prospectus which contains investment objectives, risks, charges, expenses, and other information; read and consider carefully before investing. There are risks involved with investing, including possible loss of principal. Foreign investing involves currency, political and economic risk. Funds focusing on a single country, sector and/or funds that emphasize investments in smaller companies may experience greater price volatility. Investments in emerging markets, currency, fixed income and alternative investments include additional risks. Please see prospectus for discussion of risks. Past performance is not indicative of future results. This material contains the opinions of the author, which are subject to change, and should not to be considered or interpreted as a recommendation to participate in any particular trading strategy, or deemed to be an offer or sale of any investment product and it should not be relied on as such. There is no guarantee that any strategies discussed will work under all market conditions. This material represents an assessment of the market environment at a specific time and is not intended to be a forecast of future events or a guarantee of future results. This material should not be relied upon as research or investment advice regarding any security in particular. The user of this information assumes the entire risk of any use made of the information provided herein. Neither WisdomTree nor its affiliates, nor Foreside Fund Services, LLC, or its affiliates provide tax or legal advice. Investors seeking tax or legal advice should consult their tax or legal advisor. Unless expressly stated otherwise the opinions, interpretations or findings expressed herein do not necessarily represent the views of WisdomTree or any of its affiliates. The MSCI information may only be used for your internal use, may not be reproduced or re-disseminated in any form and may not be used as a basis for or component of any financial instruments or products or indexes. None of the MSCI information is intended to constitute investment advice or a recommendation to make (or refrain from making) any kind of investment decision and may not be relied on as such. Historical data and analysis should not be taken as an indication or guarantee of any future performance analysis, forecast or prediction. The MSCI information is provided on an “as is” basis and the user of this information assumes the entire risk of any use made of this information. MSCI, each of its affiliates and each entity involved in compiling, computing or creating any MSCI information (collectively, the “MSCI Parties”) expressly disclaims all warranties. With respect to this information, in no event shall any MSCI Party have any liability for any direct, indirect, special, incidental, punitive, consequential (including loss profits) or any other damages (www.msci.com) Jonathan Steinberg, Jeremy Schwartz, Rick Harper, Christopher Gannatti, Bradley Krom, Kevin Flanagan, Brendan Loftus, Joseph Tenaglia, Jeff Weniger, Matt Wagner, Alejandro Saltiel, Ryan Krystopowicz, Brian Manby, and Scott Welch are registered representatives of Foreside Fund Services, LLC. WisdomTree Funds are distributed by Foreside Fund Services, LLC, in the U.S. only. You cannot invest directly in an index. |
Editor’s Note: The summary bullets for this article were chosen by Seeking Alpha editors.
Be the first to comment