

Bet_Noire
We have been bearish on stocks, bonds, and real estate for two years, but see a glimmer of hope that a meaningful economic recession and sharp earnings decline are not forgone conclusions. Whether or not inflation remains tenaciously high or reverts toward 2% remains to be seen. Our fear is that inflation will remain intractable due to energy scarcity; however, a Republican wave in the midterm elections could lead to increased domestic energy production, alleviating one of the tenacious inflationary forces and leading inflation lower faster. Additionally, the Russian invasion of Ukraine could be resolved in the coming months and China may choose not to invade Taiwan. In the coming months and quarters, these and other problems could be resolved, improving economic prospects for the U.S. economy in 2023 and leading to a soft landing.
consumer spending (BEA associates)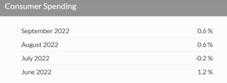
The S&P 500 earnings decline year-to-date has not nearly been as severe as the decline in stock prices. Despite the Federal Reserve’s late and historic tightening, U.S. consumer spending has only moderated slightly, and the services portion of the U.S. economy continues to be steady. With 70% of gross domestic product being consumer spending, combined with decent consumer and corporate balance sheets, a soft landing is possible despite Fed Funds still rising to 5% around March 2023. If inflationary indicators don’t begin to moderate and revert as 2023 advances, a further leg down on the order of 20-30%, which is consistent with historic post bubble market declines, could ensue. Furthermore, valuation measures including Buffett’s “so called favorite indicator” and Robert Shiller’s CAPE ratio both suggest that further market downside is a real possibility.
The chart below of the Fed Model shows a Risk Premium of 1.86%, indicating the market is no longer inexpensive. The trend in earnings is now turning down, which makes the market valuation case tremulous. How well the stock market weathers the anticipated Fed Fund tightening’s of 75 basis points on November 2nd, 50 basis points in December and another 25 basis points as we enter 2023 will be a test of investor nerves.
Fed Risk Premium Model (Portfolio123.com)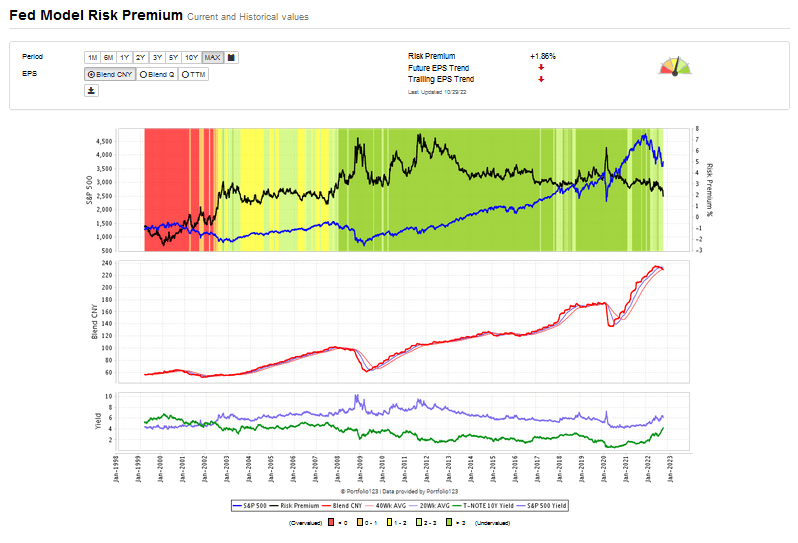
Where earnings will trend and how high interest rates will move will ultimately decide capital markets’ prospects. Given this cycle’s unanticipated inflation and the Federal Reserve’s delayed response to reverse inflation, there will be a quarter or two delay between monetary policy and economic impact. Consequently, it is especially difficult to forecast either interest rates, economic strength, or future earnings with any meaningful confidence.
Buffett Indicator (current market valuation)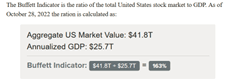
To estimate the market’s downside risk, we use “Buffett’s so-called favorite Indicator” which compares the valuation of the Wilshire 5000 to the U.S. GDP. The Buffett Indicator measures the real economy to the market’s paper valuation. The Federal Reserve’s historic levels of financial accommodation, since the Great Financial Crisis of 2008-2009, has led to bubble valuations in equities, bonds, and real estate. With the Federal Reserve now rapidly withdrawing over a decade of near 0% interest rates, equity markets have declined as we have been forecasting for two years. We expect interest rates will be restrictive into 2023 and pressure equity markets until the Federal Reserve sees inflation moderating meaningfully. If inflation does not moderate, 20-30% more downside risk in the equity market is a real possibility. By the Buffett Indicator, shown on the chart below, the stock market is 27% above its long term average.
Prescription For Investment Success:
Philosopher George Santayana famously said, “Those who cannot remember the past are condemned to repeat it.” We believe this to be true in market analysis and look to historic analogues of past bubbles, crashes, and sector rotations to decide our investment strategy.
We believe the market today mirrors the 2000 technology bubble peak until 2008 as well as the 1970s market. Both the 2000-2008 period and 1966-1982 periods were inflationary periods when the government spent heavily on wars and energy prices soared, like today. Our own investment experience — following some dazzling successes in the 1990s — was that once technology stocks peaked, the correction which ensued in technology stocks was nearly a decade long and experienced an 80% peak-to-trough decline. During the 2000-2008 inflationary cycle, energy, cyclicals, value, small cap, emerging markets, and MLPs were sources of out-performance, and we believe these are among the logical areas for investors to allocate.
Below are two charts which support our view that a secular bear market in tech is at hand. The first chart shows three historic bubbles in technology stocks relative to the S&P 500: in 1966, 2000, and 2021. The 1966 peak took about 15 years until the relative strength of tech stocks returned. It took about nine years until tech stocks began outperforming following the 2000 Tech Bubble peak. The current cycle enjoyed a period of abnormally low rates, which benefits long duration assets such as growth stocks and technology stocks. For this reason, we think investors are ill advised to overweight technology and growth stock strategies in today’s environment of inflation and rising interest rates.
tech overvaluation cycle (KCI Research and Bank America Global Research)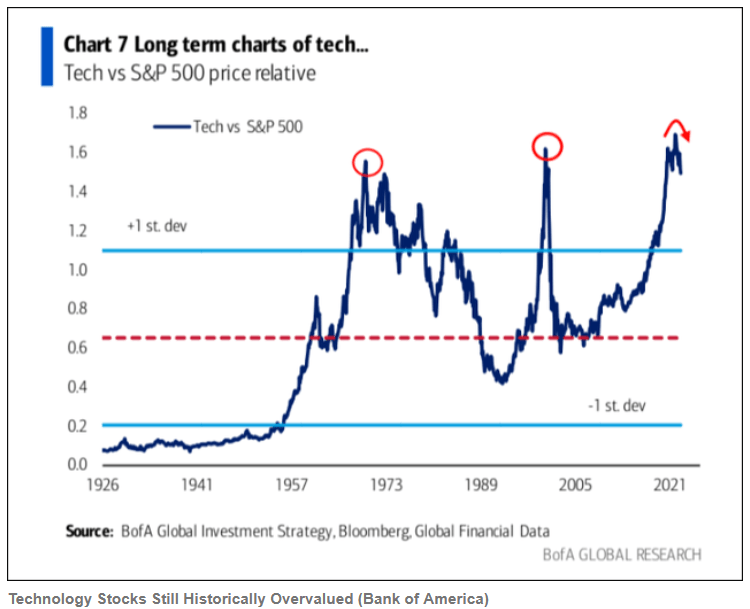
Source: KCI Research and Bank of America Global Research.
Another fascinating chart is from Crescat Capital, which shows FAANG cash flows less share buybacks has now turned negative. Losing momentum and deteriorating financials is a terrible combination. Just ask Netflix and Meta [formerly Facebook] shareholders, down 52.25% and 71.28%, respectively, how they feel this year? The Crescat chart below shows powerfully that the positive feedback loop of robust technology stock cash flows and buybacks has ended. These historic analogues support our view that attractive investment returns will not be found in the FAANG stocks nor the QQQ for years.
FAANG cashflow less stock buyback chart (Crescat Capital research)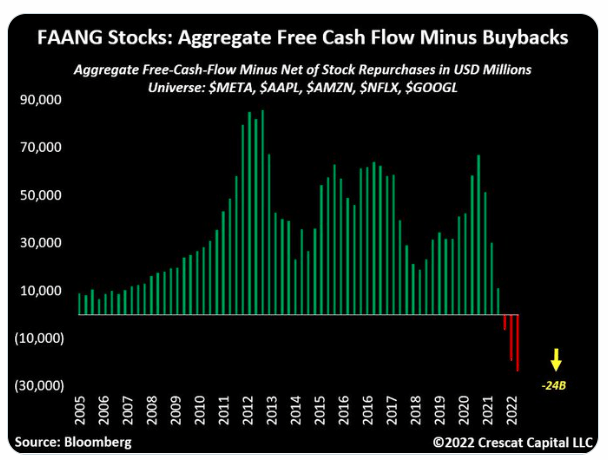
Lastly, the chart below shows how this cycle’s 30.77% decline in the NASDAQ 100 (QQQ) from its November 2021 peak, has considerably more downside work to do when compared to the 2000 bubble period, which declined 83% peak-to-trough.
NASDAQ 100 25 year chart 2 Tech bubbles (Yahoo, IGA research)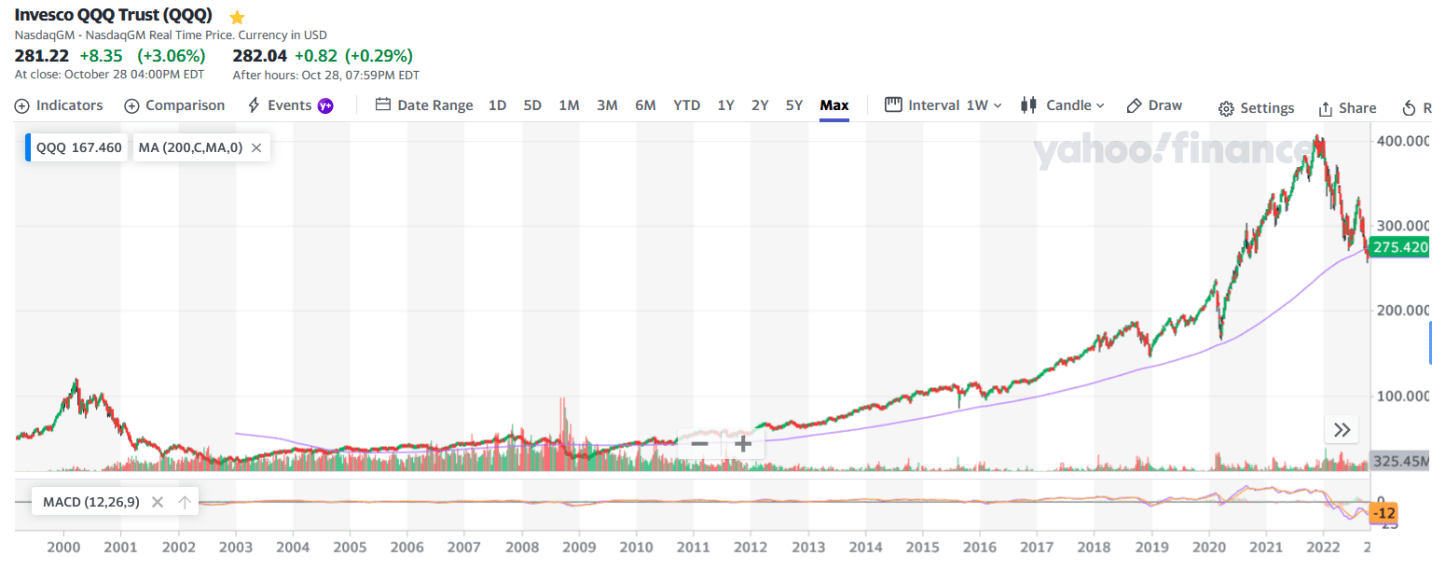
Inflation Cycle Picks:
Due to the rise of inflation and interest rates, the current inflationary cycle is decidedly different then the deflationary cycle which powered stocks and bonds higher for much of the last 40 years.
The best way to capture this investment period is from the following chart, which shows inflationary periods and deflationary periods over the last 140 years by charting the S&P 500 divided by the PPI. The recent drop in this ratio since September 2021 suggests that we are in an inflationary environment, and reducing long-duration assets will lead to outperformance for the next several years.
Inflation and deflation cycles (Longtermtrends.net)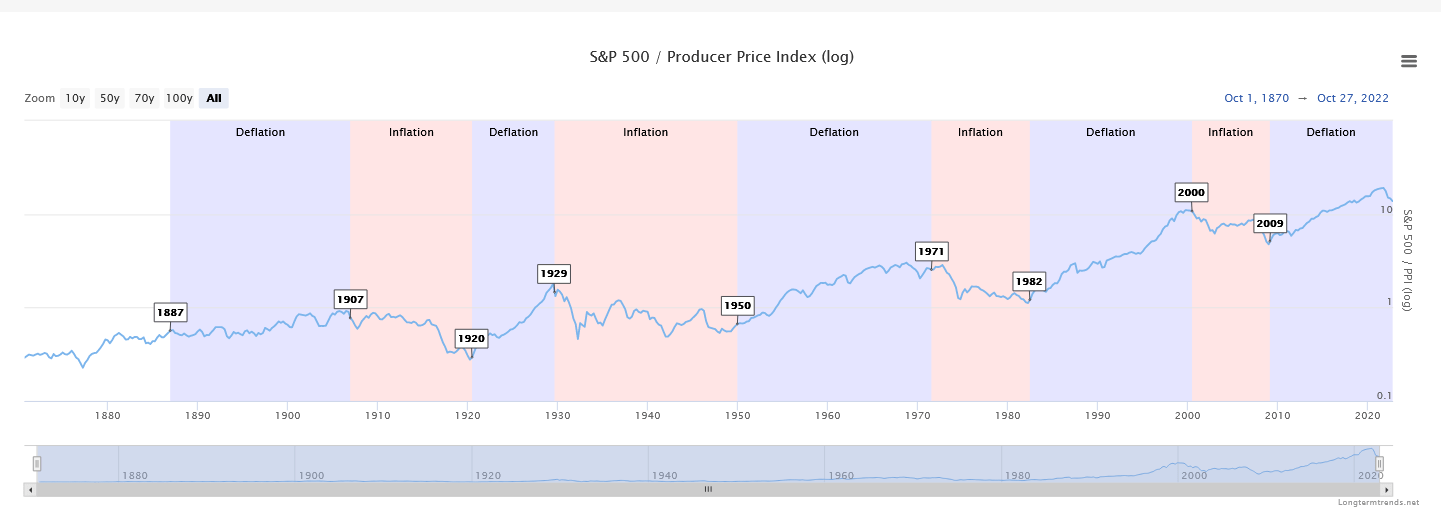
Our perspective is supported by the fact that the 60% equity 40% bond portfolio strategy has now experienced its worst performance in 100 years. This is important, as trillions are invested based on models we believe are backward looking. As poor investment performance is realized in customer account losses, the public will learn the hard way that backward looking financial planning fails to proactively embrace the critical factor input of inflation.
One strategy which benefits from the inflation cycle is the rotation from growth to value. As shown below, growth outperformed since 2009 until 2021 and value underperformed. Furthermore, we believe that the current market environment is analogous to the post 2000 Technology Bubble period, when a near decade long rotation away from technology stocks and into energy paid off handsomely.
value stocks versus growth stocks since 1998 (Yardeni.com)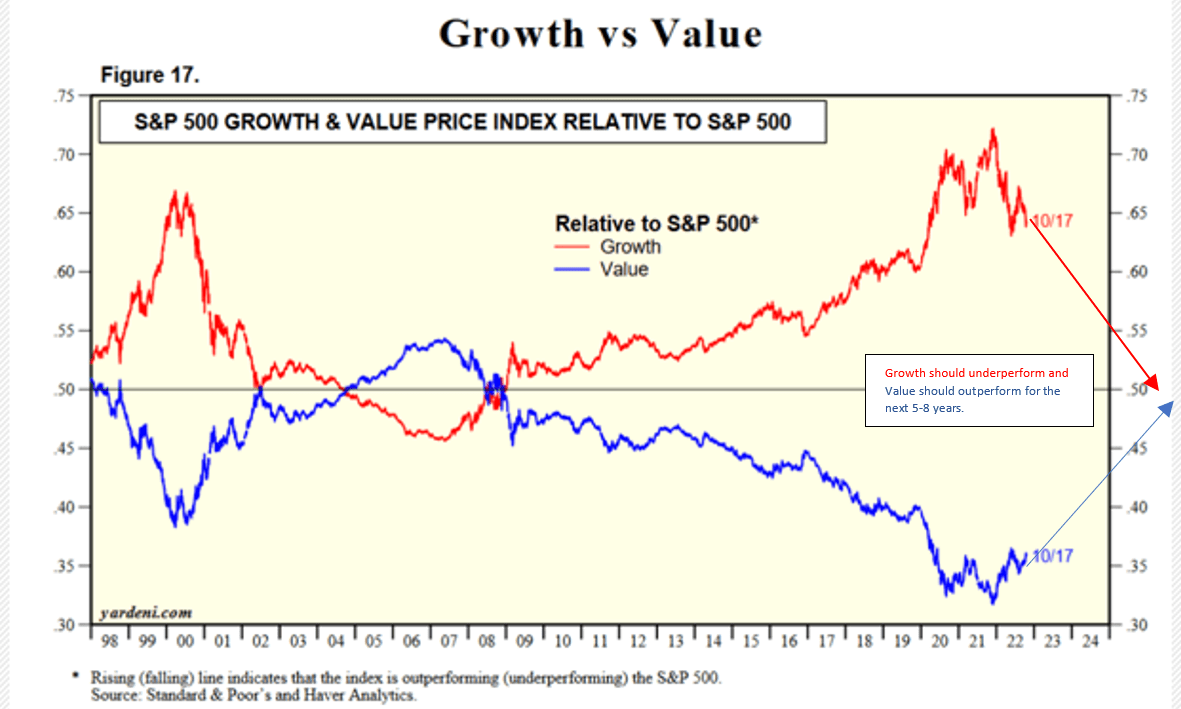
Another sector which has not performed well since 2012 and historically performs well in inflationary periods is gold and precious metals more broadly. Gold historically has been a good inflation hedge. Gold is fungible and a reliable measurable store of value. With weakness in foreign currencies and global financial instability, gold is a logical safe haven investment for individuals as well as central banks. Gold is now seeing a pickup in central bank purchases as is shown in the chart below.
Central Bank purchases of gold (World Gold Council and Bloomberg)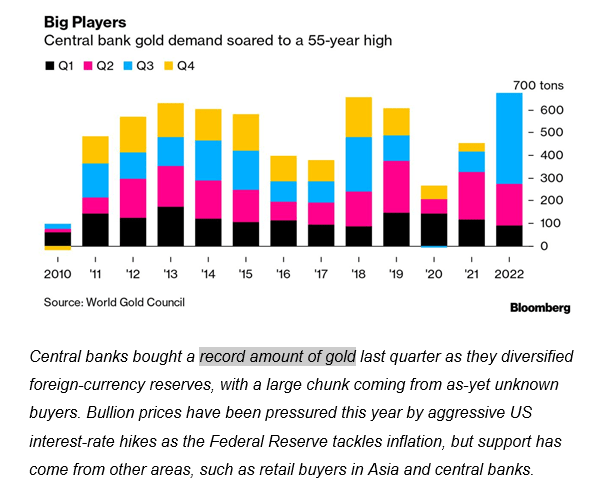
Gold should also benefit from the strong correlation between higher gold prices and a declining dollar. With the Federal Reserve’s Fed Funds tightening cycle nearing its peak, the dollar’s long bull run may reverse in the months and quarters ahead and lift gold and precious metal higher in 2023 as investors move away from traditional stock and bond investments.
The chart below shows the sharp rally in gold from $600/oz. to $1800/oz. from 2006-2012 while the dollar declined about 20%. John Paulson made about $5 billion during this period following his famous bets against mortgages during the financial crisis of 2008-2009. Since 2011 through today, gold has been relatively flat and the dollar has been strong. We now believe there is a good possibility that the dollar is peaking and that the Fed will end its tightening of Fed Funds in the coming months. Additionally, John Paulson has argued that gold should be a strong performer in the years ahead as the massive liquidity added by the Federal Reserve will find its way into gold investments as opposed to rebuilding bank balance sheets which occurred following the Great Financial Crisis. Lastly, between 1976 and 1980 gold soared from $100/oz. to $800/oz. We are adding to gold positions.
We believe that gold could gain meaningful momentum as a fungible safe haven with an excellent reputation as an inflation hedge. With the prospects for appreciation in stocks, bonds and real estate looking weak, the yellow metal, gold stocks and other precious metal investments could see new and persistent interest as portfolios globally seek to increase commodity exposure and precious metals could emerge as a non-correlated momentum play and inflation hedge. Quantitative investing rewards price momentum as a top factor. If the dollar weakens and gold and precious metals outperform, quantitative models could rank precious metals highly due to their momentum, low correlation to stocks and bonds, and as an inflation hedge. This could lead to a multiyear bull market in precious metals.
Gold versus Dollar since 2008 (Macrotrends)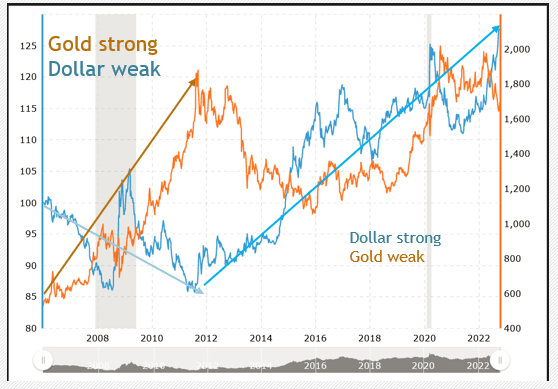
Below are some gold investments IGA clients own:
(GDX) – VanEck Gold Miners ETF (gold mining stocks).
(GDXJ) – VanEck Junior Gold Miners ETF (small gold mining stocks).
(GLD) — SPDR Gold Shares an ETF investing in physical gold.
(GOLD) – Barrick Gold Corporation Quality large capitalization gold miner.
(OTCQB:BLAGF) – Blue Lagoon Resources Inc. Microcap gold miner.
(GLDG) – GoldMining Inc. Microcap gold miner.
(SBSW) – Sibanye Stillwater Limited Midcap gold and platinum miner.
(GGN) – GAMCO Gold and Natural Resources and Income Trust, 10.5% yielding closed end fund employing covered writing strategy.
In 2019-2020, we wrote two letters which provided a clear macroeconomic and portfolio strategy entry point in 2019 and an exit in 2020. During that period from September 2019 to August 2020 the VanEck Vectors Gold Miners ETF rallied 42% and the SPDR Gold Trust ETF) rallied 31%. At that time, gold had established an upward trend and offered safety relative to stocks and bonds which were expensive.
Conclusion:
We are in a precarious period where interest rates are rising, and the economy is slowing. While it is possible that the U.S. economy will power through this ominous economic and geopolitical environment, history suggests an economic recession will likely occur and hurt earnings and the stock market. The market has entered an inflationary cycle; and based on our 2000-2008 investment experience we continue to advise against over-weighting long duration asset such as bonds, growth stocks and technology stocks. Furthermore, we suggest over-weighting energy, commodities, precious metals, small capitalization stocks, value stocks and emerging market stocks to outperform in the years ahead. In particular, we believe that gold and precious metals investments will likely be a good source of non-correlated asset performance.
The most important factor for investing today is a forward-looking trend-following approach as opposed to a backward-looking or historic-return-based investment strategy. For nearly forty years, the U.S. investing public has enjoyed a steady diet of lower and lower interest rates that has fed historic bull markets in stocks, bonds, and real estate. We advocate investing in a new allocation strategy with overweighted allocations into overlooked value sectors like small capitalization, value stocks, precious metals, gold stocks, energy stocks, commodities, and commodity stocks.
Be the first to comment