

DNY59/iStock via Getty Images
The Set Up
It should come as no surprise to anyone at this point that the bull market we have witnessed over the past decade has been a highly unusual one. Often referred as the ‘most hated bull market’, it defined conventional knowledge about the markets and has caught off-guard even the most optimistic investors.
To a large extent, the bull market was fed by the technological advancements of the past decade, combined with the recent peak in globalization. Both of these factors kept inflation low and gave rise to the so-called big tech names. More importantly, however, the combination of these two factors allowed both fiscal and monetary authorities to resort to policies so unconventional that some were once thought to be pure fiction. More specifically, negative interest rates became the norm, consumers enjoyed ‘helicopter money’, zombie banks proliferated and high risk investments were priced as if no downside risks existed.
In recent months, however, many investors woke up to the reality that none of those things could keep going forever and deglobalization combined with high inflation appear to be the pivotal point for the financial system. As a result, it is now questionable whether quantitative easing and other unconventional policies could remain in place indefinitely, without causing harm to consumers and the financial system as a whole.
The Premise
There are many ways one could benefit from the current tightening cycle, provided that it is sustained at least in the short-term. In order for a strategy to be successful, it should be back-tested against the overall liquidity in the market and it should also be able to isolate other risks and provide a pure play for less liquidity within the markets.
To identify the potential losers of the current tightening cycle, we should first look at the winners during the massive year-on-year change of the Federal Reserve’s total assets following the pandemic.
FRED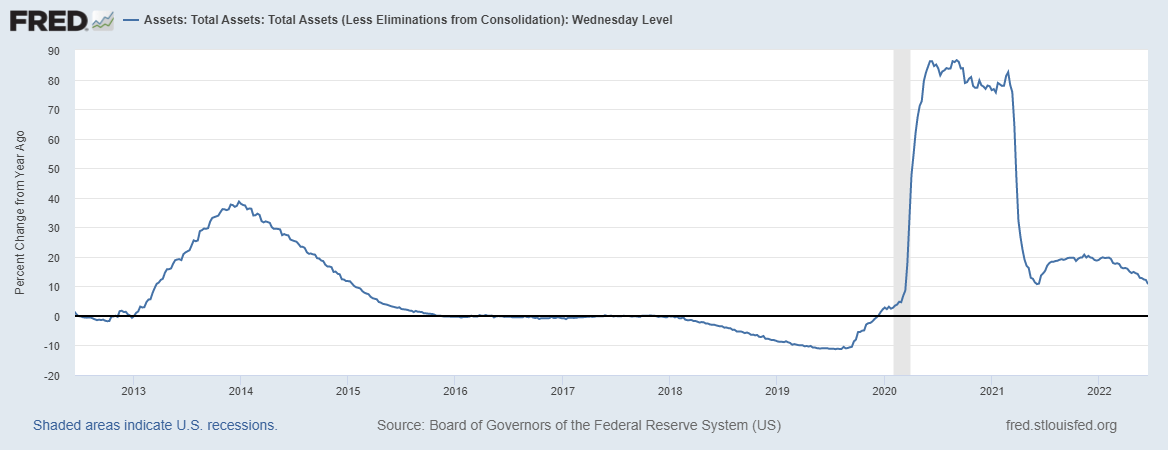
Not only did the Fed expand its balance sheet at unprecedented levels during 2020-21 period, but also the 10-year real interest rate cratered to negative territory.
FRED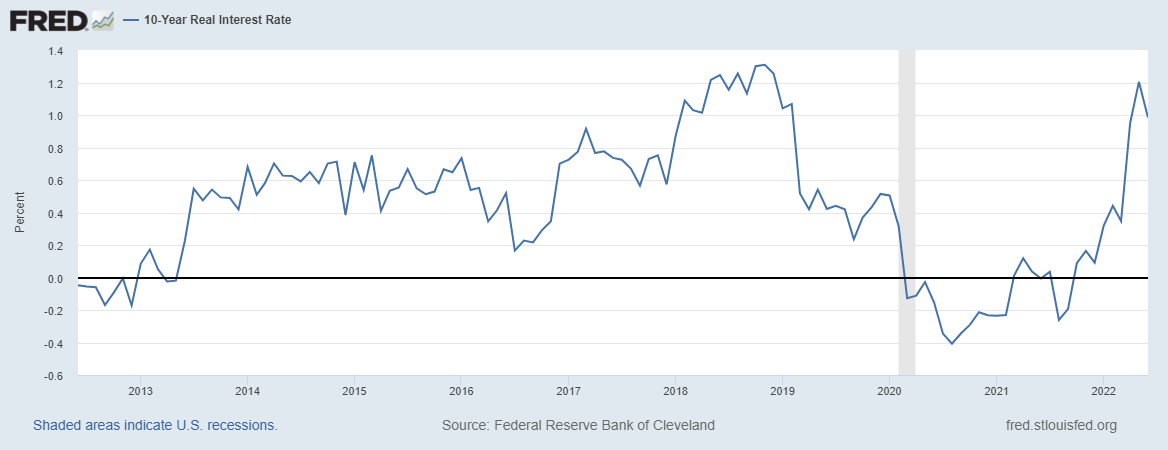
This created temporary tailwind for long-duration and risky assets, however, it did not last long as real rates quickly came back to their pre-pandemic highs while the rate of the Fed’s balance sheet expansion is now quickly slowing down.
Anyone following the performance of U.S. Equity Factors (outlined on Seeking Alpha’s main page) would have noticed that year-to-date growth and momentum factors are the worst performers, while value and high dividend yield experienced the lowest decline.
Seeking Alpha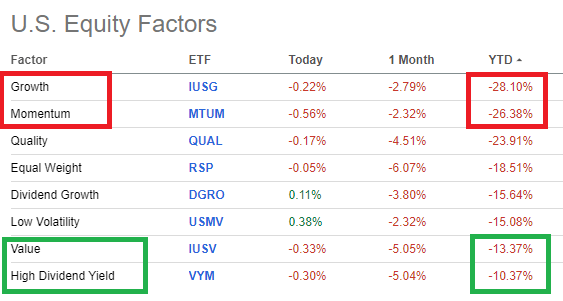
An easy way to illustrate this trend is to compare performance of iShares Edge MSCI USA Momentum Factor ETF (MTUM) to that of iShares Edge MSCI USA Value Factor ETF (VLUE).
Seeking Alpha
As expected, the holdings of MTUM ETF benefited massively from the loose monetary policy as they are usually high duration stocks. On the contrary, most value companies didn’t enjoy such a strong tailwind on their back and thus a wide gap between MTUM and VLUE opened in a matter of months.
As we see on the right-hand side of the graph above, this gap is now gone following the recent monetary tightening and inflationary pressures. The magnitude of this whole process is more clearly illustrated, if we divide MTUM by VLUE share price and plot this index since the inception of both ETFs.
prepared by the author, using data from Seeking Alpha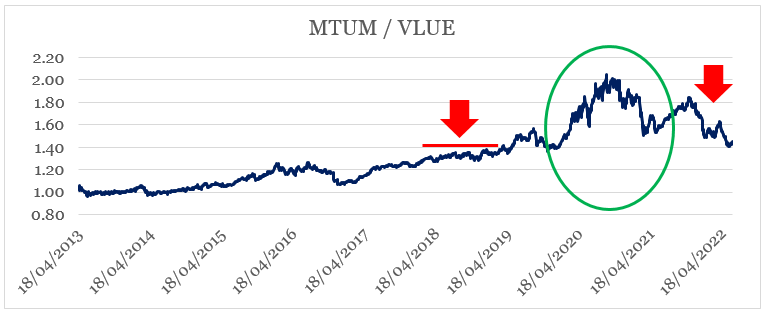
Circled in green is the period of massive liquidity influx, while the first red arrow shows the period when the Fed’s balance sheet shrunk and 10-year real interest rates peaked above 1%.
Therefore, by taking a long position in VLUE and a short position in MTUM, one could benefit from the current tightening cycle even as the broader equity market continues to decline.
However, there are a number of problems with such a strategy:
- Firstly, both ETFs tend to get very concentrated in certain industries which makes them heavily exposed to sector specific risk factors.
VLUE Holdings (Seeking Alpha) MTUM Holdings (Seeking Alpha)
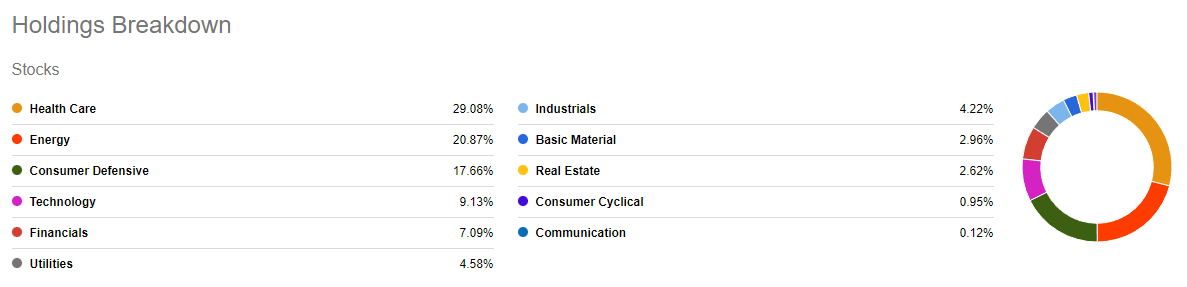
- Secondly, as many of you might have noticed from the graphs above, these ETFs rotate their holdings rather quickly.
The main issue with the last point is not so much the expense ratio associated with the ETFs, but the fact that VLUE ETF now consists predominantly of technology stocks, while MTUM is now made up mostly of health care, energy and consumer defensive stocks.
As we could see in the graph below, just in December of last year the top holdings of these two ETFs were very different. The reason why we are interested in the holdings from December of 2021 is that the gap between MTUM and VLUE was still high back then. Hence MTUM holdings from December are more likely to continue falling through the tightening cycle, while VLUE holdings from the same month are less likely to be impacted.
The Selection Process
In order to identify our pair trade, we will take a short position in one of MTUM major holdings and a long position in one of VLUE holdings. The reason why we constrain ourselves to the top holdings of the two ETFs is that these companies have been the most influenced by the momentum trade during the 2020-21 period. Moreover, by focusing on large and well-established enterprises we limit exposure to risk factors associated with smaller and less liquid companies.
MTUM and VLUE Top 10 Holdings (iShares)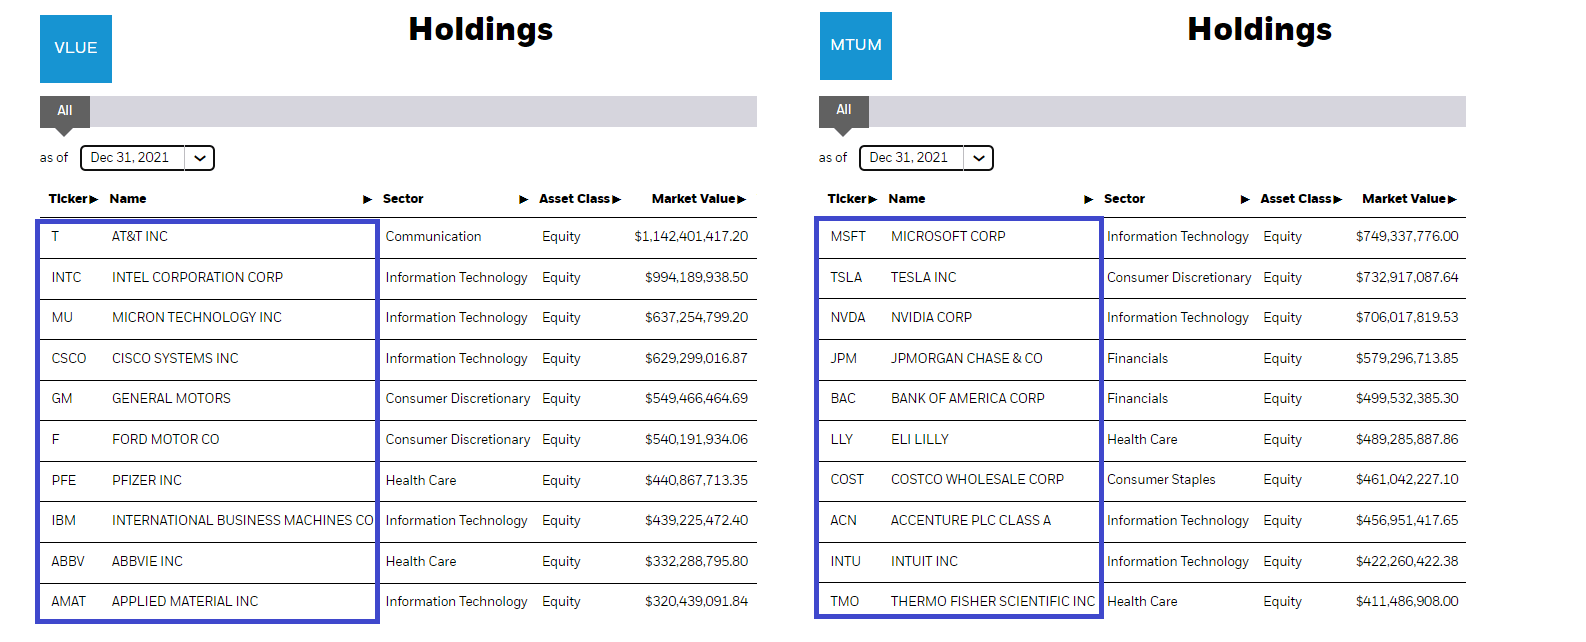
From the short-listed companies above, we will be looking for those that still exhibit high correlation with their respective ETF – VLUE or MTUM. In order to identify a pair from the two lists, we will also be looking at companies operating in the same or similar sectors. This way we will minimize industry specific risks.
From our value list, most companies still exhibit relatively strong correlation with VLUE, except for AbbVie (ABBV) and Pfizer (PFE).
prepared by the author, using data from Seeking Alpha
Interestingly enough, both of these companies are still one of the largest holdings of VLUE, with PFE now being the third largest holding.
VLUE Holdings (Seeking Alpha)
In our momentum list only Eli Lilly (LLY) has correlation of below 0.5.
prepared by the author, using data from Seeking Alpha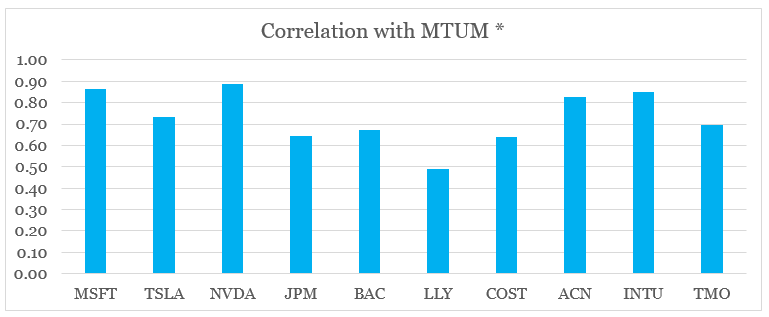
All that excludes all the health care companies from our list (except for TMO), which leads us to believe that these stocks were more affected by other outside or industry specific risks than the rest of the companies identified in our list.
Based on the companies left, we could identify three sectors from which we have both a momentum and a value stock:
- Semiconductors – Intel (NASDAQ:INTC), Micron Technology (MU), Applied Materials (AMAT) and Nvidia (NASDAQ:NVDA);
- Automotive – Ford (F), General Motors (GM) and Tesla (TSLA);
- Cloud Computing and Software – IBM (IBM), Microsoft (MSFT), Intuit (INTU);
To select our final pair, we will have a look at the correlation matrix between the two lists of companies identified above. By selecting companies with high correlation with each other, we could make sure that these businesses have similar risk exposures and as such we will be able to better isolate the momentum versus value risk factors by taking a long position in one and a short position in the other.
prepared by the author, using data from Seeking Alpha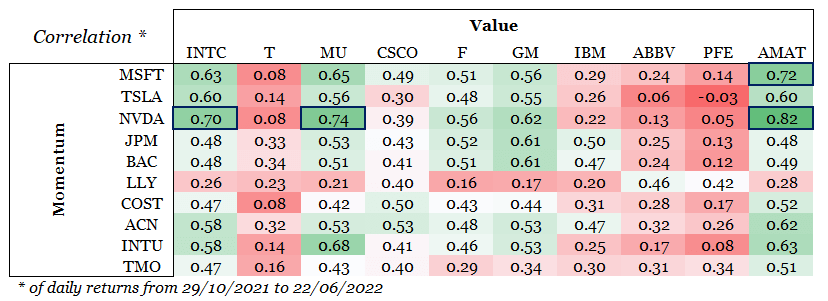
Based on the data, Nvidia stands out as the perfect candidate from the momentum list by exhibiting strong relationship with Intel, Micron and Applied Materials. While all three value companies will be a good fit, Intel is the most comparable business to Nvidia with both companies competing in the consumer, data center and automotive space with their CPU and GPU roadmaps.
A Closer Look At The Two Businesses
Before we make our final call, we should make sure that both companies are identical, both financially and from a business point of view.
To begin with, we could see that the spread between Intel and Nvidia closely follows the spread between MTUM and VLUE we saw above.
Intel vs. Nvidia Share Price Performance (Seeking Alpha)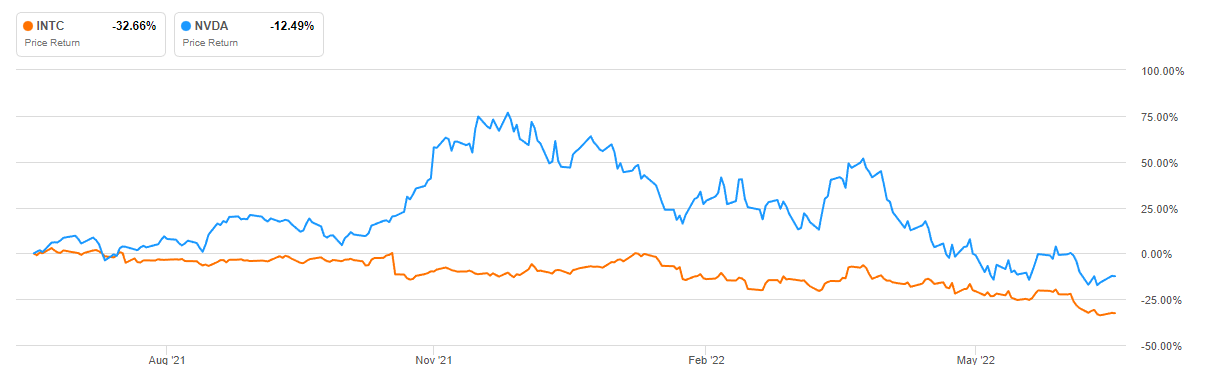
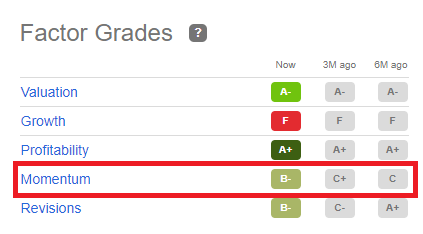
Looking at Seeking Alpha’s factor grades for both companies (see below), we could make the following observations:
- Momentum for Nvidia has been fading from A+ only three months ago to C+ today, while that of Intel has been going in the other direction.
- Both companies receive A+ on profitability, which is important in order minimize idiosyncratic risks associated with less profitable businesses.
- Lastly, Nvidia and Intel differ materially in their valuation and growth factor grades which is a major characteristic in distinguishing momentum from value stocks.
Nvidia (Seeking Alpha) Intel (Seeking Alpha)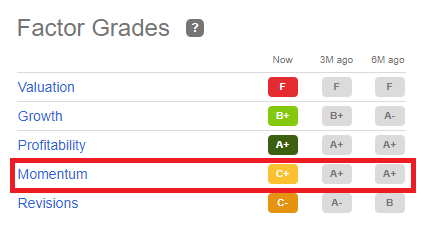
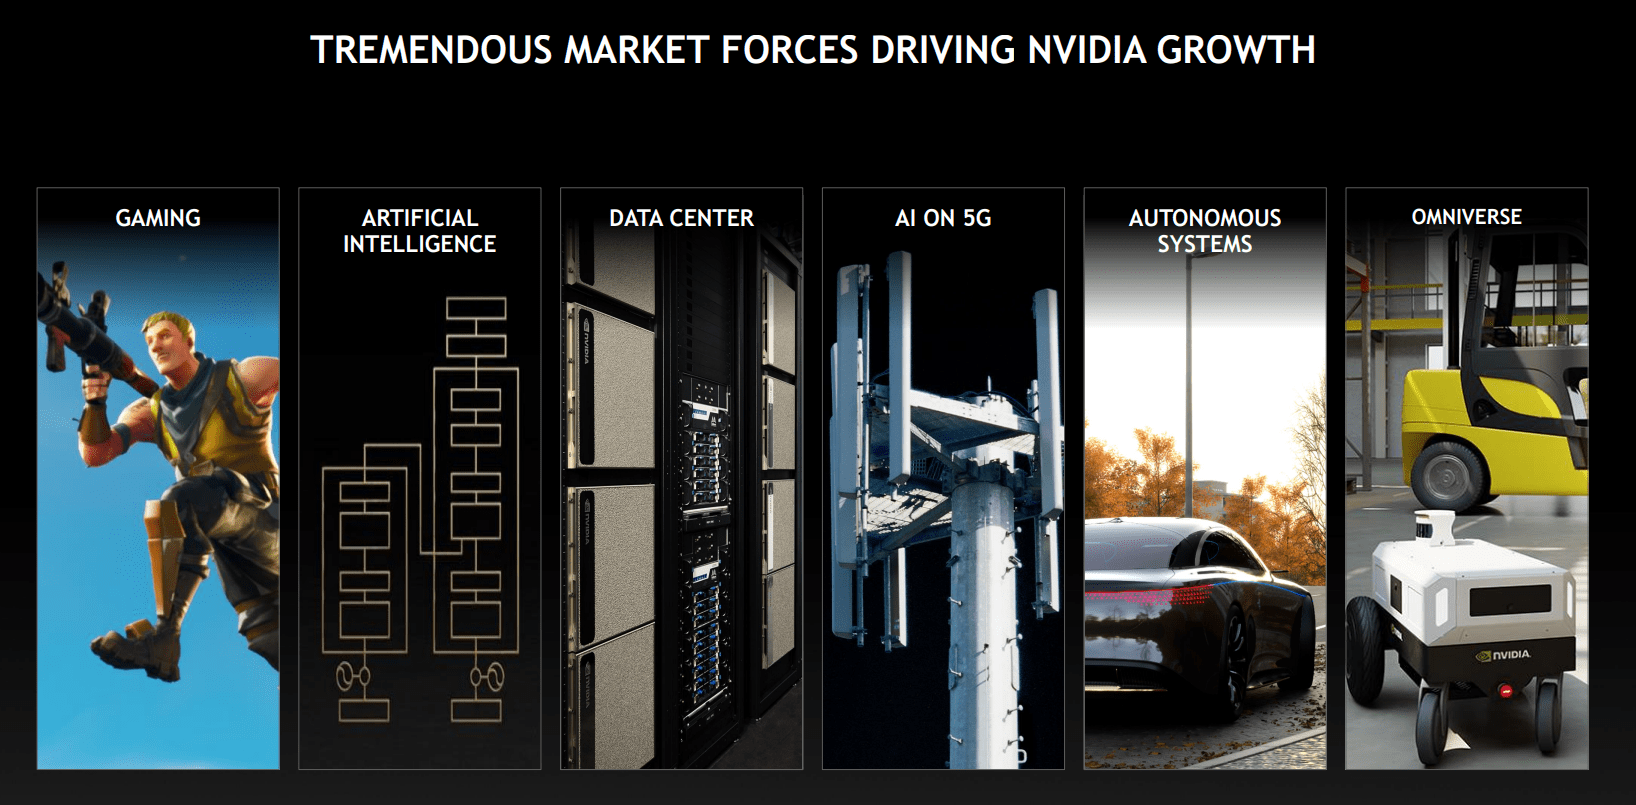
From a business point of view, Nvidia competes in the following segments: gaming, data center, professional visualization and automotive.
Nvidia Investor Presentation Nvidia Investor Presentation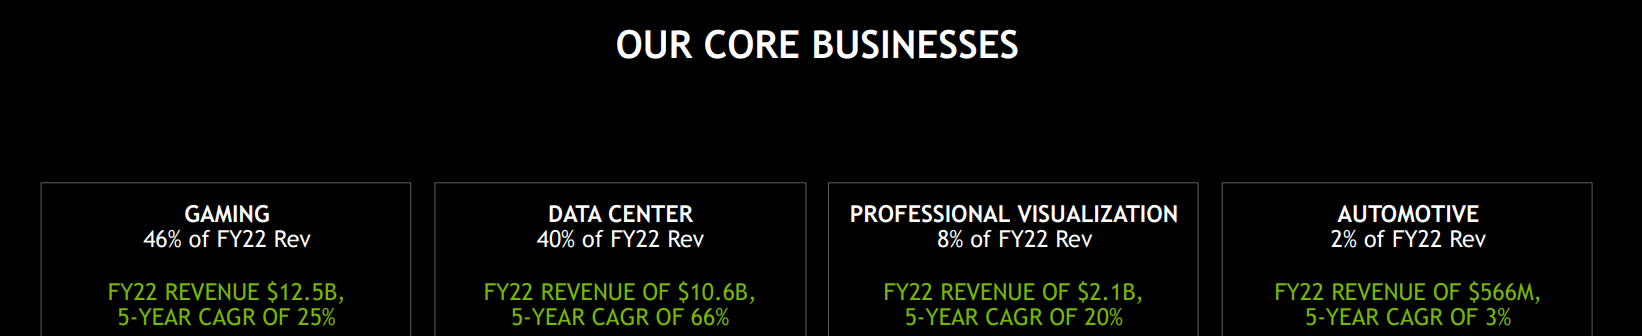
It is not a secret that Nvidia is the global leader in the GPU space and is now making stronger moves to complement its product offering with a strong CPU roadmap.
Nvidia Investor Presentation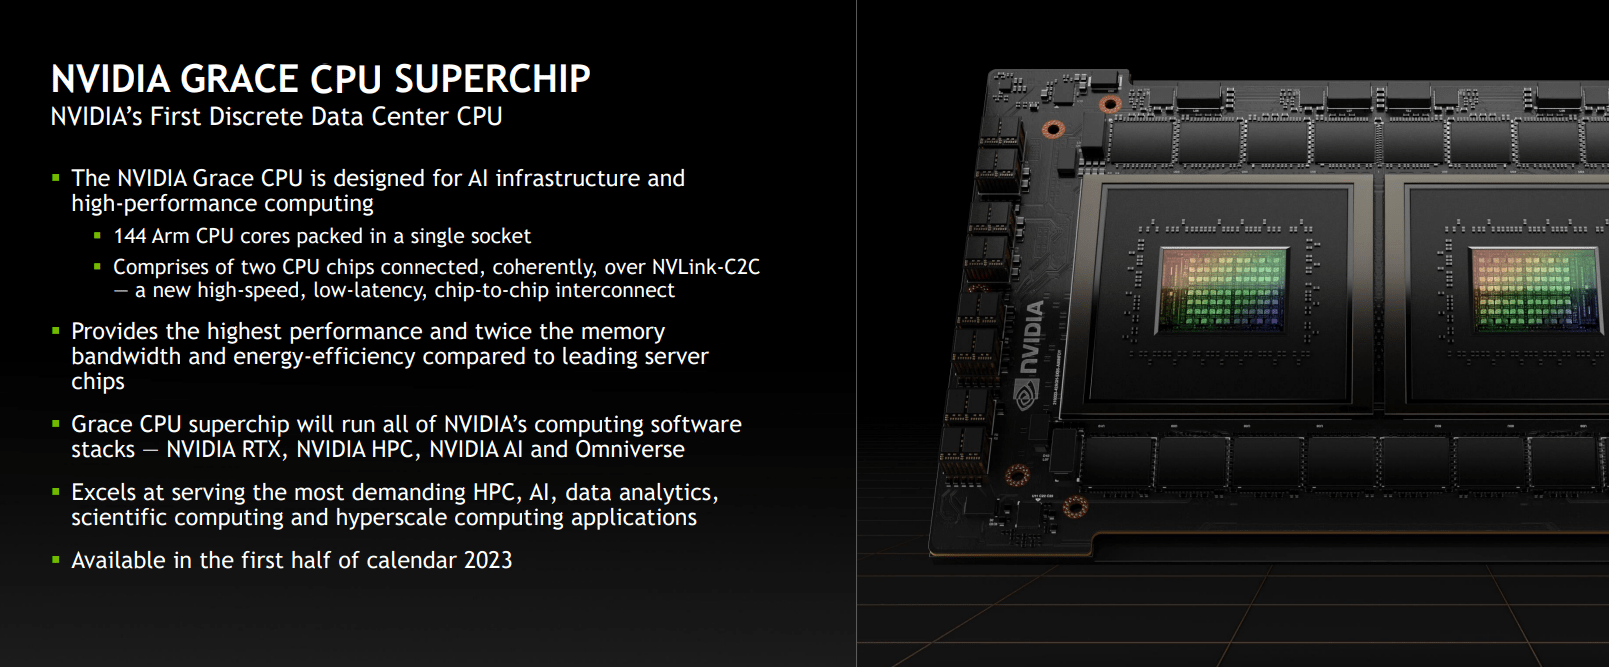
Similarly, Intel also competes in client computing, data center and automotive segments.
Intel Investor Presentation
However, we should mention that the upcoming spin-off of Mobileye will need to be considered as part of the strategy outlined in this article.
Seeking Alpha
Intel has also recently entered the lucrative GPU segment, which makes the company a fierce competitor to Nvidia and thus aligns the product offerings of the two companies.
Intel Investor Presentation
Lastly, a key major difference between Nvidia and Intel remains the ownership of the fabs. In other words, the former is a fabless company, while Intel has recently committed to not only keeping its manufacturing sites but also to compete directly with TSMC and Samsung. This makes Intel a far more capital intensive business than Nvidia is and thus exposes the company to additional risks. However, these idiosyncratic risks should be minimized over a relatively short period of time.
Investor Takeaway
The strategy outlined in this article shows the benefits of taking a long position in Intel and a short position in Nvidia in order to benefit from the current monetary tightening cycle. The main assumption of this strategy is that the tightening cycle continues at least in the short-term which in theory should further narrow down the performance gap between value and momentum factors. Similarly, the gap between Intel and Nvidia should also follow this trend, but investors will not be subject to risks associated with industry concentration of the ETFs. Having said that, idiosyncratic risks of the proposed strategy will be higher, however, these will be minimized over a relatively short holding period.
Be the first to comment