

Stock Market Entering A Bear Market Darren415/iStock via Getty Images
“For everything there is a season.”
– Ecclesiastes 3:1
Our last two quarterly letters conveyed a cautious attitude regarding both the economy and financial markets. The cautious season persists this quarter.
In the first three months of 2022, the only major asset class with a positive return was commodities. The second quarter saw a similar result, though this time the commodity index’s gain was modest at 2%.
It is too early to know for sure, but commodities may well have hit their cycle peak in early June, joining every other major asset class in a bear market. On June 8, the GSCI Commodity Index closed at $26.34, just above the intra-day peak on March 8 of $26.08.[1] From that June 8 peak to the end of the month, the GSCI Commodity Index fell 12.3% and continued to work lower through the first half of July.
Industrial metals are already down 32.3% from their cycle peak on March 4. Oil too peaked in early March with a closing high of $123.70 on the 8th.[2] Now below $100, oil is approximately 20% from the peak. Both metals’ and oil’s highs were on the heels of the Russian invasion of Ukraine. While the fighting continues, markets appear to be finding a lower equilibrium.
Every other primary asset class was down meaningfully in the second quarter. Gold was down 6.8% April through June. Long-dated US Treasury bonds were down 12.6% over the same period. Typically “safe haven” assets, Treasury bonds and gold offered no shelter from the storm. Not much of a defense for gold or Treasuries, but risky equities did perform worse. The S&P 500 was down 16.1% during the quarter with global equities just slightly better, down 15.1%.[3]
For the full first half of the year, commodities are still a significant winner; up 35%. Gold is down 1.5%. Both the S&P 500 and long-dated Treasury bonds are in a classic bear market: the S&P 500 is down 20% and long-dated Treasury bonds are slightly worse; down 21.9%. A 60/40 benchmark was down 16%. Grey Owl’s All-Weather strategy finished the first half of the year down 10.2%.[4]
Market Internals Continue to Remain Weak
Matching the declines in the indices, market internals continue to show weakness. A review of Lowry Market Trend Analysis makes this clear. Of greatest significance, market internals have been weaker during the current equity market rally that began June 16 compared to the rally from May 12 to June 2. The net spread between Buying Power and Selling Pressure reached a new low during the week of July 10.
Figure 1 – (Lowry Research & CFRA Business 2022)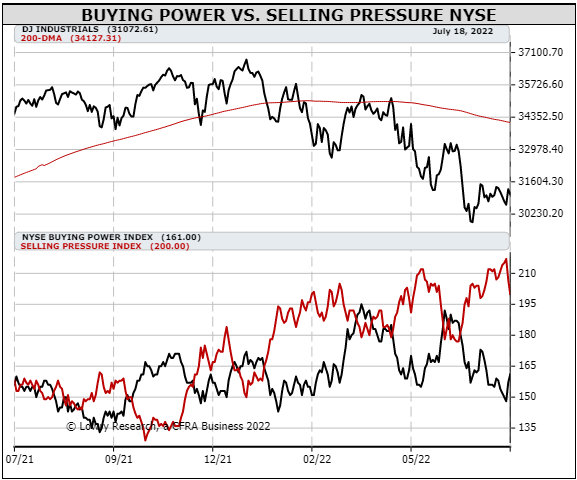
To mark an end to the equity bear market, the Lowry research is looking for: 1) extreme and indiscriminate capitulation selling, 2) followed by significant broad buying, and 3) positive divergences in market internals (i.e., more positive breadth and momentum) relative to price indices. We have yet to see any sign of the above.
Economic Growth
As we showed last quarter, the U.S. ISM Manufacturing Purchasing Managers’ Index (PMI) has been slowing since November. What was already a meaningful deceleration continues. From 57 in March, the PMI has dropped to 53 in June. The ISM PMI is a reasonably accurate leading indicator of overall economic growth. Its slowdown portends a decelerating U.S. economy.
Figure 2 – (US ISM Manufacturing PMI monthly)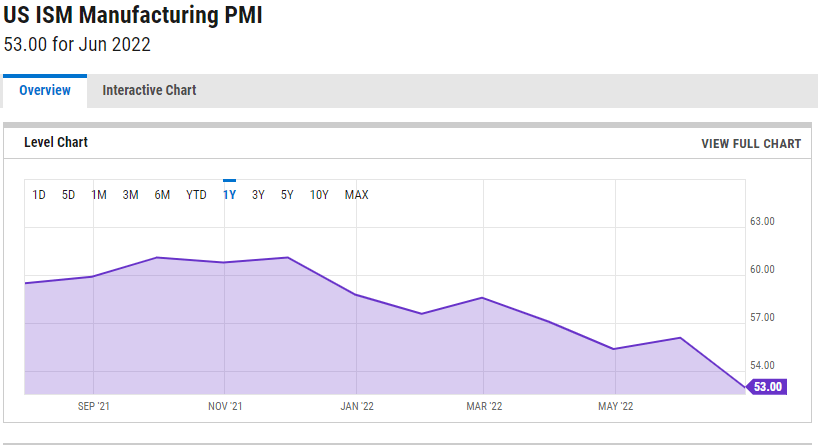
Corporate Profits
As we write, the second quarter earnings season has begun. JPMorgan (JPM) reported last week EPS (earnings per share) of $2.76 for the quarter compared to $3.78 for the same quarter last year – a decline of 27%. While not a perfect microcosm of the overall market, broad earnings declines appear likely. Yet, expectations remain for growth.
As of the end of June, the consensus expected $224.54 for S&P 500 full year 2022 operating EPS. This implies 8% growth over 2021’s $208.21; reasonable in the context of 5.7% annual earnings growth from 1999 to 2019.[5] However, if we pull out the anomalous 2020 and 2021 numbers, a different picture emerges. 2019 saw EPS of $157.12 (the highest level of EPS at that point). Starting from the 2019 number, the 2022 estimate implies 12.6% annual growth; DOUBLE the 20-year rate. Does that rate of growth really seem likely now that the trillions of dollars of government direct subsidies to businesses and transfer payments to individuals are gone?
We think downward revisions in earnings are probable. Until that occurs, continued pressure on equities and other risky financial assets remains likely.
Update on Fixed Income
While our caution on equities has proved sensible, we clearly added exposure to “safe haven” fixed income too early. Up to this point, the current inflation measures have trumped any fear of pending recession. There is at least some reason to believe we MAY be nearing a turning point.
Despite a June consumer price index inflation rate of 9.1% and producer price index rate of 11.3%[6], inflation expectations have been decreasing since late April. Markets expect the 5-year outlook for inflation 5 years from now to be just above 2%.
Figure 3 – (Federal Reserve Bank of St. Louis)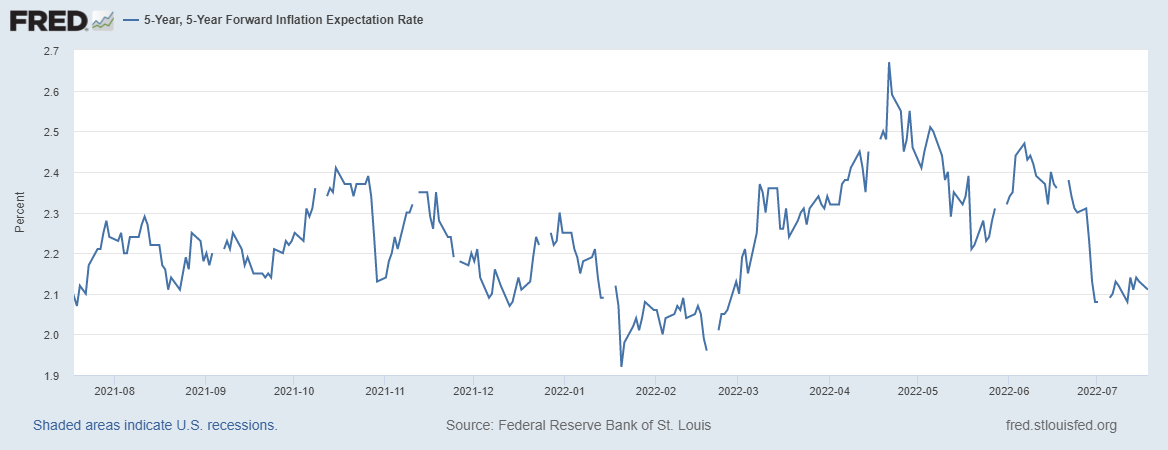
In addition, both oil prices and long-dated Treasury yields began to decrease at the same point in June, though oil is now falling at a much faster rate.
Figure 4 – (TradingView.com; Oil Futures (CL1) & 30-year Treasury Yields)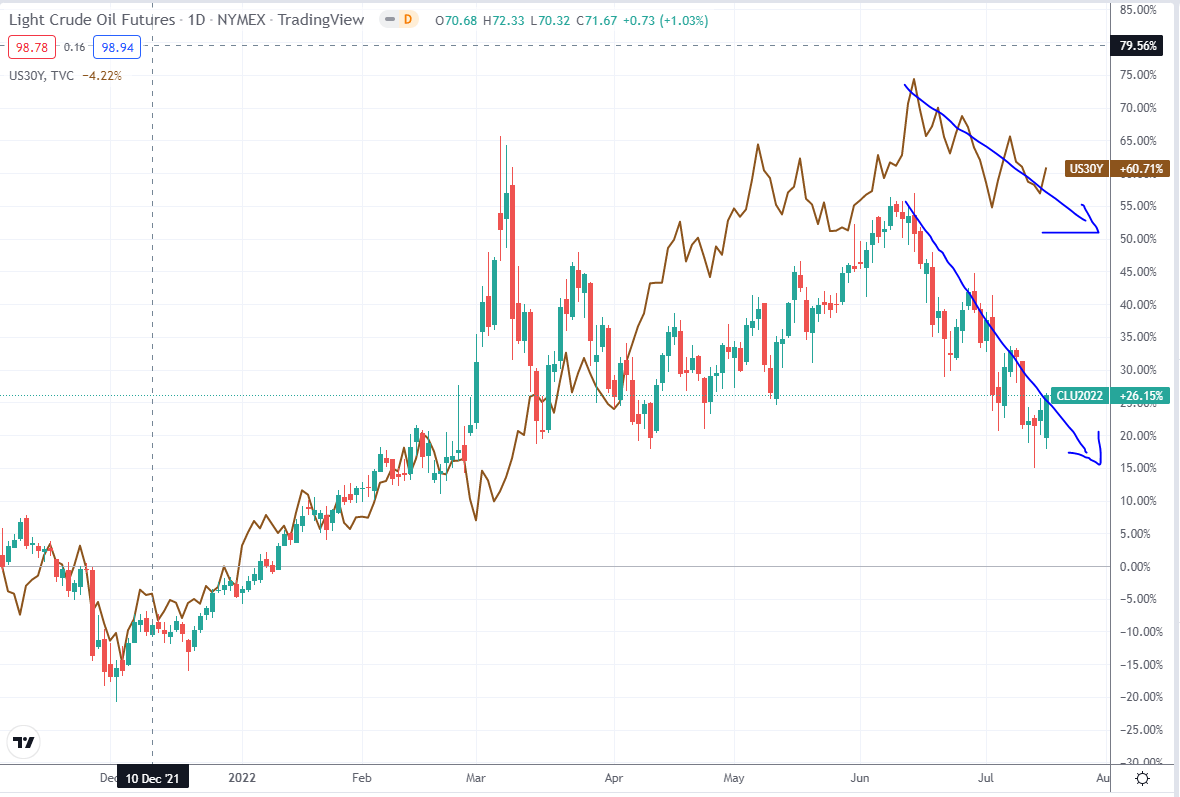
Should economic conditions continue to deteriorate and inflation begin to ebb, long-dated Treasury bonds may be the first major asset class to turn positive.
Positioned for Continued Economic Deceleration and Market Volatility
Beginning in late 2021 and more aggressively in January 2022, we shifted the Grey Owl All-Weather portfolio to a decidedly more “all-weather” stance from the more “risk-oriented” positioning late in the third quarter of 2021. That action continues. Our “safe haven” positions, particularly our cash allocation, are the largest they have ever been. Fixed income makes up just over 20% of our portfolio divided evenly between very short and long-dated bonds. The long-dated bonds are half U.S. Treasuries and half international with a focus on developed markets.
We recognize that the current bear market is in full swing, has been for some time now, and thus more and more of the negatives are widely known. When market internals begin to strengthen, economic indicators shift positive, and sentiment indicates a nadir, we aim to quickly move to a more aggressive, risk-oriented posture. For now, the season calls for caution, patience, and preservation of capital.
*****
As always, if you have any thoughts regarding the above ideas or your specific portfolio that you would like to discuss, please feel free to call us at 1-888-GREY-OWL.
Sincerely,
Grey Owl Capital Management, LLC
[1] Represented by the ETF GSG.
[2] Measured using CL1 – Light Crude Oil Future – on the NYMEX.
[3] We refer to U.S. equities, long-dated U.S. Treasury bonds, gold, and commodities as “primary” asset classes borrowing the language of HCWE & Company. The idea is that these four assets best capture two variables that explain a significant amount of asset price movement: global growth (explained by investor risk sentiment) and inflation. This framework is the basis for a permanent portfolio, an “all-weather” portfolio, risk-parity, etc. U.S. equities and commodities are “risk” assets, while US Treasury bonds and gold are “haven” assets. The market (or asset class) returns are measured on a total return basis using index exchange-traded funds ((“ETFs”)): SPY for the S&P 500, ACWI for the MSCI All-Country World Index, GSG for the S&P GSCI Commodity Index, TLT for 20+ Year Treasury Bond index (i.e. “long-dated” US Treasury bonds), and GLD for gold.
[4] The Grey Owl All-Weather strategy performance is taken from an individual representative account. The 60/40 benchmark is 60% ACWI and 40% AGG for the iShares Core U.S. Aggregate Bond ETF.
[5] Annual growth calculated on a compound basis.
[6] Measured year over year.
This newsletter contains general information that is not suitable for everyone. The information contained herein should not be construed as personalized investment advice. Past performance is no guarantee of future results. There is no guarantee that the views and opinions expressed in this newsletter will come to pass. Investing in the stock market involves the potential for gains and the risk of losses and may not be suitable for all investors. Information presented herein is subject to change without notice and should not be considered as a solicitation to buy or sell any security. Any information prepared by any unaffiliated third party, whether linked to this newsletter or incorporated herein, is included for informational purposes only, and no representation is made as to the accuracy, timeliness, suitability, completeness, or relevance of that information.
The stocks we elect to highlight each quarter will not always be the highest performing stocks in the portfolio, but rather will have had some reported news or event of significance or are either new purchases or significant holdings (relative to position size) for which we choose to discuss our investment tactics. They do not necessarily represent all of the securities purchased, sold or recommended by the adviser, and the reader should not assume that investments in the securities identified and discussed were or will be profitable. A complete list of recommendations by Grey Owl Capital Management, LLC may be obtained by contacting the adviser at 1-888-473-9695.
Grey Owl Capital Management, LLC (“Grey Owl”) is a Virginia registered investment adviser with its principal place of business in the Commonwealth of Virginia. Grey Owl and its representatives are in compliance with the current notice filing requirements imposed upon registered investment advisers by those states in which Grey Owl maintains clients. Grey Owl may only transact business in those states in which it is notice filed or qualifies for an exemption or exclusion from notice filing requirements. This newsletter is limited to the dissemination of general information pertaining to its investment advisory services. Any subsequent, direct communication by Grey Owl with a prospective client shall be conducted by a representative that is either registered or qualifies for an exemption or exclusion from registration in the state where the prospective client resides. For information pertaining to the registration status of Grey Owl, please contact Grey Owl or refer to the Investment Adviser Public Disclosure website (www.adviserinfo.sec.gov).
For additional information about Grey Owl, including fees and services, send for our disclosure statement as set forth on Form ADV using the contact information herein. Please read the disclosure statement carefully before you invest or send money.
Be the first to comment