

LilliDay/E+ via Getty Images
Historically, as shown in Table 1, the stock market peaks at or near the start of a recession, generally within a month or two. The exception was the dot-com crash in 2001. Then the stock market peaked seven months prior to the recession, and was a contributing factor to the recession that followed.
Table 1
National Bureau of Economic Research; S&P 500 Dow Jones Indices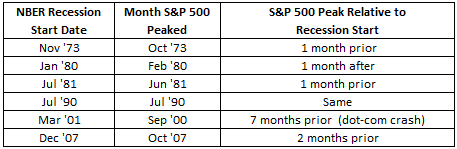
Of course, not every stock market decline is followed by a recession. We need other defining evidence. More on this in a moment.
The Fed wasn’t sure when the Great Recession started
Importantly, the NBER defines the start of a recession as the first month when the economy begins a downturn. However, the first month in which the economy slows is imperceptible to most of us, and even if we did notice, there may be considerable uncertainty whether it is a period of slowing growth or the beginning of a recession. The NBER doesn’t determine the official start date until after the recession is well underway, or even ended.
The fact that a recession has started but no one really knows was demonstrated when Fed Chair Ben Bernanke reported to Congress in February 2008, two months after the official start of the 2007–2009 Great Recession, and four months after the stock market had peaked. Bernanke testified that the Fed was forecasting slow growth in 2008, but no recession (read here).
Were investors smarter than Bernanke? After all, the stock market peaked two months before the official start of the 2007-2009 recession. Or, were they only expecting slow growth? We need more than just a decline in the stock market to know if recessionary conditions are present.
Recession signals captured by the BaR Analysis Grid
Importantly, there are several consistent signals that precede a recession. Foremost, is that the 10-year/2-year Treasury note yield curve will have inverted a year or so before. Another dependable signal is the continuing increase in weekly unemployment claims that precedes a recession by about one year. These two indicators, and other reliable ones, have been incorporated into the BaR Analysis Grid©.
The BaR provides a graphical representation of the economy using 18 economic indicators. Like the yield curve spread and weekly unemployment claims, these indicators help to signal the tail end of an economic expansion. For this reason, the BaR clarifies the point at which the economy is nearing a recession tipping point, which has obvious consequences for the stock market.
The road to recession
For readers not familiar with the BaR, the best way to demonstrate its value is to show how it displays economic conditions prior to a recession.
For the 1990 – 1991, 2001, and 2007–2009 recessions, I’m showing what the road to recession looked like on the BaR. On the BaR grids, the MoC, mean of coordinates, is the average of all of the economic indicators used in the BaR. The MoC indicates the overall health of economy. As the MoC moves rightward and up, the economy is expanding. When the MoC moves leftward and down, economic growth is slowing. (You can read more about the BaR here.)
The road to recession can be uneven
During the period prior to the 1990 – 1991, the MoC shows a pattern of consistently moving downward, albeit with some hesitations, until the recession started.
On Grid 1, starting 18 months prior to the recession, and using three month intervals, the position of the MoC is shown. Two trends are noticeable. First, after the 18 month point, the MoC plots predominantly to the left, and any movements back into the expansion quadrant are limited. Second, the MoC moves downward towards the baseline, although on this grid it is not a continuous downward slope. The baseline is a calculated estimate, based on historical data, of approximately where the MoC should be when a recession starts. After the MoC has peaked and begins to go near the baseline, or goes below it, recessionary conditions are present. For the last three business cycle recessions (not including the 2020 shut-down recession), three months prior to a recession, on average, the MoC was 8% above the baseline. Although the left and right swings of the MoC are informative, what matters most is how near the MoC gets to the baseline.
Grid 1
www.econpi.com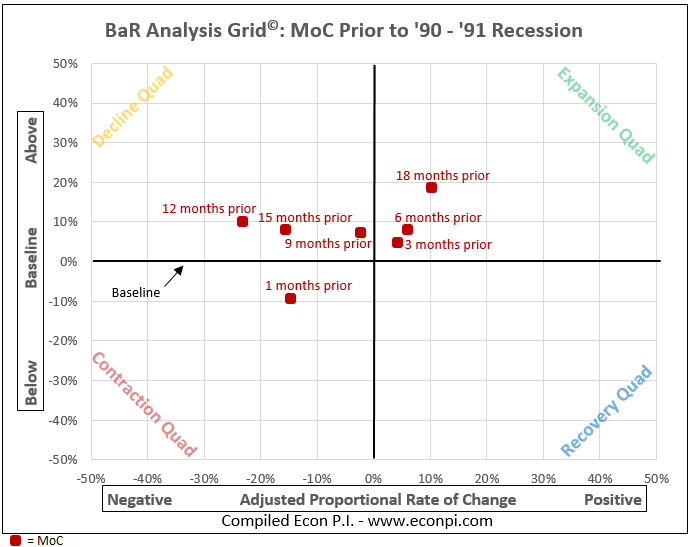
As shown in Grid 1, the MoC took a significant tumble 15 months prior to the recession. After that, from 12 months to 6 months prior, the MoC mostly moved sideways, although at 9 months the MoC had crept into dangerous territory. At three months prior to the recession, the MoC moved to a level that clearly signaled recessionary conditions.
BaR signals 2001 recession that forecasters missed
In Grid 2, we can see how the MoC moved prior to the 2001 recession. The peak of the economic growth rate, as measured by the BaR, occurred 12 months prior to the recession. After that there is a consistent pattern of the MoC moving leftward and down towards the baseline.
Grid 2
www.econpi.com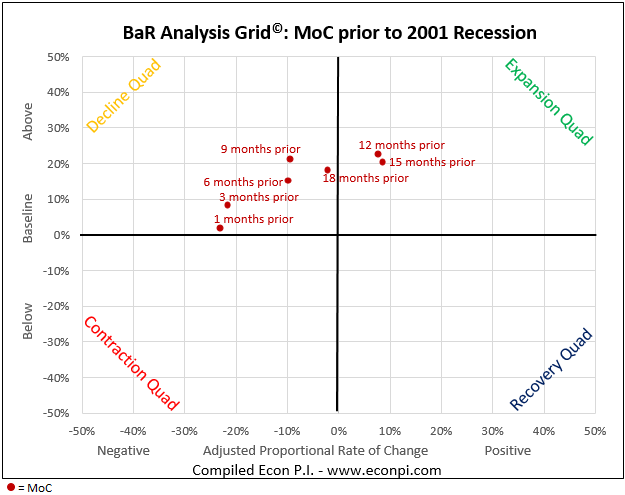
What’s remarkable is that the clear signal of a pending recession shown by the BaR in Grid 2 was missed by the vast majority of forecasters at that time. An after-the-fact analysis of the 2001 recession, published by the St. Louis Fed, included the results of earlier surveys asking: Has the U.S. slipped into a recession.” In July 2001, four months after the recession start, only 13% of the forecasters thought a recession had started.
Federal Reserve Bank of St. Louis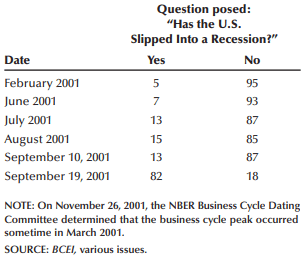
The 2007–2009 recession – the one that snuck up on the Fed
In Grid 3 we see conditions prior to the 2007–2009 recession. The pattern of the MoC is consistently downward from the 18 month point.
As noted earlier, two months into the recession, the Fed wasn’t expecting there would be one. However, three months prior to the recession, the MoC had already signaled a recession was likely.
Grid 3
www.econpi.com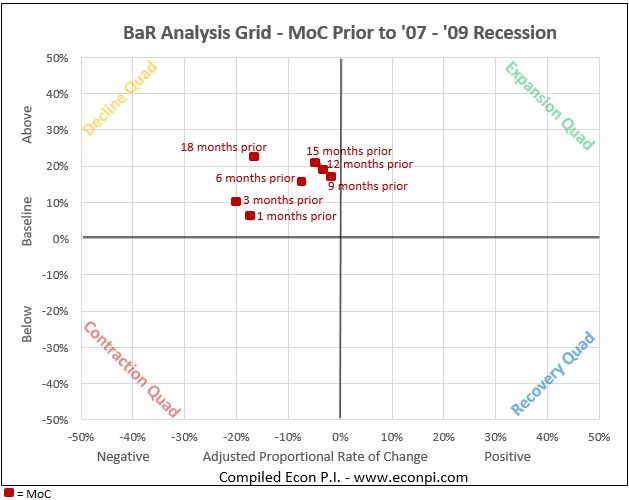
The 2009–2020 business cycle
In Grid 4, I’m showing the entire business cycle from 2009 to 2020. However, here the MoC is a three-month average. The 2020 shut-down recession was not a typical recession, but the MoC moved as expected, to the left and downward into the contraction quadrant, but at a vastly accelerated pace. From 4Q 2019 to 1Q 2020, we went from a relatively healthy economy to one in which millions were put out of work.
Grid 4
www.econpi.com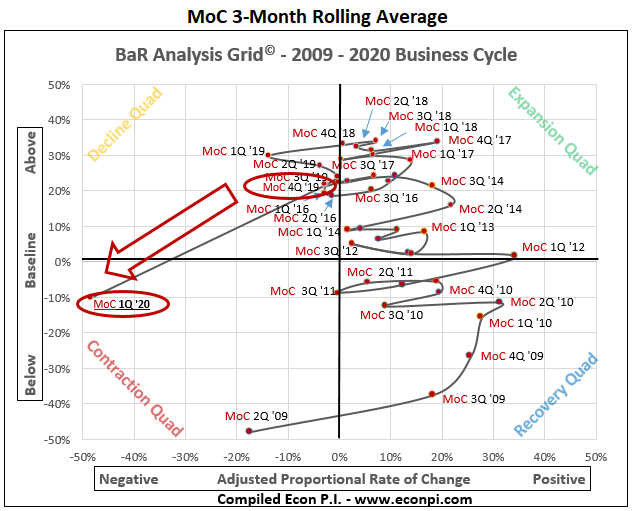
Where are we now?
The most recent BaR, published March 25, shows the MoC is 19.8% above the baseline. We are not near a recession point. However, some of the individual indicators that are used to calculate the MoC are at recessionary levels. This includes: consumer sentiment, total vehicle sales, and small business optimism. Inflation is obviously a factor here and its continuing impact on consumers and small businesses is likely to be crucial going forward. (Grid 5 is on a 100%/100% scale. The other girds were 50%/50%.)
Grid 5
www.econpi.com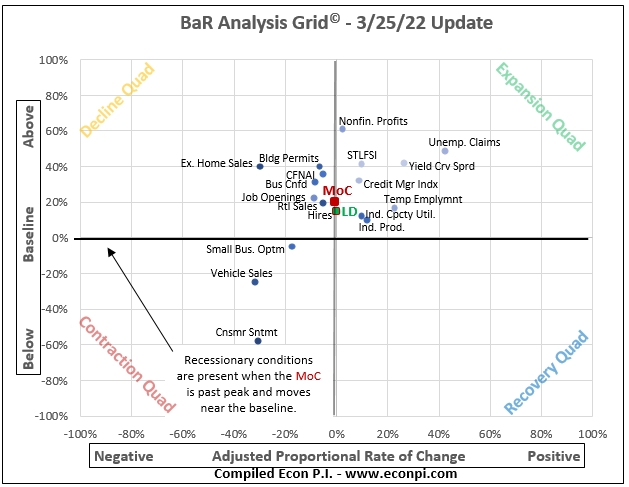
In contrast to consumer sentiment and small business optimism, the OECD business confidence index is well above the baseline, although it has declined recently. If business confidence continues to drop, added to where consumer sentiment and small business optimism are now, this would signal real trouble for the economy.
While it is useful to consider possible trends for individual indicators, what matters most is the position of the MoC and the LD (leading indicators). The LD is being tugged down by consumer sentiment, vehicle sales, and small business optimism, as all three are leading indicators. The three non-leading indicators that are keeping the MoC above the LD are corporate profits, credit managers’ index, and the CFNAI. For now the MoC is in a good place, but there are worrisome headwinds. The only thing to do is watch and see if the trend is positive, negative, or neutral.
What does this mean for stocks?
The MoC is a useful tool for investors because it signals when a downturn in the stock market is connected to a recession. Table 2 shows the positions of the MoC relative to the baseline, prior to the last three “typical” recessions. One month prior to the recession start, the MoC, using a weighted average, was 2.1% above the baseline (the recent recessions are weighted most heavily).
Table 2
www,econpi.com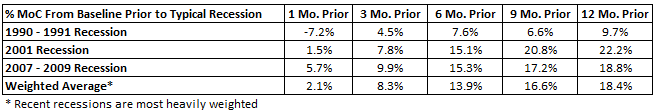
I certainly don’t know where the stock market is going to go over the next few months. But, if the MoC goes near the baseline, not only is there a likelihood of a recession, but also of a major stock market correction. Of the six recessions shown back in Table 1, the stock market dropped an average of 33.5% and the average correction was 13 months. Consider the MoC an early warning system.
Be the first to comment