

bfk92/iStock via Getty Images
You’ve heard me drone on for years about my favorite investment principles: (1) buy the most creditworthy companies; (2) diversify; (3) rarely sell; (4) reinvest dividends for compound income growth; (5) approach investment fees as you might a patch of poison ivy whilst wearing your string bikini. But go ahead and start rubbing your hands now together because I saved the very best for last… (6) get free stuff from the stock market.
Oh goody!!!
The most obvious example of getting free stuff from the stock market is for an investor to buy a share of stock for, let’s say, $100, and thereafter the company earns $100 per share. From that point forward, her investment has completely paid for itself using money that someone else earned for her. It’s like getting free stock for just sitting on your hands! Well sure, she’s gotta risk a loss of capital and it might take a few years for that to happen, but as the old saying goes: “all good things come to those who wait.”
… Ah, but history proves that even better things come to those who wait less.
It seems entirely intuitive that buying a stock that rapidly pays for itself with earnings should provide an investor with salutary returns, but then the question becomes “okay, but does it actually work that way in the real world?”
To find out, I downloaded stock market data from Professor Robert Shiller’s home page, where he has very conveniently calculated the 10-year annualized returns on the stock market for every month since January of 1871 (adjusted for inflation). I simply added two new columns to his spreadsheet.
Column one: for every month since January 1871, I took a one-year average of the market’s earnings over the next twelve months. Then I took the annual average for the earnings ten years hence. Doing so enabled me to calculate the average ten-year earnings growth rate for the stock market for every month since 1871 (adjusted for inflation).
Column two: for each month I entered a financial formula that calculates the number of years it would take for an investment in the stock market that month to pay for itself completely with corporate earnings using the actual ten-year earnings growth rate that I calculated in column one.
Finally, I calculated the statistical correlation between my column two and the ten-year real returns that Professor Shiller calculates for each month.
The result? A very strong statistical correlation between the years an investment in the stock market pays for itself with earnings, and the real investment returns over the next ten years. Most of the time throughout history, the quicker the investment pays for itself with earnings, the higher the returns for that lucky investor. For all you statistics nerds, the correlation comes to -.68, but a chart makes it easier to visualize this very tight relationship between the blue line (years of earnings to pay for the investment) and the red line (ten-year real returns – which you’ll notice I inverted and elevated for visual purposes).
Relationship between returns and years to pay for investment with earnings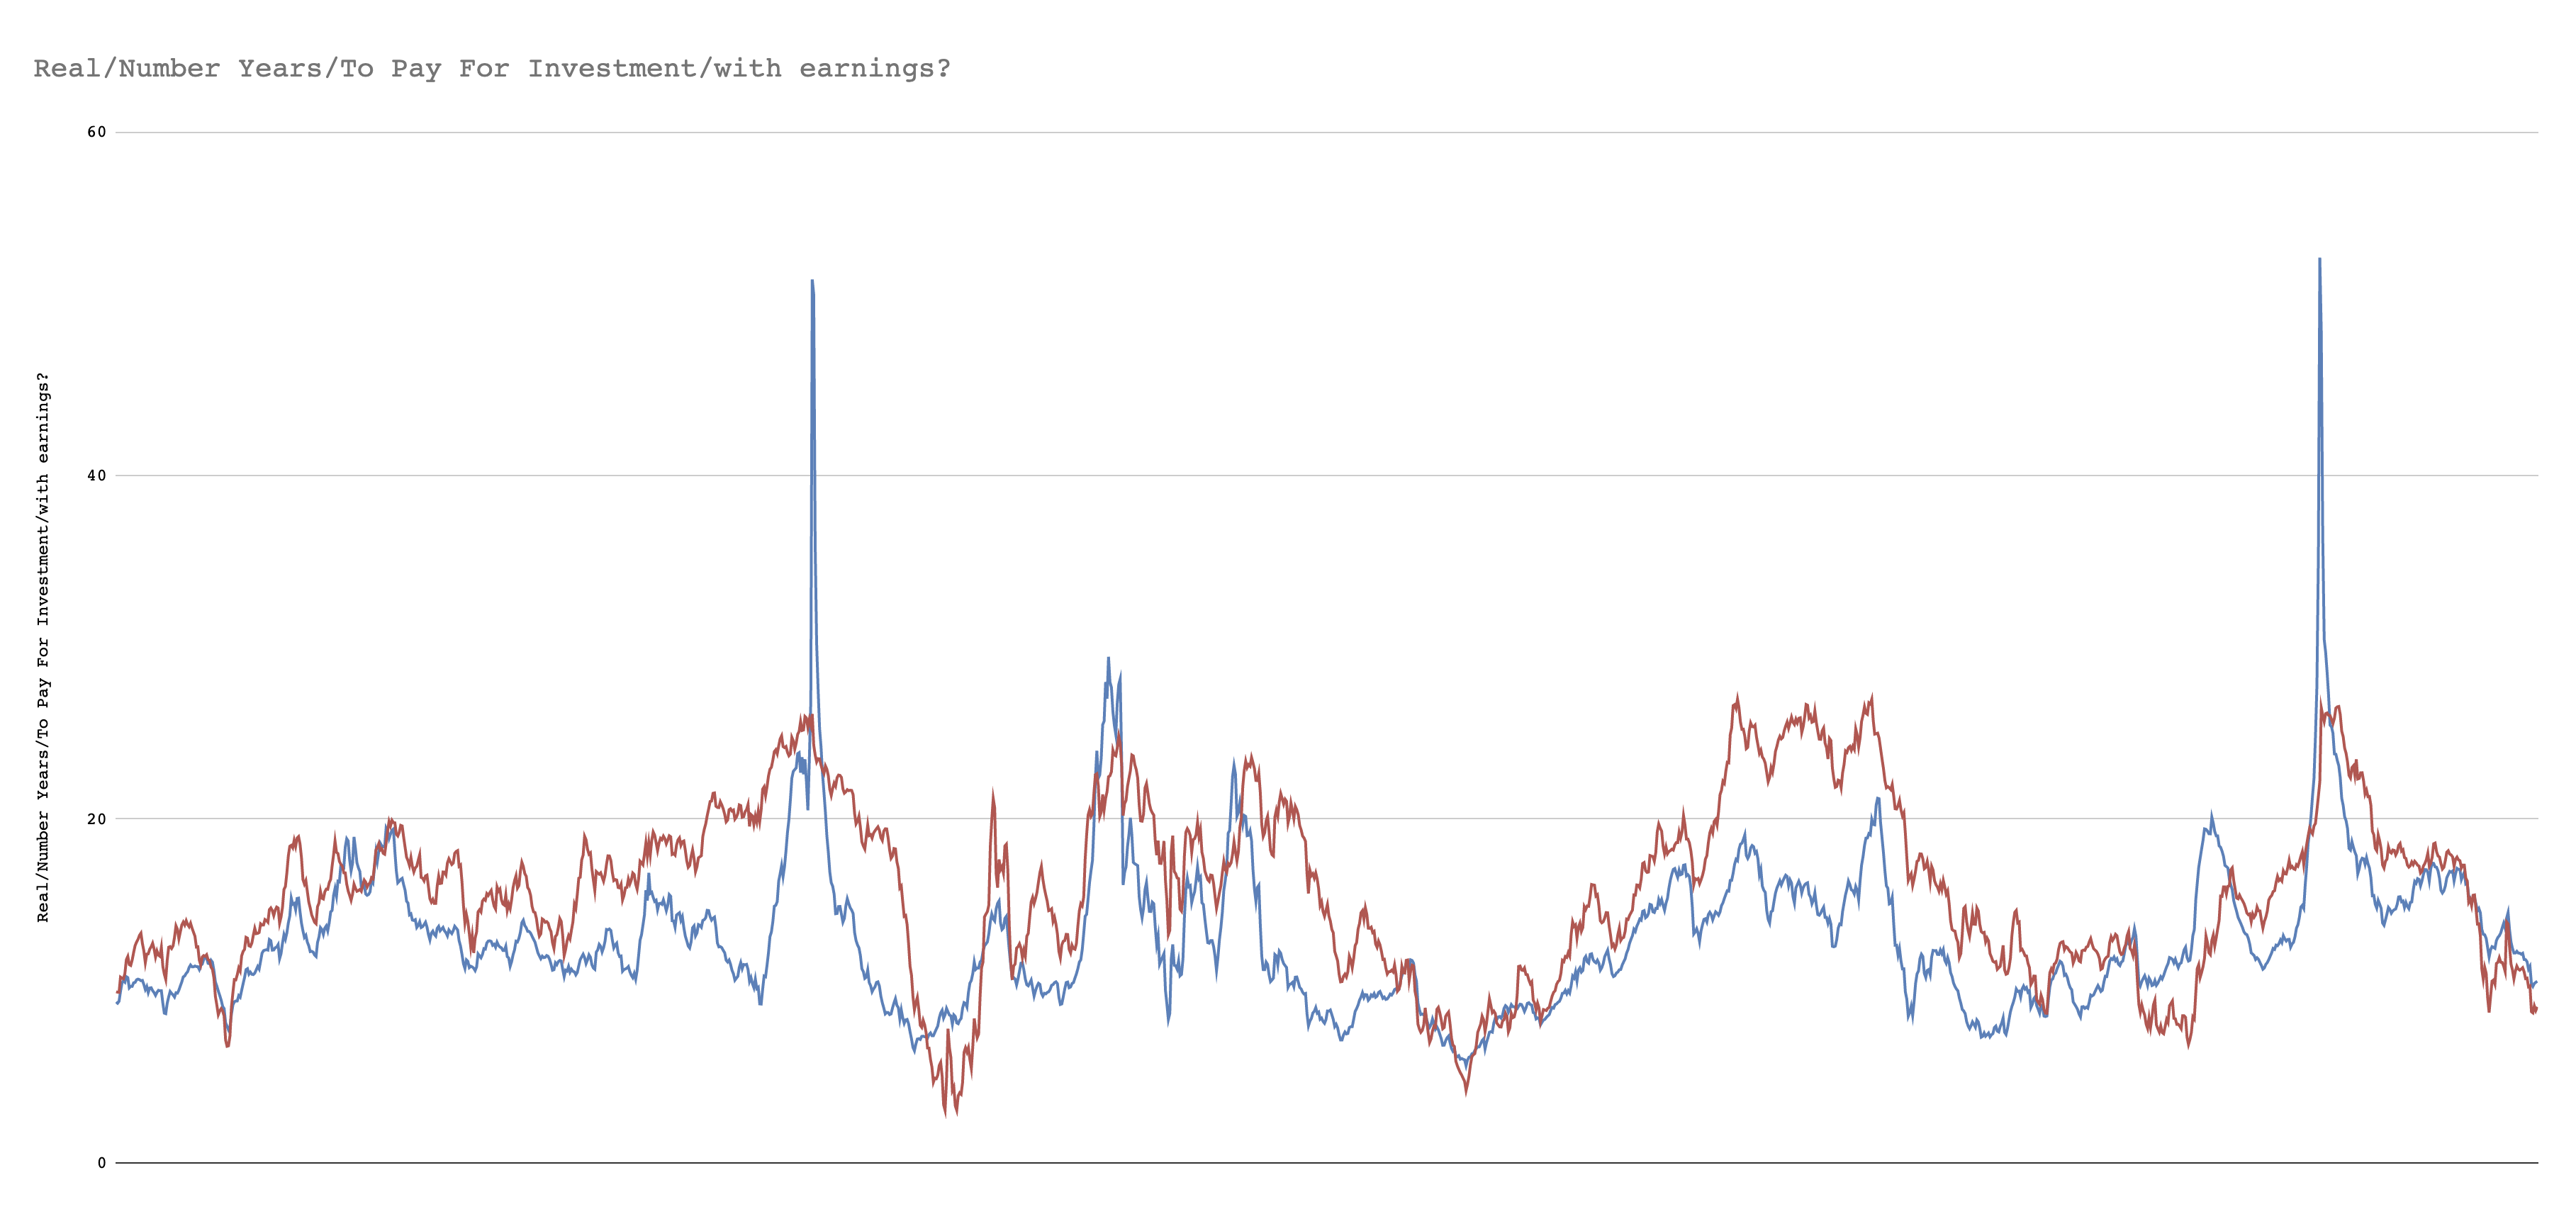
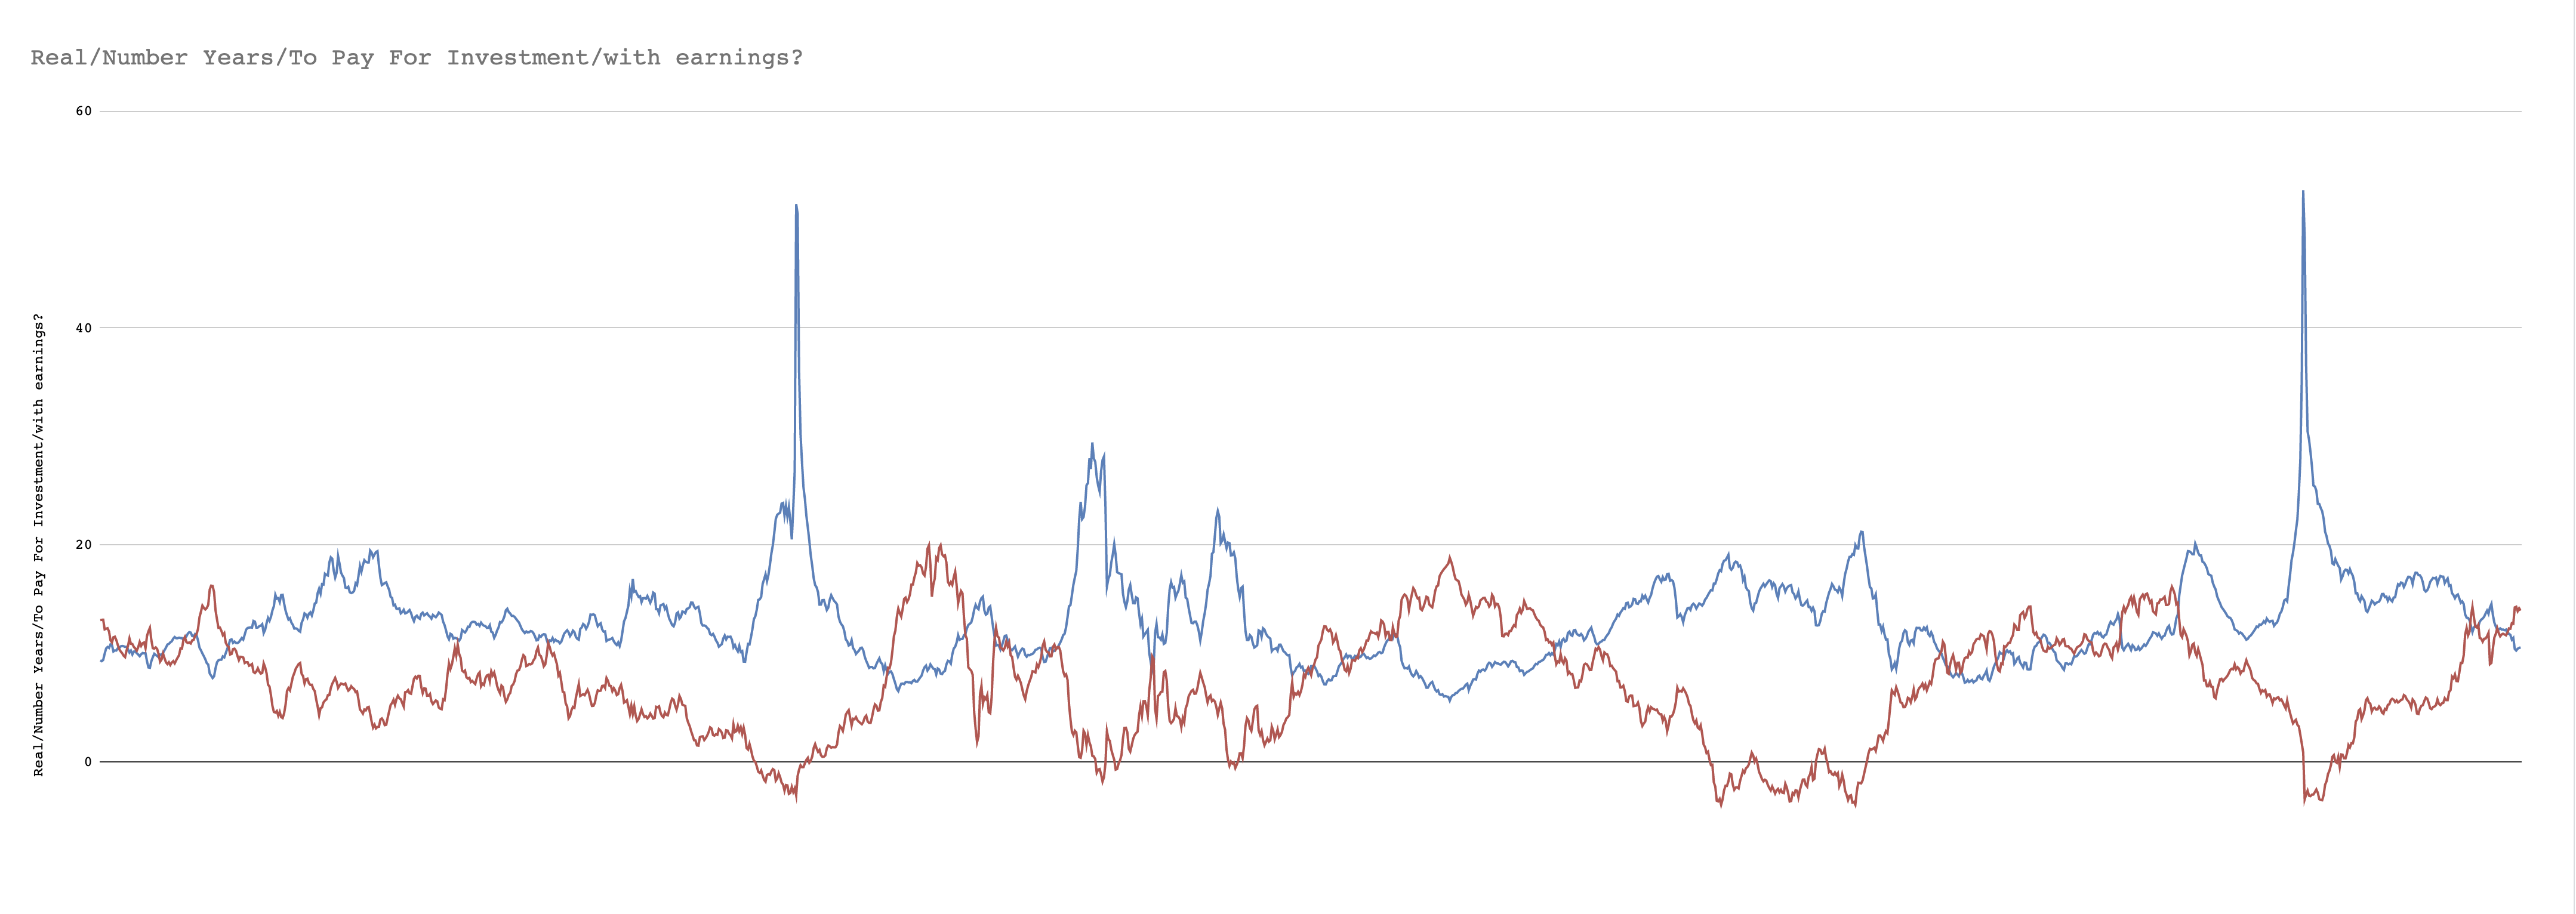
What does the non-inverted chart look like? So that you can see how the real returns fall as the “years to free stock” rises, observe:
Putting history into action with my portfolio.
Since 1871, investments in the broader stock market pay for themselves with inflation-adjusted corporate earnings within 13.1 years on average. If your investment in the broader market (…or here is an intriguing thought… perhaps any well-diversified portfolio of stocks) ultimately pays for itself in less than 13.1 years, then you’ll have done better than average. Statistically speaking, your investment returns will probably show it, too.
Being a notoriously cheap and impatient guy, it may come as no surprise that I’m out there with my little red plastic shovel and matching sand pail, trying to get as much free stuff from the stock market as I can… ASAP. Let’s take a wee gander at my personal portfolio. Using data from Seeking Alpha, I pulled the forward earnings per share for each company that I own and the expected future earnings growth. I then entered a formula onto my spreadsheet for each stock I own that automatically calculates the number of years it would take before those earnings (at the assumed growth rate) accumulate to equal the current stock price (which Google Finance automatically supplies to my spreadsheet every few moments while the market is open).
Author’s portfolio, data from Google Finance and Seeking Alpha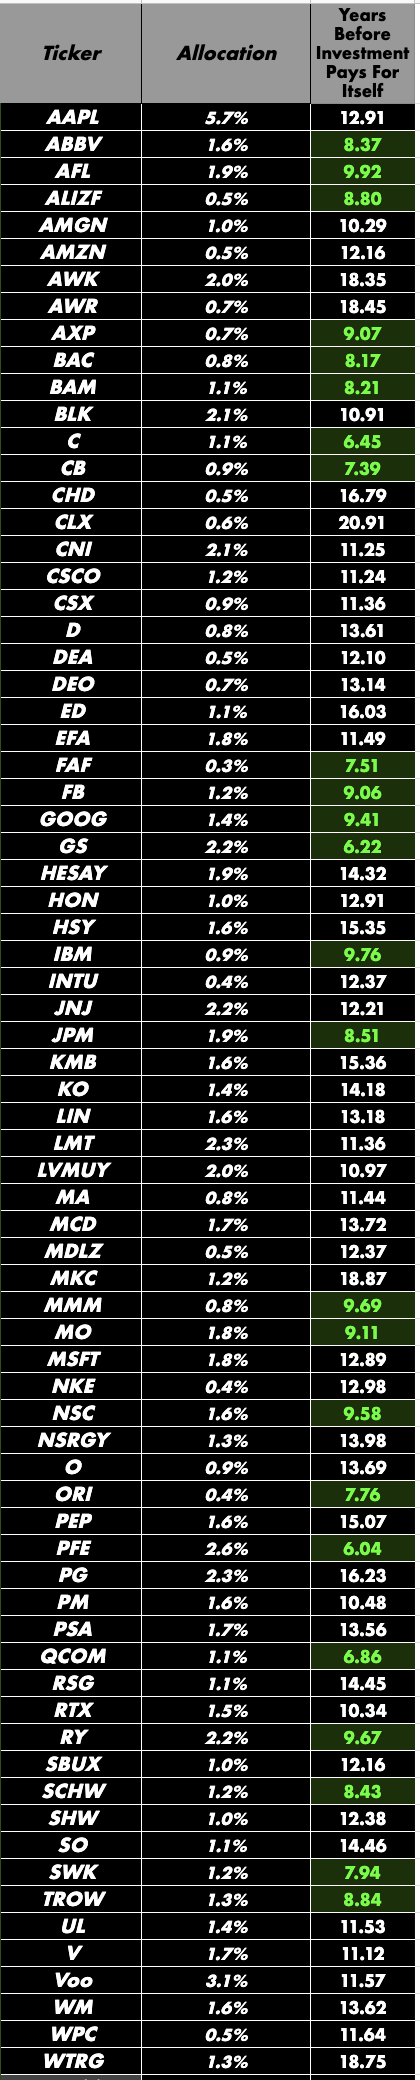
For example, here you can see that if I buy shares of Stanley Black & Decker (SWK) today, my investment could completely pay for itself with accumulated earnings per share in just under 8 years assuming (and making a very BIG assumption) that the earnings and earnings growth projections pan out. Or I might decide to pick Pfizer (PFE) instead of SWK because based on the earnings and earnings growth estimates, it should only take about 6 years before my investment in PFE completely pays for itself with accumulated earnings per share. Earnings growth estimates being highly uncertain, the truth is that I’ll probably just hedge my bets by purchasing more shares of BOTH stocks over time. Why? Because my guess is that with enough ongoing purchases of stocks (courtesy of living cheap and reinvesting dividends continuously), those earnings and growth estimates should probably average out to some approximation of what ultimately does end up happening with the earnings over the next five to ten years.
Setting up this spreadsheet was not a time-consuming process and I think anyone could do something similar for themselves. You can even see that I set the conditional formatting on the spreadsheet so that any stock that becomes free to me in under 10 years gets a fancy-looking green box! And oh how I do love little green boxes.
Designing a portfolio that’s purpose-built to get free stuff from the stock market… ASAP.
Could an investor build a small portfolio that’s diversified across industries and consists of just ten companies with stock that could (based on the forward earnings and growth assumptions) pay for itself in under 10 years? Why of course she could!!! Here’s an example of how she might do it:
Hypothetical ten stock portfolio (Portfolio Visualizer) Sector allocations (Portfolio Visualizer)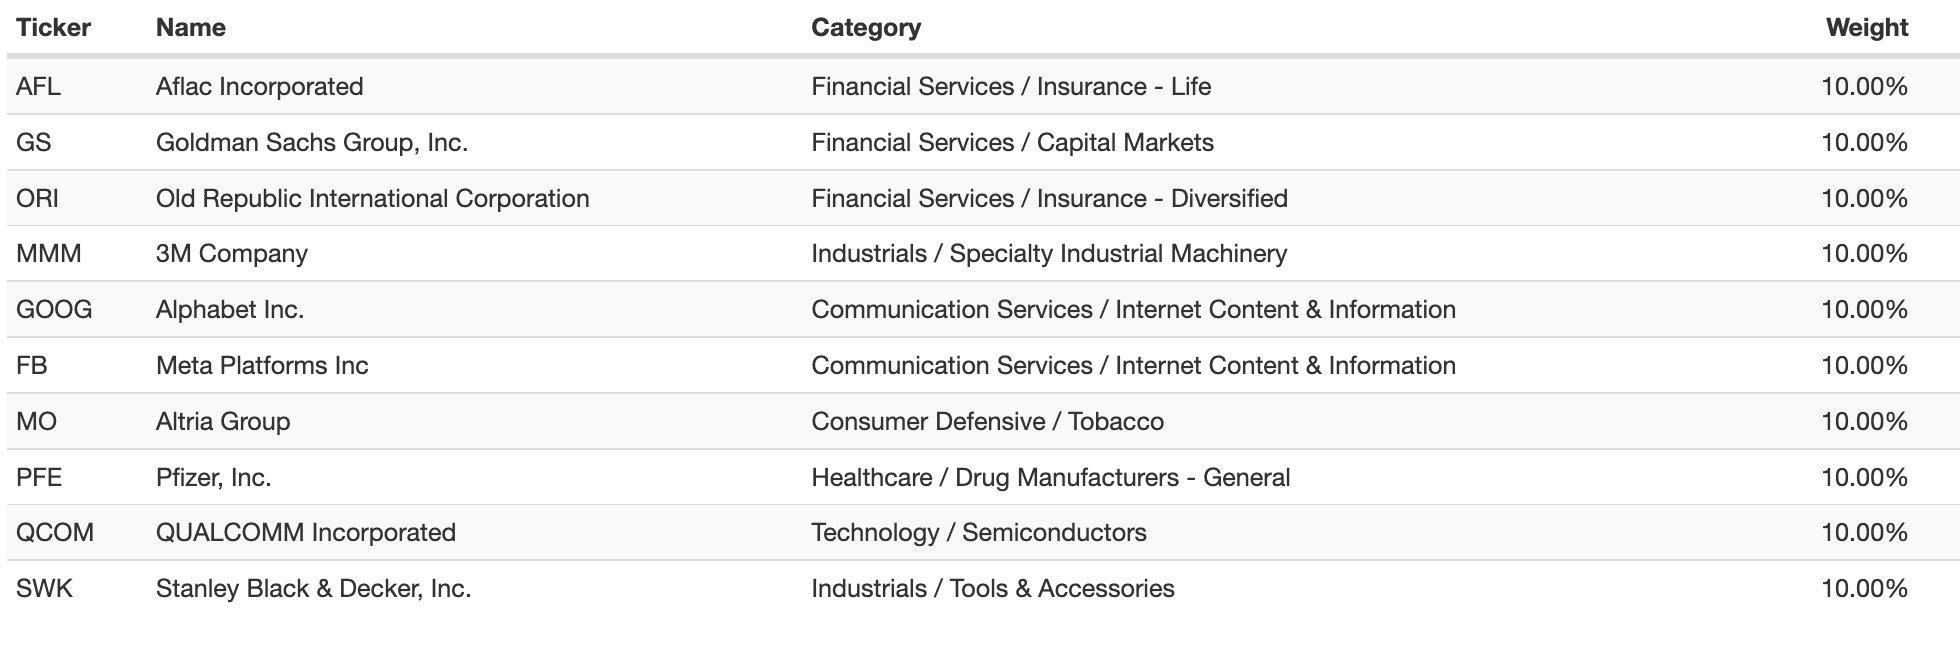
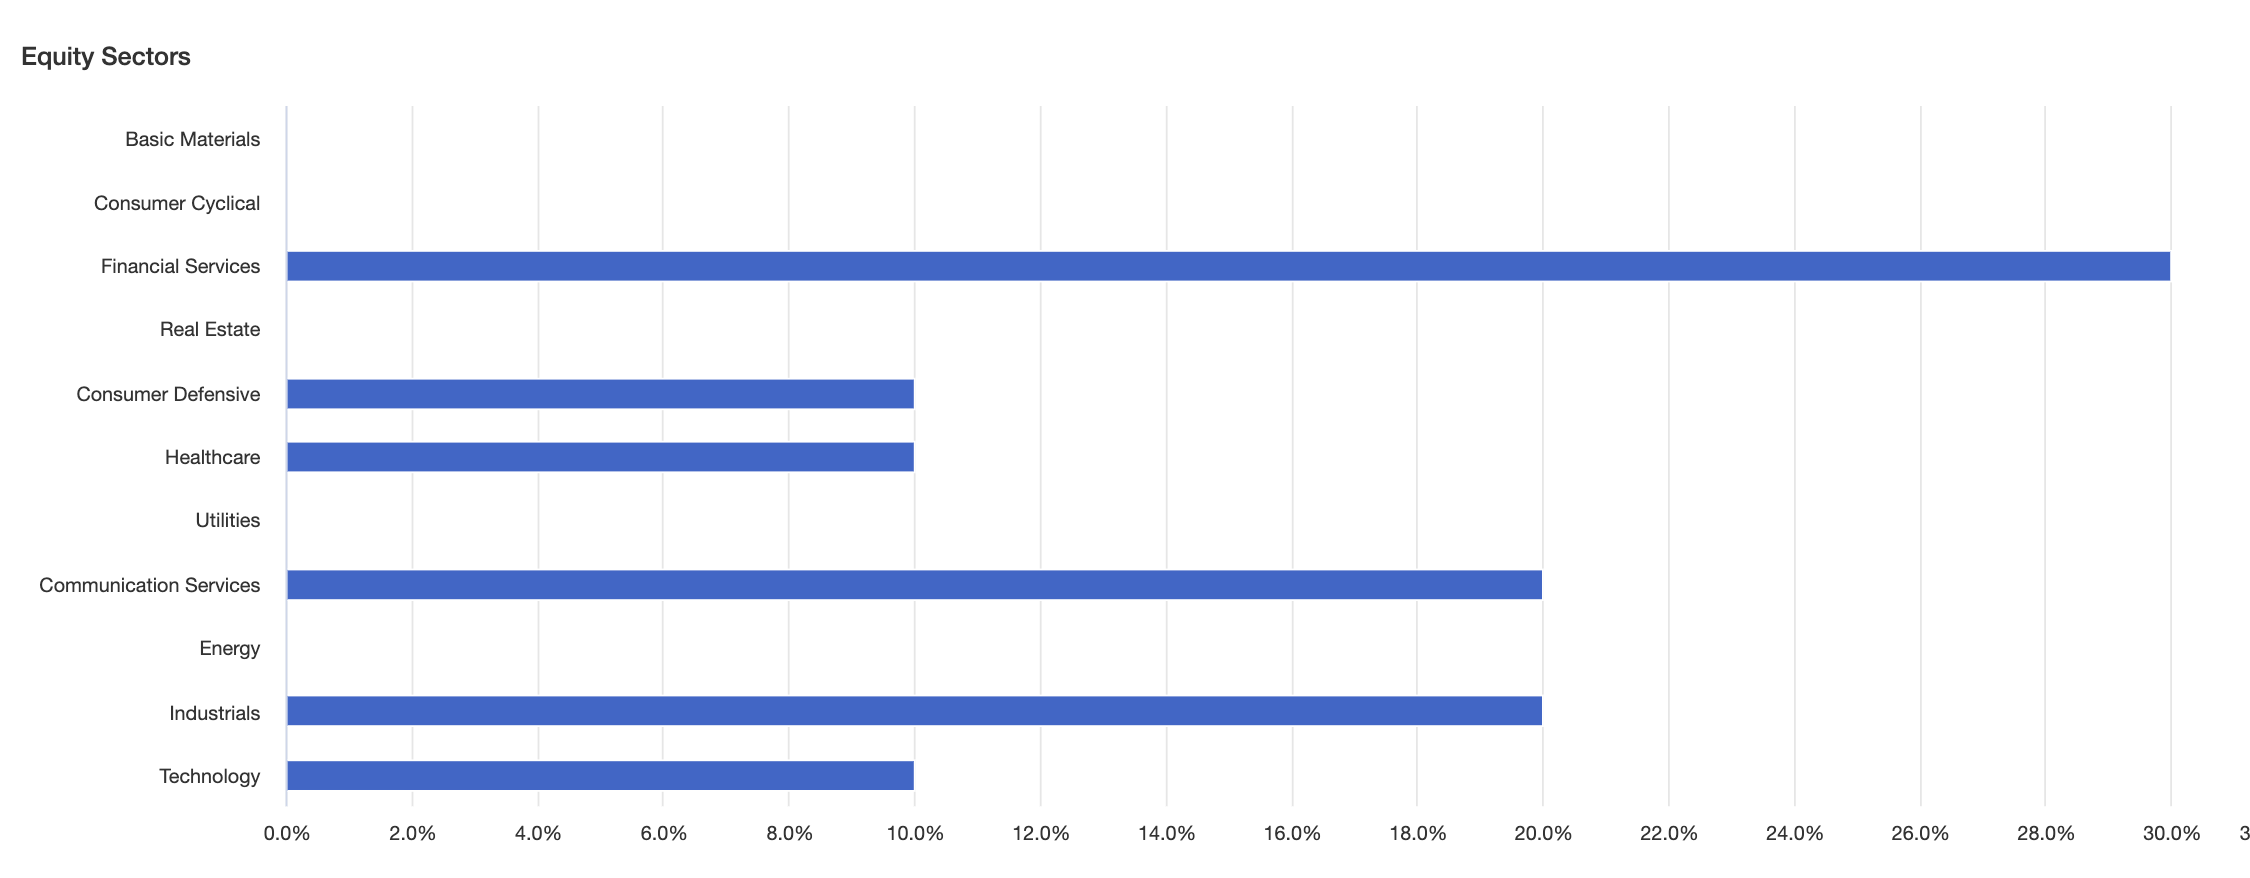
Each company in this portfolio has A-rated credit, and we’ve got some dividend-paying stalwarts on the list (including SWK which has paid dividends for over a century). She tossed in a couple of growth stocks with significant stock buyback programs (feel free to tie in my recent article on the possible benefits of growth stocks in a dividend growth portfolio). Based on the Seeking Alpha estimates for earnings and earnings growth, this portfolio could pay for itself entirely with corporate earnings per share within just over 8 years – meaningfully less time than the historical 13 year average for the broader markets. Getting free companies is like eating Halloween candy: sooner is almost always better.
But wait! That’s not all!
As an added bonus, according to Portfoliovisualizer.com, this ten-stock portfolio would have delivered an astonishing 21% annual income growth over the past ten years (thanks in no small measure to last year’s explosion of special dividends from ORI), compared to annual income growth of only 11% for the Vanguard Total Stock Market Index ETF (VTI) over the same period. Not bad for a portfolio where 20% of the holdings don’t even pay dividends.
Income growth (Portfolio Visualizer)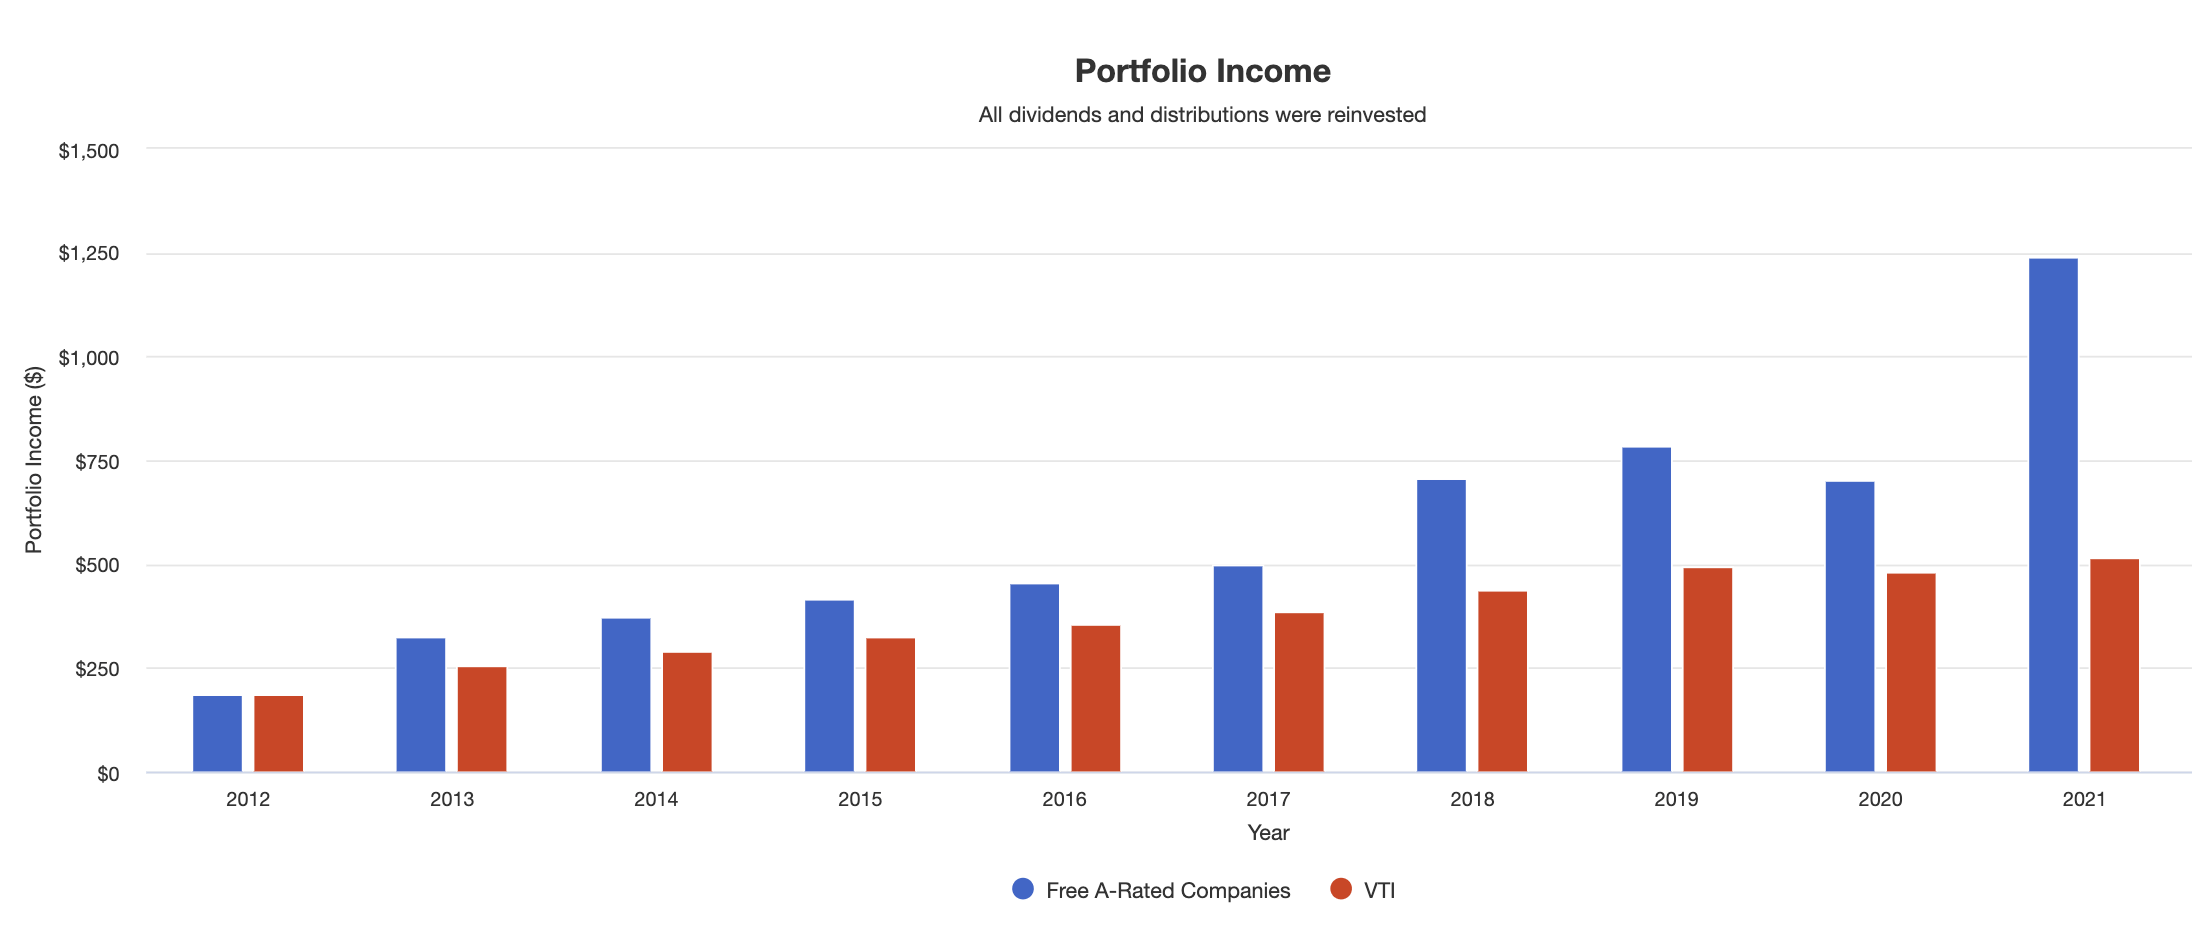
I suppose that rather than simply burying something in the disclaimer section that maybe not everyone will read, I need to say this to you explicitly. Would that I had any idea whatsoever about whether this portfolio will end up with the same explosive dividend growth it had in the past, whether the stocks will pay for themselves within 8 years, or whether the portfolio returns will exceed the average returns on the stock market or not. Were life so simple, we’d all be richer. My purpose is merely to illustrate one single methodology rather than pitch any specific investment(s) or suggest any one single investment approach. It shall be interesting for me to check back in with this hypothetical portfolio in a few years and see whether or not it actually does end up beating or trailing the market. Alas for all of us instant gratification types, we shall have to stay tuned to find out. As the old saying goes, “all good things come to those who wait” and sometimes we simply have no choice but to do so.
Be the first to comment