

A. O. Smith Stock Is A Buy For Long Term Oriented Investors JodiJacobson/E+ via Getty Images
A. O. Smith (NYSE:AOS) manufactures and markets water heaters, boilers, and various water treatment products to both commercial and residential customers. Revenues are primarily generated in the North American market which has accounted between 70.9% and 74.8% of net sales.
AOS Revenue by Segment Over Time (AOS SEC filings)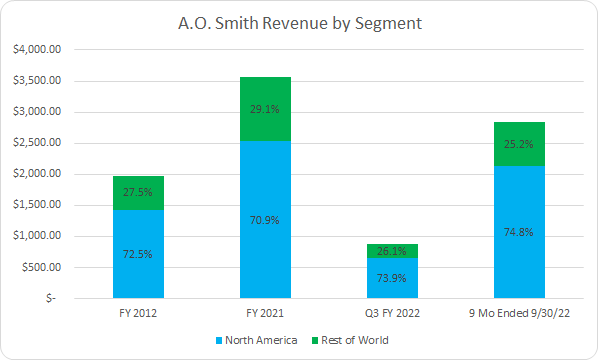
A. O. Smith’s Rest of World segment is primarily generating revenues in China, Europe and India.
Prior to 2016, A. O. Smith stuck with their core water heater and boiler business; however, during that year they expanded into the water treatment market with their acquisition of Aquasana. They’ve continued to expand in that arena with additional bolt-on acquisitions in 2017, 2019, and 2021.
A. O. Smith has utilized acquisitions as a means to continue to improve their competitive position in their core water heater business as well as expand in additional lines as mentioned above. Additionally, in 2021 A. O. Smith acquired Giant Factories which further strengthened their residential and commercial water heater offerings in Canada.
Unfortunately, A. O. Smith does not break out their revenues by product line across both the North America and Rest of World operating segments. However, they do offer additional clarity on product line sales in North America.
AOS North America Revenues by Product Line (AOS SEC filings)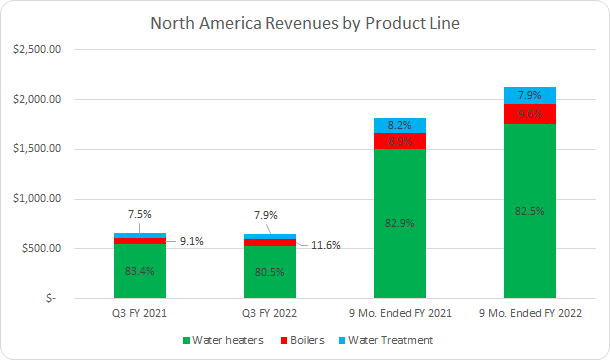
Additionally they offer only a limited region based break out of revenues for the Rest of World segment.
AOS Rest of World Revenue Breakout (AOS SEC filings)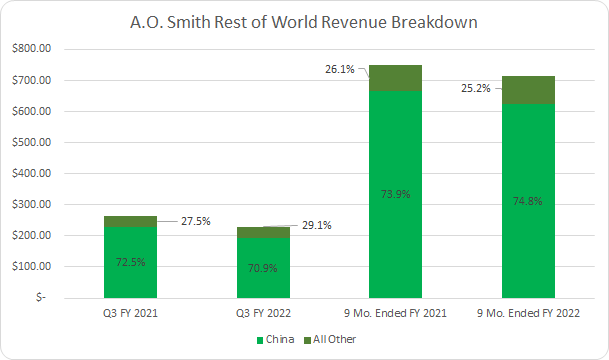
Executive officers at A. O. Smith nearly universally have extensive backgrounds with A. O. Smith. The officers on average have been with A. O. Smith since 2004 which ranges from a history beginning as far back as 1989 to as recent as 2020.
A. O. Smith’s products are such that customers largely can’t put off buying. Despite the supposed benefits of cold showers, I wanted the option for one not for that to be the only option so when our water heater went out several years back we had to get it replaced. The same goes for boilers and home heating as that’s not something I voluntarily want to go without.
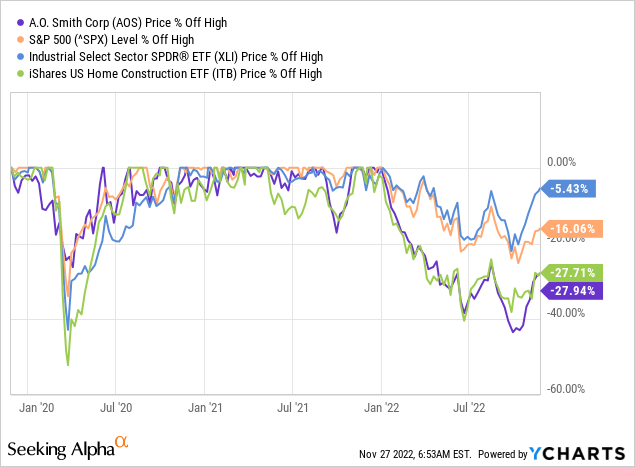
A. O. Smith’s share price is currently mired in a 28% pullback from its highs. That’s well below the S&P 500’s performance at a 16% drawdown and the industrial sector, via (XLI), and it’s 5% retreat. However, that’s in line with the Home Construction ETF (ITB).
A 28% drawdown, that around 1.5 months ago was a >40% drawdown, piques my interest for a strong company such as A. O. Smith.
Dividend History
When I first began investing in individual companies the dividend growth strategy is what most appealed to me. The strategy is simple: find good businesses with a history of paying and raising their dividends, buy them at attractive levels, and let the business do its thing.
A. O. Smith Dividend History (AOS Investor Relations)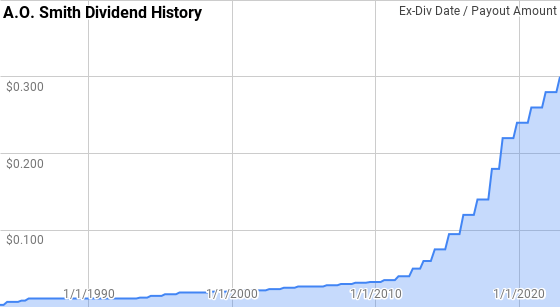
In mid-October they announced an increase in the quarterly dividend from $0.28 to $0.30 which was a solid 7.1% raise. A. O. Smith’s dividend growth streak is up to 30 years now which gives them the title of Dividend Champion according to the CCC list.
During A. O. Smith’s streak, year over year dividend growth has ranged from 2.9% to 35.7% with an average of 11.8% but a median of just 7.5%.
There’s been 25 rolling 5-year periods over that time with annualized dividend growth spanning from 3.4% to 27.0% with an average of 11.9% and a median of 7.6%.
Additionally, there’s been 20 rolling 10-year periods with A. O. Smith’s annualized dividend growth coming in between 4.1% to 21.9% with an average of 11.3% and a median of 8.3%.
The rolling 1-, 3-, 5-, and 10-year annualized dividend growth rates from A. O. Smith since 1984 can be found in the following table.
| Year | Annual Dividend | 1 Year | 3 Year | 5 Year | 10 Year |
| 1984 | $0.0228 | ||||
| 1985 | $0.0344 | 51.2% | |||
| 1986 | $0.0444 | 29.0% | |||
| 1987 | $0.0444 | 0.0% | 25.0% | ||
| 1988 | $0.0444 | 0.0% | 8.9% | ||
| 1989 | $0.0444 | 0.0% | 0.0% | 14.3% | |
| 1990 | $0.0444 | 0.0% | 0.0% | 5.2% | |
| 1991 | $0.0444 | 0.0% | 0.0% | 0.0% | |
| 1992 | $0.0444 | 0.0% | 0.0% | 0.0% | |
| 1993 | $0.0467 | 5.0% | 1.6% | 1.0% | |
| 1994 | $0.0556 | 19.0% | 7.7% | 4.6% | 9.3% |
| 1995 | $0.0644 | 16.0% | 13.2% | 7.7% | 6.5% |
| 1996 | $0.0733 | 13.8% | 16.3% | 10.5% | 5.1% |
| 1997 | $0.0756 | 3.0% | 10.8% | 11.2% | 5.4% |
| 1998 | $0.0778 | 2.9% | 6.5% | 10.8% | 5.8% |
| 1999 | $0.0800 | 2.9% | 2.9% | 7.6% | 6.1% |
| 2000 | $0.0833 | 4.2% | 3.3% | 5.3% | 6.5% |
| 2001 | $0.0867 | 4.0% | 3.7% | 3.4% | 6.9% |
| 2002 | $0.0900 | 3.8% | 4.0% | 3.6% | 7.3% |
| 2003 | $0.0967 | 7.4% | 5.1% | 4.4% | 7.6% |
| 2004 | $0.1033 | 6.9% | 6.0% | 5.3% | 6.4% |
| 2005 | $0.1067 | 3.2% | 5.8% | 5.1% | 5.2% |
| 2006 | $0.1100 | 3.1% | 4.4% | 4.9% | 4.1% |
| 2007 | $0.1167 | 6.1% | 4.1% | 5.3% | 4.4% |
| 2008 | $0.1233 | 5.7% | 5.0% | 5.0% | 4.7% |
| 2009 | $0.1283 | 4.1% | 5.3% | 4.4% | 4.8% |
| 2010 | $0.1350 | 5.2% | 5.0% | 4.8% | 4.9% |
| 2011 | $0.1500 | 11.1% | 6.7% | 6.4% | 5.6% |
| 2012 | $0.1800 | 20.0% | 11.9% | 9.1% | 7.2% |
| 2013 | $0.2300 | 27.8% | 19.4% | 13.3% | 9.1% |
| 2014 | $0.3000 | 30.4% | 26.0% | 18.5% | 11.2% |
| 2015 | $0.3800 | 26.7% | 28.3% | 23.0% | 13.5% |
| 2016 | $0.4800 | 26.3% | 27.8% | 26.2% | 15.9% |
| 2017 | $0.5600 | 16.7% | 23.1% | 25.5% | 17.0% |
| 2018 | $0.7600 | 35.7% | 26.0% | 27.0% | 19.9% |
| 2019 | $0.9000 | 18.4% | 23.3% | 24.6% | 21.5% |
| 2020 | $0.9800 | 8.9% | 20.5% | 20.9% | 21.9% |
| 2021 | $1.0600 | 8.2% | 11.7% | 17.2% | 21.6% |
| 2022 | $1.1400 | 7.5% | 8.2% | 15.3% | 20.3% |
Source: Author; Data Source: A. O. Smith Investor Relations
For dividend growth investors the dividend payout ratio is a widely used metric to determine the safety and sustainability of the dividend. The payout ratio ratio, whether based on net income or free cash flow, let’s you know how much cushion there is before the dividend is potentially at risk. Additionally, in conjunction with the dividend growth rates you can see if the dividend has been growing faster or slower than the underlying business over time.
AOS Dividend Payout Ratios (AOS SEC filings)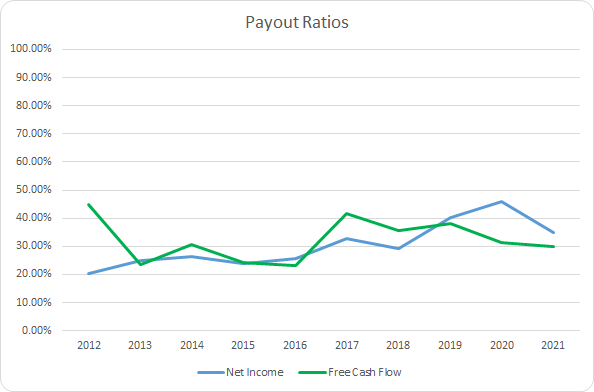
A. O. Smith has delivered very strong dividend growth over the last decade and best of all the payout ratio is up only modestly suggesting most of the growth has been supported by growth of the business. The 10-year average net income payout ratio is 30.5% with the 5-year average at 36.7%. Meanwhile, A. O. Smith’s average free cash flow payout ratios are 32.3%, and 35.4%, respectively.
Quantitative Quality
My aim is to invest in businesses that I don’t have to worry about the next quarter or next year’s results. That means I’m searching for quality businesses that have a strong competitive positioning and that I believe will continue to execute over time.
AOS Revenue Profits and Cash Flow (AOS SEC filings)
A. O. Smith has managed to grow revenues by 82.5% over the last decade or 6.9% annualized. It’s encouraging to see the consistency in A. O. Smith’s top line growth although FY 2019 and 2020 both showed year over year declines. Fiscal 2019 saw a huge drop due to weak demand in China coupled with FX issues and of course we all know what happened in 2020 due to the pandemic. However, considering the extreme disruption in 2020 it’s a strong sign that sales were only down 3.3% compared to 2019. Revenues rebounded strongly in 2021 with a 22.2% increase versus 2021.
Meanwhile, operating profits rose by 192.0% over the last decade or 12.6% annualized suggesting a fair amount of operational leverage. Operating cash flow improved by 345.8% or 18.1% annualized. That strong improvement in cash generation led to free cash flow increasing by 665.9% or 25.4% annualized.
Good businesses should be able to defend their margins against competition. Even better is when margins can rise over time as the business asserts its dominance. I typically look for free cash flow margins greater than 10%; although, the trend over time carries more weight in the analysis.
AOS Margins (AOS SEC filings)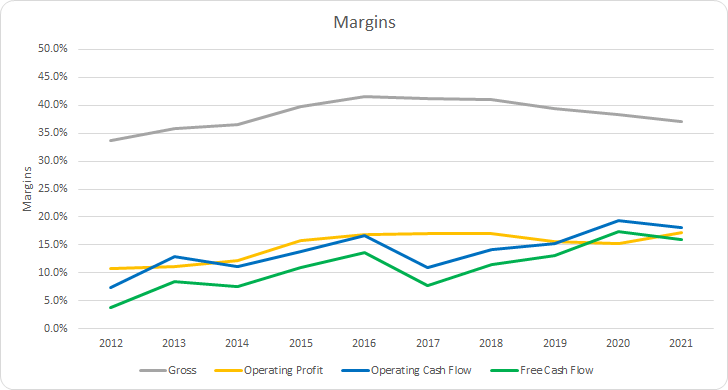
A. O. Smith’s gross margins have been retreating since peaking in 2016; however, for the most part they have been stable with a 10-year average of 38.4% and a 5-year average of 39.4%.
Meanwhile, A. O. Smith’s free cash flow margins have dramatically improved during that same time as expected with the substantially faster free cash flow growth compared to revenue growth. A. O. Smith’s 10-year free cash flow margin is 11.0% with the 5-year average at 13.1%.
Additionally, I want to see how well the business can generate cash flow compared to its asset or capital base. My preferred metric is the free cash flow return on invested capital, FCF ROIC, and similar to the margins I want to see stable or rising levels over time that are routinely greater than 10%.
AOS Free Cash Flow Returns (AOS SEC filings)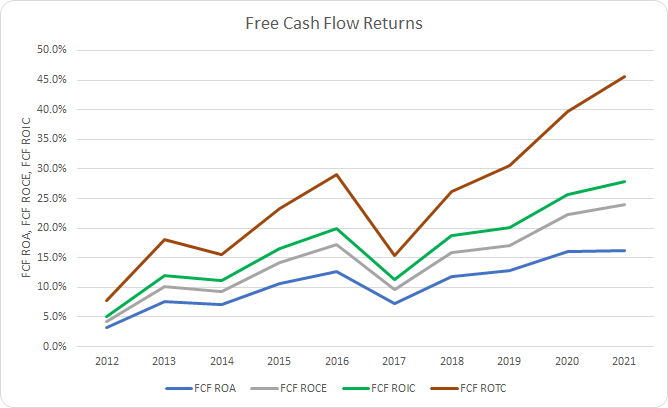
The stellar increase in free cash flow over the last decade has come in conjunction with better returns. The 10-year average FCF ROIC is 16.8% with the 5-year average at 20.8%. A. O. Smith’s FCF ROA has even managed a 10-year average of 10.5% and a 5-year average of 12.8%.
To understand how A. O. Smith uses its free cash flow, I calculate three variations of the metric, defined below:
- Free Cash Flow, FCF: Operating cash flow less capital expenditures
- Free Cash Flow after Dividend, FCFaD: FCF less total cash dividend payments
- Free Cash Flow after Dividend and Buybacks, FCFaDB: FCFaD less net cash used on share repurchase activity
AOS Free Cash Flows (AOS SEC filings)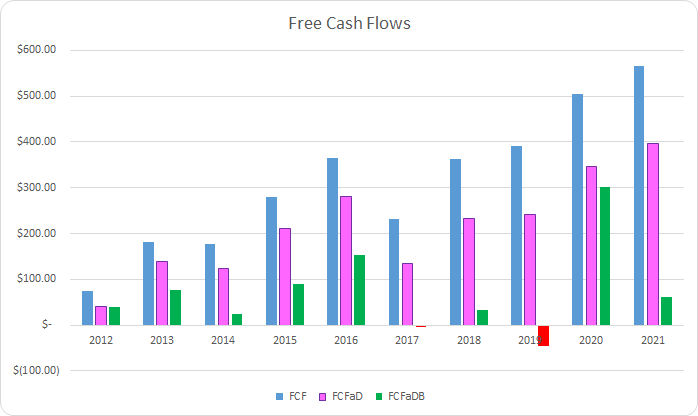
Between FY 2012 and FY 2021 A. O. Smith generated a total of $3.14 B in FCF through operations. They have also paid and raised their dividend to owners each year sending out a total of $0.99 B. That brings the cumulative FCFaD for the previous 10 years to $2.15 B.
Additionally, A. O. Smith has used a net total of $1.42 B on share repurchases. That puts the cumulative FCFaDB over that time at $0.73 B.
Comparing the cumulative cash spent on share repurchases versus dividends and we see that A. O. Smith has preferred buybacks to dividends, although the dividend has been much more consistent. During the last decade A. O. Smith has paid around $0.69 in dividends for every net $1.00 used on share repurchases.
AOS Shares Outstanding (AOS SEC filings)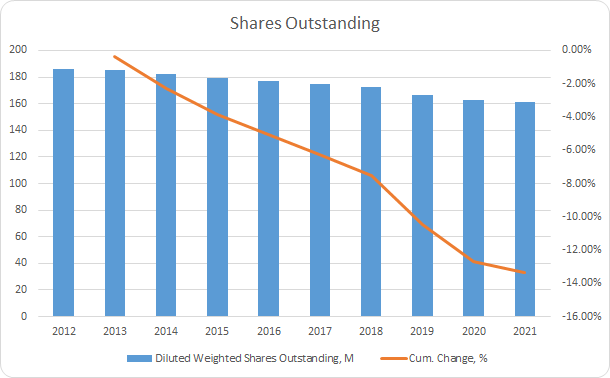
A. O. Smith’s share count has been consistently falling showing a decline in every year over year period over the last decade. In total the share count declined by 13.4% or ~1.6% annually.
Whenever I’m looking at potential investment candidates my aim is always to invest for the intermediate term with a goal of that turning into the very long term as long as the business justifies it. As such the balance sheet becomes a critical factor in that decision.
AOS Debt to Capitalization (AOS SEC filings)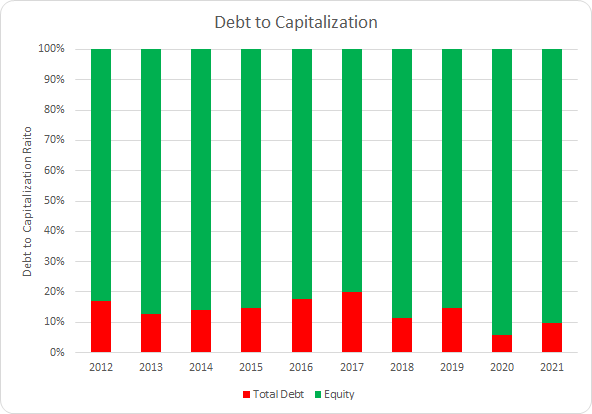
In terms of capital structure A. O. Smith is quite conservatively capitalized. I want to see stable debt-to-capitalization ratios over time and A. O. Smith has certainly satisfied that requirement. The 10-year average debt-to-capitalization ratio is 14% with the 5-year average at 12%.
The net debt ratios paint a better picture of the burden the debt load places on the profits or cash flows of the business. In essence the net debt ratios let you know how quickly the business could de-lever if need be assuming no permanent impairment to the business.
AOS Debt Ratios (AOS Debt Ratios)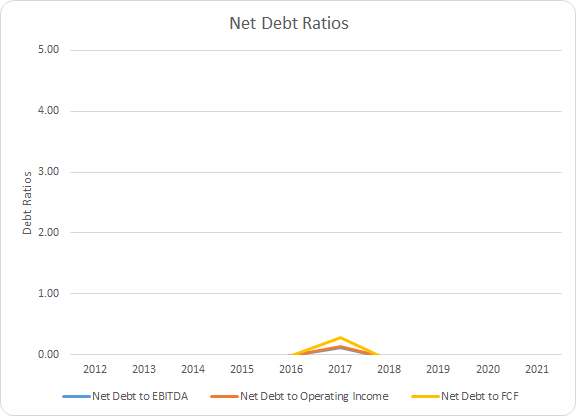
Considering the rise in interest rates this year due to inflation, and the potential for higher rates to stick around longer, A. O. Smith is in an enviable position. A. O. Smith has carried a net cash position, more cash than total debt on the balance sheet, in all but one year over the last decade.
How Did We Get Here?
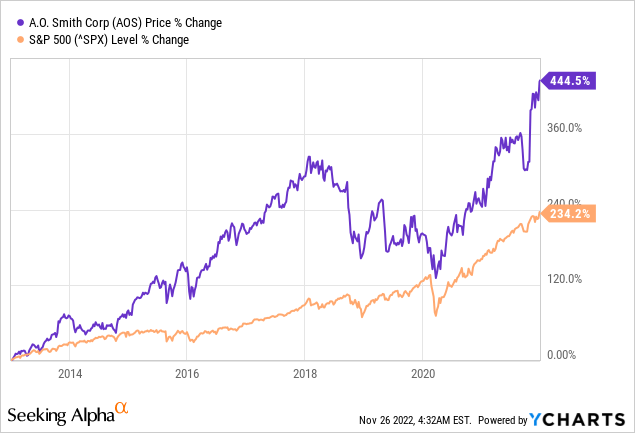
From December 31, 2012 through December 31, 2021 A. O. Smith’s share price rose from $15.77 all the way up to $85.85. That’s an incredibly impressive 444.5% increase or 18.5% CAGR. Add to that the initial 1.1% dividend yield and A. O. Smith delivered annualized returns on 19.6%.
A. O. Smith has handily outperformed the S&P 500 and it hasn’t been close despite very solid results from the latter. The S&P 500 increased a strong 234.2% or 14.3% annualized over that same time.
Benjamin Graham famously quipped that over the short term the stock market is a voting machine and the long run it’s a weighing machine. Over longer periods of time the markets will get the business value approximately right as the business shows its true colors.
I broken down the returns that A. O. Smith has delivered during that time into various components that roughly approximate the source of returns.
- Business Returns: measured as annualized change in revenues plus annualized change in net profit margin
- Capital Allocation Returns: measured as initial dividend yield plus the annualized change in outstanding shares
- Sentiment Change Returns: measured as the annualized change in beginning and ending multiples
A. O. Smith grew revenues by 82.5% over that period which accounted for a +6.8% contribution to the CAGR. Net profit margin increased from 8.4% to 13.8% which is good for a 64.2% total increase and +5.6% contribution. Combined the business returns attribution totals to +12.4%.
A. O. Smith reduced their shares outstanding each year over that time amounting to a total decrease of 13.4%. That puts the contribution to the CAGR around +1.6% which combined with the initial dividend yield of 1.1% puts the capital allocation return attribution at +2.7%.
A. O. Smith saw a hefty dose of multiple expansion over that time with the P/E multiple rising from 18.1x to 28.4x. That’s a total increase of 57.4% and amounts to a sentiment change attribution of +4.6%.
| Annualized Returns | % of Returns | |
| Business Returns | 12.4% | 63% |
| Capital Allocation Returns | 2.7% | 14% |
| Sentiment Change | 4.6% | 23% |
| Total Annualized Returns | 19.6% |
Source: Author
Looking ahead A. O. Smith appears much more attractive on the surface compared to at the end of 2021 on a multiple basis. Due in large part to the pullback that the markets and A. O. Smith have suffered this year, the P/E is much more palatable at 19.7x on a TTM basis, 20.0x on FY 2022 estimates, and 19.3x on FY 2023 estimates. I believe it’d be fair assume that sentiment change isn’t likely to be a significant contribution either up or down.
The dividend yield is significantly more attractive around a 1.8% level. Buybacks are likely to be a net positive contribution. Using the average of the last 3 years of FCFaD as well as the TTM period, A. O. Smith could repurchase ~3.2% of outstanding shares annually based on the current market cap of $9.4 B.
Business returns should be the leading source of returns once again assuming that A. O. Smith continues to execute. While I would expect A. O. Smith to be able to improve their profit margins over the ensuing decade, I’d hesitate to assume a magnitude resembling the prior decade’s performance.
AOS Return Breakdown (Author)
Assuming A. O. Smith can achieve 3% to 6% annual sales growth and that margins see a continued improvement ranging from 15% to 40% which brings the ending net profit margin to 15.8% to 19.3% that leads to a +1.6% to +3.8% contribution to returns.
Given A. O. Smith’s history of share repurchases I would expect annualized buybacks between roughly 1.0% to 3.0%.
Combined that puts the forward CAGR, ex-sentiment change, between 7.4% and 14.7% inclusive of the dividend. Adjust those numbers as you see fit.
Valuation
Identifying a good business is only part of the puzzle with investing. The other component is to purchase a stake at attractive valuations such that you reap the rewards of the business’ future growth and potentially benefit from margin expansion as well. I employ three valuation methods that attempt to value a business through different viewpoints in order to determine attractive purchase levels.
Dividend yield theory is a valuation methodology that centers around reversion to the mean. It operates on the assumption that over time investors, collectively, will value a business such that it offers a normal dividend yield. For A. O. Smith I’ll use the 3-year average forward dividend yield as a proxy for fair value.
AO Smith Dividend Yield Theory (Author)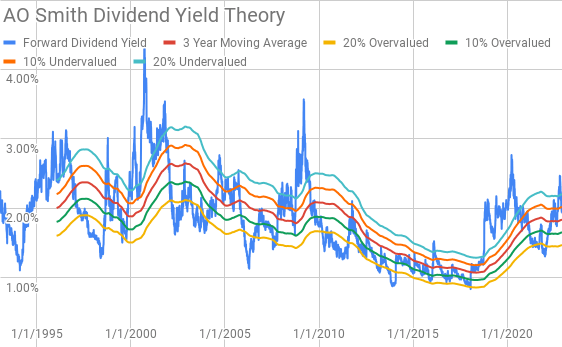
A. O. Smith currently offers a forward dividend yield of 1.94% with the 3-year average at 1.83%.
Investing is about finding discrepancies between what the underlying business will achieve versus what the business is valued at in the market. We can use a discounted cash flow analysis to find out what kind of expectations are built into the current market valuation.
I use a simplified DCF model based on revenue growth and an initial free cash flow margin of 10.4% that improves to 20% during the forecast period. The terminal growth rate is estimated at 2.5%.
For the discount rate I’ve assumed an after-tax cost of debt estimate of 2.8% with a 10% and 8% cost of equity. That yields a discount rate of 9.9% and 7.9%, respectively. Additionally I’ve used the dividend capitalization method for the cost of equity based on a 7% dividend growth rate the dividend capitalization cost of equity is 8.9% with a discount rate of 8.8%.
The required revenue growth rate for A. O. Smith comes to just 5.2% annually with the stated FCF margin profile in order for investors to earn a 10% return. With the lower 7.9% discount rate / 8.0% return target, required revenue growth drops to just 0.3% annually for the forecast period. Additionally, with the dividend capitalization discount rate of 8.8%, A. O. Smith’s required revenue growth comes to just 2.7%.
A MARR analysis entails estimating the future earnings and dividends that a business will generate over a given period of time. You then apply a reasonable, and hopefully conservative, terminal multiple in order to find an estimate of the future share price. If the expected returns are greater than your hurdle rate for investment then you can proceed with purchasing a stake in said business.
Currently analysts expect A. O. Smith to report FY 2022 EPS of $3.09 and FY 2022 EPS of $3.21. They also expect A. O. Smith to show 8.0% annual EPS growth over the following 5 years. After that I assumed that A. O. Smith would be able to manage 4.0% annual EPS growth for the following 5 years. Dividends are assumed to target a 37% payout ratio.
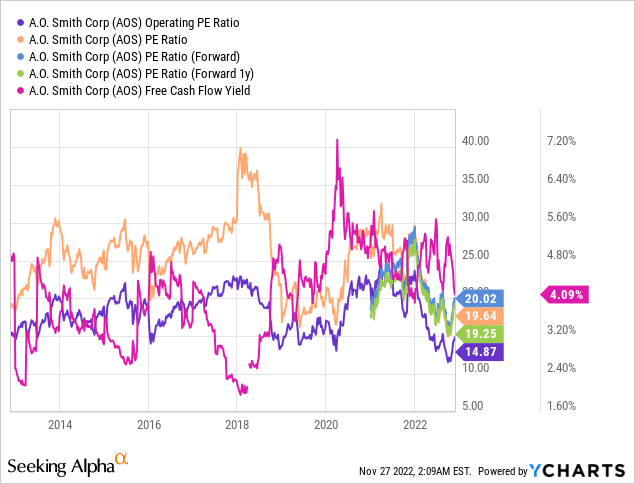
The following YCharts shows how investors have valued A. O. Smith across a variety of metric over the preceding decade. A. O. Smith has typically been valued between ~15x and ~30x TTM earnings over that time.
The following table shows the potential internal rates of return that A. O. Smith investors could earn provided the assumptions laid out above prove to be reasonable estimates of how the future plays out. Returns assume shares are purchased at $61.86, Friday’s closing price. Dividends are assumed to be taken in cash and that A. O. Smith will continue to pay and raise dividends following the schedule they have historically followed.
| IRR | ||
| P/E Level | 5 Year | 10 Year |
| 30 | 16.8% | 11.2% |
| 25 | 12.9% | 9.4% |
| 22.5 | 10.6% | 8.3% |
| 20 | 8.2% | 7.2% |
| 17.5 | 5.6% | 5.9% |
| 15 | 2.6% | 4.5% |
Source: Author
Additionally, I use the MARR analysis outline to work backwards and to determine the maximum price I could pay for shares today in order to generate the returns that I desire from my investments. My base hurdle rate is a 10% IRR and for A. O. Smith I’ll also examine 12% and 8% return thresholds.
| Purchase Price Targets | ||||||
| 10% Return Target | 12% Return Target | 8% Return Target | ||||
| P/E Level | 5 Year | 10 Year | 5 Year | 10 Year | 5 Year | 10 Year |
| 30 | $84 | $70 | $78 | $59 | $92 | $82 |
| 25 | $71 | $60 | $65 | $51 | $78 | $70 |
| 22.5 | $65 | $55 | $59 | $47 | $71 | $64 |
| 20 | $58 | $50 | $53 | $42 | $63 | $58 |
| 17.5 | $52 | $45 | $47 | $38 | $56 | $52 |
| 15 | $45 | $40 | $41 | $34 | $49 | $47 |
Source: Author
Conclusion
A. O. Smith has proven itself over time with a dominant position in the water heater and boiler arena. Growth has been solid for them over the prior decade through both organic growth as well as acquisitions with sales climbing 6.9% annualized over that time. Even more impressive is that profit and cash flow margins have expanded significantly with the strong growth suggesting a fair amount of operational leverage.
Dividend yield theory suggests a fair value range for A. O. Smith between $60 and $73 implying that shares are trading on the lower end of fair value currently.
Meanwhile the reverse DCF tells us that expectations for A. O. Smith’s future growth are quite reasonable. In order for investors to earn 10% returns the required revenue growth rate is quite modest at 5.2% annually over the forecast period given that assumed margin profile. With an 8% return target A. O. Smith needs to just barely eek out 0.3% annual revenue growth with the margin improvement doing the heavy lifting to create value for investors.
One point that I want to stress is that the reverse DCF model does not account for the likely continued share repurchases. Over the last decade buybacks added ~1.6% to annualized per share returns. Based on the average of the last 3 fiscal years and the TTM period FCFaD A. O. Smith could repurchase around 3.2% of outstanding shares based on the current $9.4 B market cap.
The MARR analysis paints a picture roughly in line with the other two models. Based on a 10% IRR target through the end of FY 2027 and a terminal multiple between 17.5x and 22.5x, A. O. Smith’s fair value range is between $52 and $65. At a 12% return target that declines to $47 to $59; however, with an 8% return target the fair value range rises to between $56 to $71.
Based on information regarding insider transactions, there’s only been 1 purchase of shares over the last 2 years totaling $274k with 58 different sales amounting to $46.8 M. While that’s not exactly a red flag, it does suggest that insiders don’t believe A. O. Smith has been a screaming buy over that period.
One of the most attractive aspects of A. O. Smith is their balance sheet strength. As of the end of Q3 they maintained a net cash position as they have in all but one fiscal year over the prior decade.
That strong balance sheet should allow A. O. Smith to weather any potential economic storms as well as provide the optionality to continue to pursue further M&A activity.
Of the three valuation models one suggests shares are on the lower end of fair value, one implies that shares are attractively valued, and one suggests that shares are right around fair value. In my opinion that’s appears to be a reasonable assumption for A. O. Smith at current levels and suggests that A. O. Smith is a potential investment candidate.
Further geographical expansion appears to be the logical place for growth avenues as the Rest of World segment only represents around 25% of A. O. Smith’s revenues.
Additionally, Danaher’s (DHR) upcoming spinoff, EAS, could be an interesting M&A target once the spinoff is completed in 4Q 2023. It would be a much larger M&A prospect than what A. O. Smith normally undertakes as the spinoff segment had FY 2021 sales of $4.7 B. Given the size of that particular M&A opportunity I’d be hesitant to expect it; although, it appears to be a potential opportunity to significantly improve and expand the water quality and treatment portions of A. O. Smith’s current offerings. This is purely speculation at this point; however, A. O. Smith is looking to continue to expand their water treatment/quality platforms.
Current headwinds due to housing fears in the North American market given the rising housing prices as well as rising interest rates. While that’s a concern and is likely to hinder new home construction as well as sales of existing builds, A. O. Smith should be somewhat insulated from that shock. Water heaters and boilers don’t choose when to go out for when it’s convenient for you. A. O. Smith estimates that roughly 80-85% of water heater and boiler demand is for replacements.
AOS Water Heater Replacement Demand (AOS Investor Presentation Summer 2022)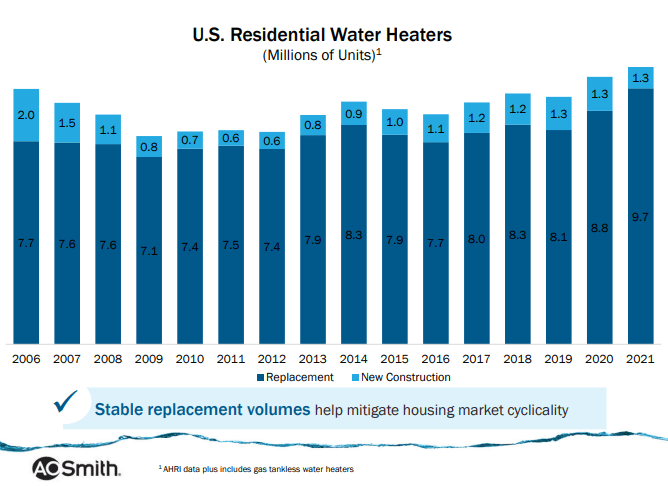
A. O. Smith has a strong operational history and dominant position especially in the North American market. The current valuation appears to be within the range of fair value although as recently as mid-October shares were arguably very cheap. Luckily I did add to my position at that time; however, not with nearly enough capital. Given my current stake in A. O. Smith I’ll be targeting a more attractive entry point at which to pick up additional shares likely in the $50-55 range although I do believe that A. O. Smith is attractive at current levels.
Be the first to comment