

Khosrork
Yesterday, I took a quick look back at the monetary aggregates, something that I had neglected during all the turmoil taking place in money and finance over the past three years or so.
I must admit, not much attention is paid to the monetary aggregates these days. The times have changed. Economists have adopted new foci. I, too, am guilty of this neglect.
Let’s take a look at the performance of the M2 money stock over the past few years.
M2 Money Stock (Federal Reserve)
We can see the results of how the Federal Reserve reacted to the spread of the Covid-19 pandemic with the big jump in the M2 money stock in early 2020.
We can see how the M2 money stock grew steadily as the Federal Reserve adopted a policy of quantitative easing from March 2020 through December 2022.
But, how does this knowledge transfer into how the M2 money stock actually grew during these years?
Well, here are the numbers:
2019 6.7 percent, December over December growth rate;
2020 24.9 percent, December over December growth rate;
2021 12.5 percent, December over December growth rate;
2022 4.1 percent, August over August growth rate.
One could argue that the Federal Reserve’s efforts to “fight inflation” has had some impact on monetary growth in 2022, but, the 4.1 per growth rate is still a generous rate of growth.
The Fed’s actions are going to have to carry through much further before we see any “pain” in the economy.
The M2 money stock peaked in March 2022, the month that the Fed really began its current monetary effort, but in August 2022, the M2 money stock is only modestly below the March figure.
In other words, if the Federal Reserve is tightening up, it still has a long way to go.
The New Environment
What has changed very dramatically is the use of the money stock.
In the past, the use of the money stock has been measured by the turnover of the money stock. Here we get a picture of the velocity of the M2 money stock in recent years.
Velocity of M2 Money Stock (Federal Reserve)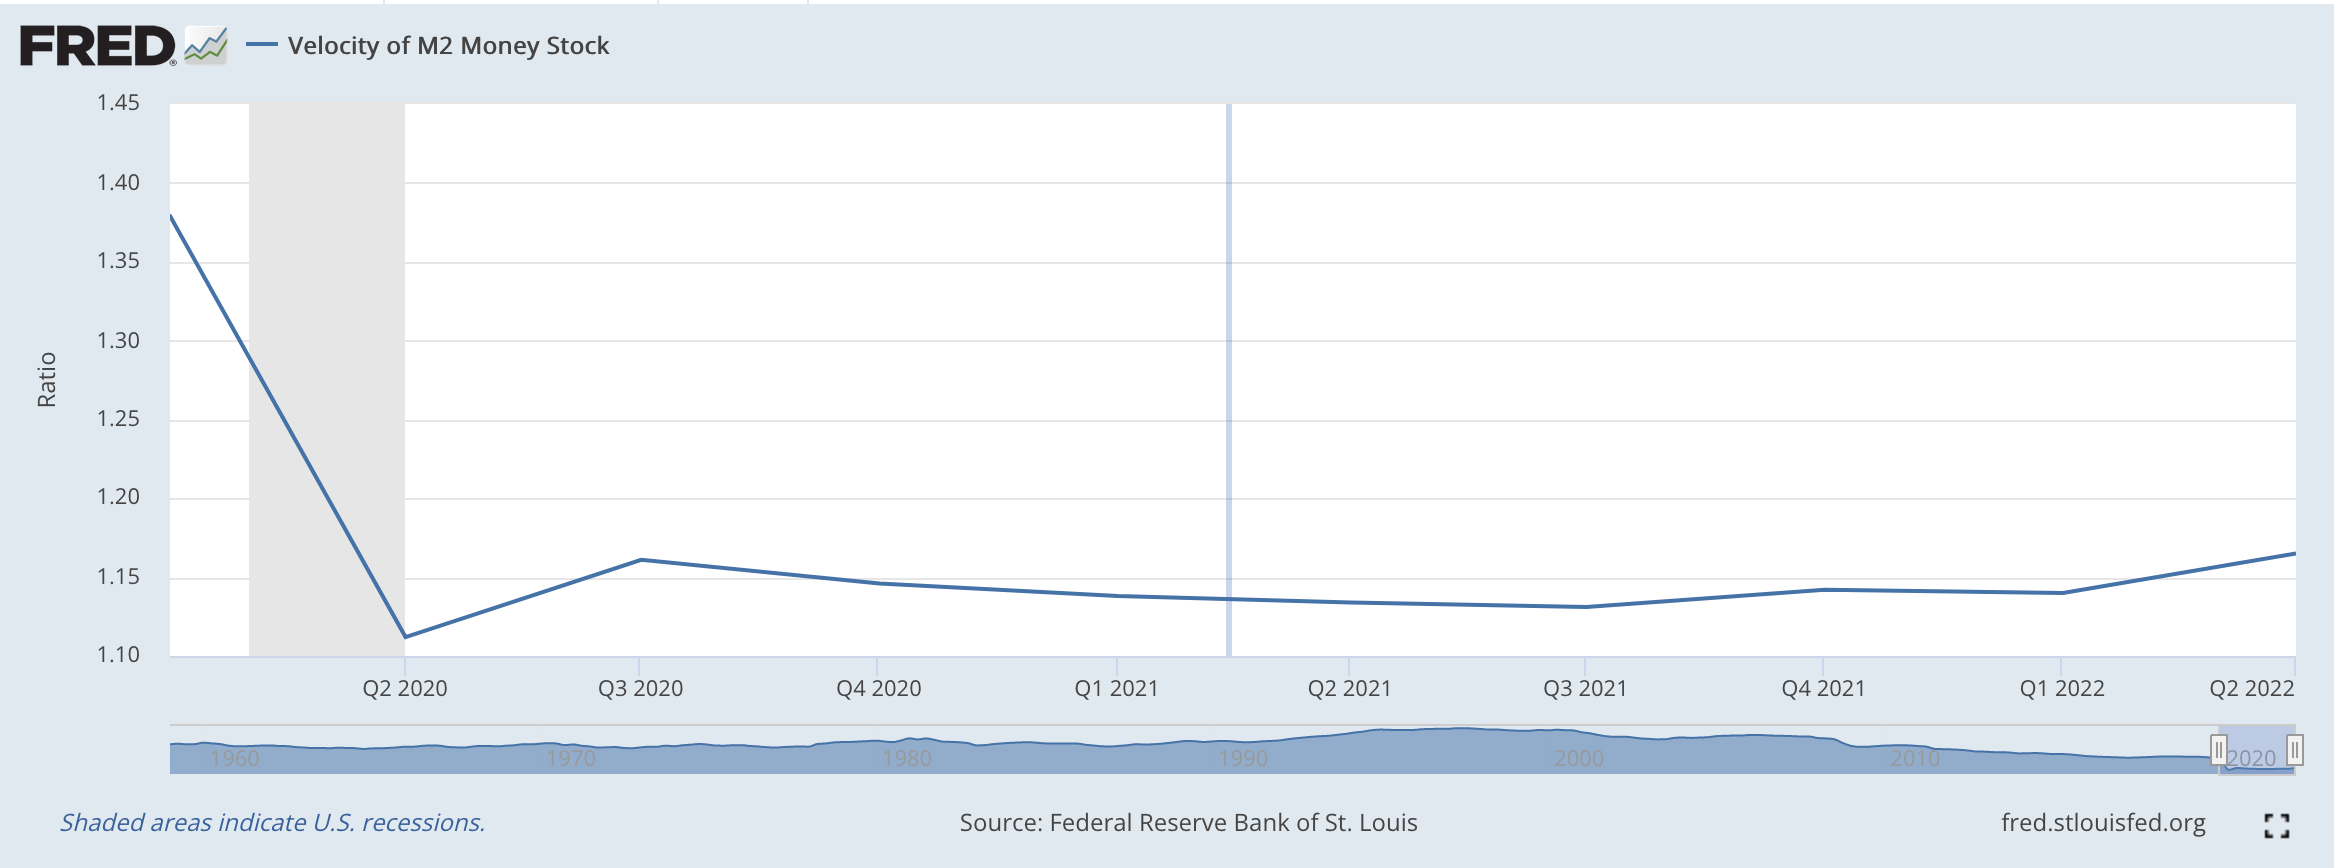
Note that before the appearance of the Covid 19 pandemic, a dollar was “turned over” about 1.40 times per year.
This velocity dropped to around 1.10 times per year in early 2020, and now currently remains about 1.15 times per year.
In essence, with all the money being pumped into the economy, people ceased to spend as intensely as they did before the arrival of the virus.
Or, we could say that some of the people did not use the injection of money for spending on consumer goods or businesses did not use the injection to purchase real investment in capital goods.
Consequently, we did not immediately get a rise in consumer prices connected with the Fed’s injection of money into the economy.
Consumer Price Index (Federal Reserve)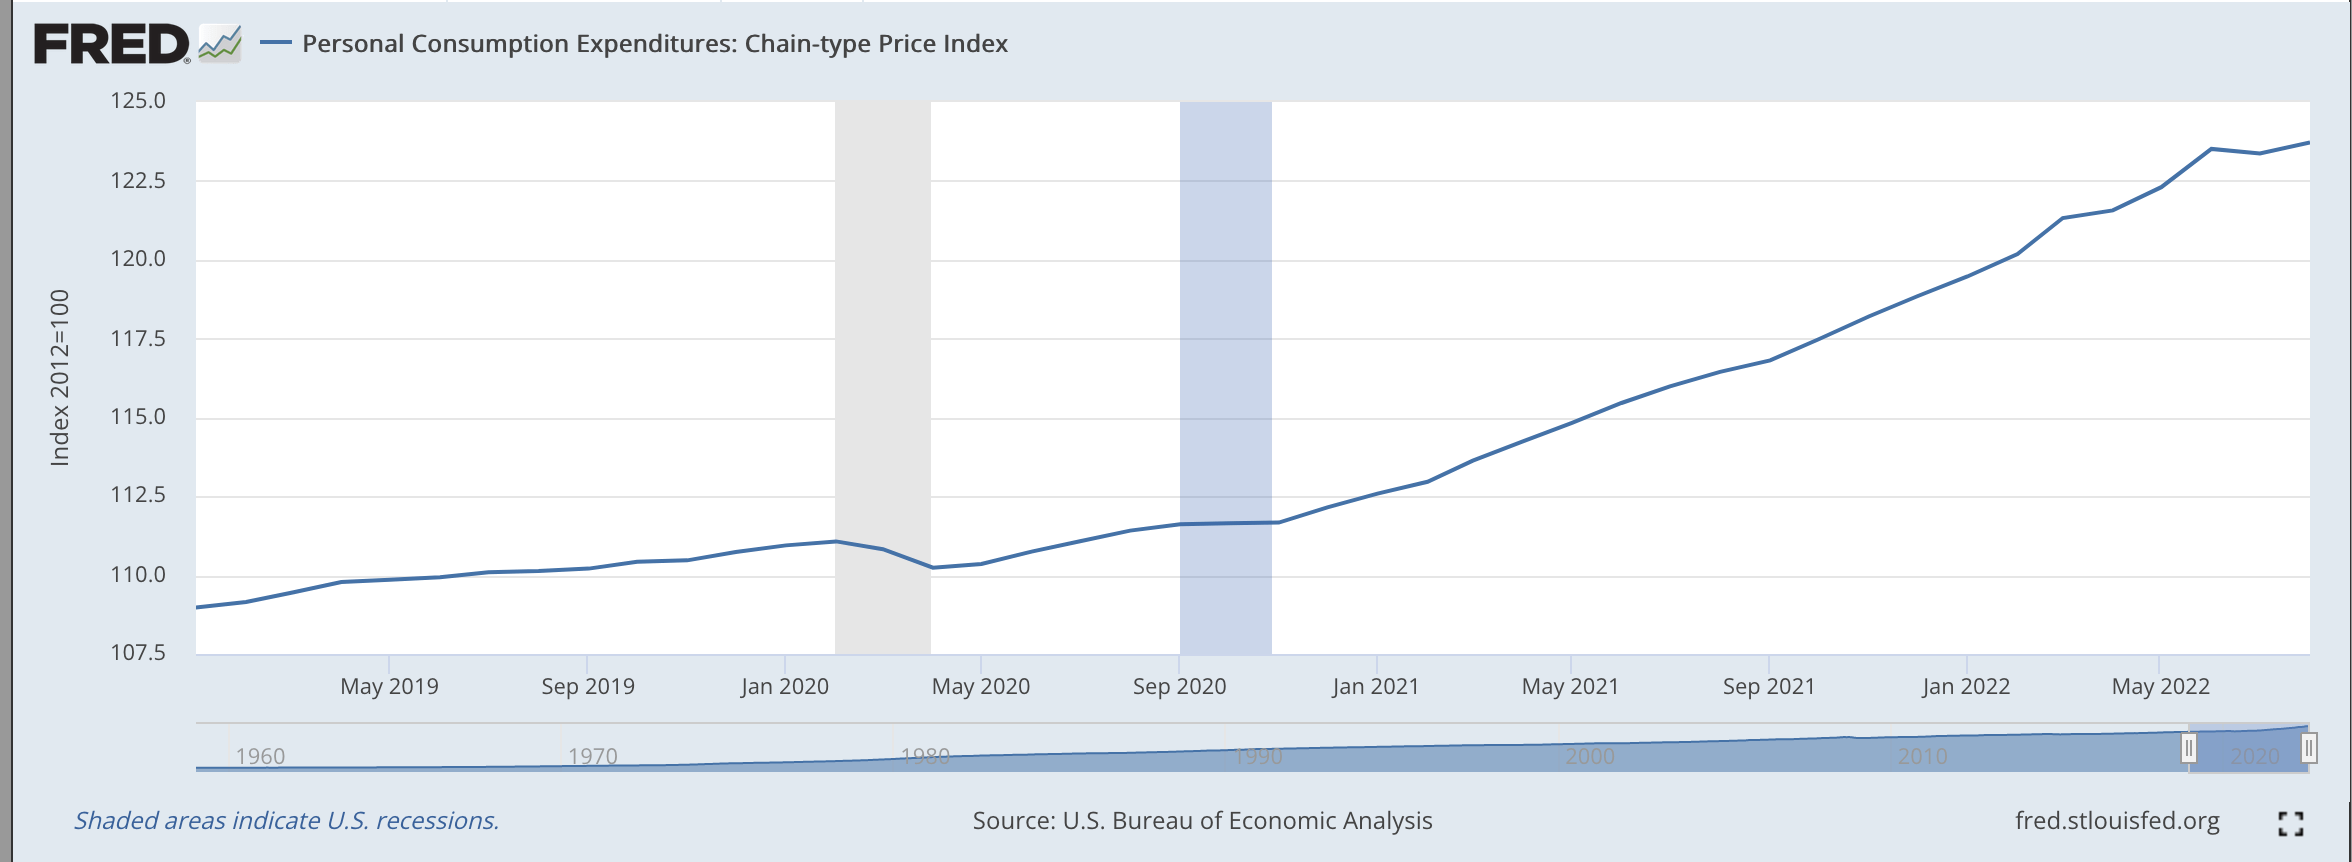
Consumer prices only seemed to “take off” later in 2021.
The Federal Reserve, under the leadership of Jerome Powell, did notice the early, faster upward movement in the CPI, but attributed this to “transition” effects that would quickly evaporate.
By the end of 2021, the Fed had committed itself to take a more aggressive stance in combating inflation and the full program was finally put into place in the middle of March 2022.
But, consumer prices came in at a year-over-year rate of 8.2 percent in September.
Consumer price inflation was not now “backing off.”
The money the Federal Reserve injected into the economy did go into some prices…stock prices for example.
During the time period under review, the S&P 500 Stock Index regularly hit new historical highs.
S&P 500 Stock Index (Federal Reserve)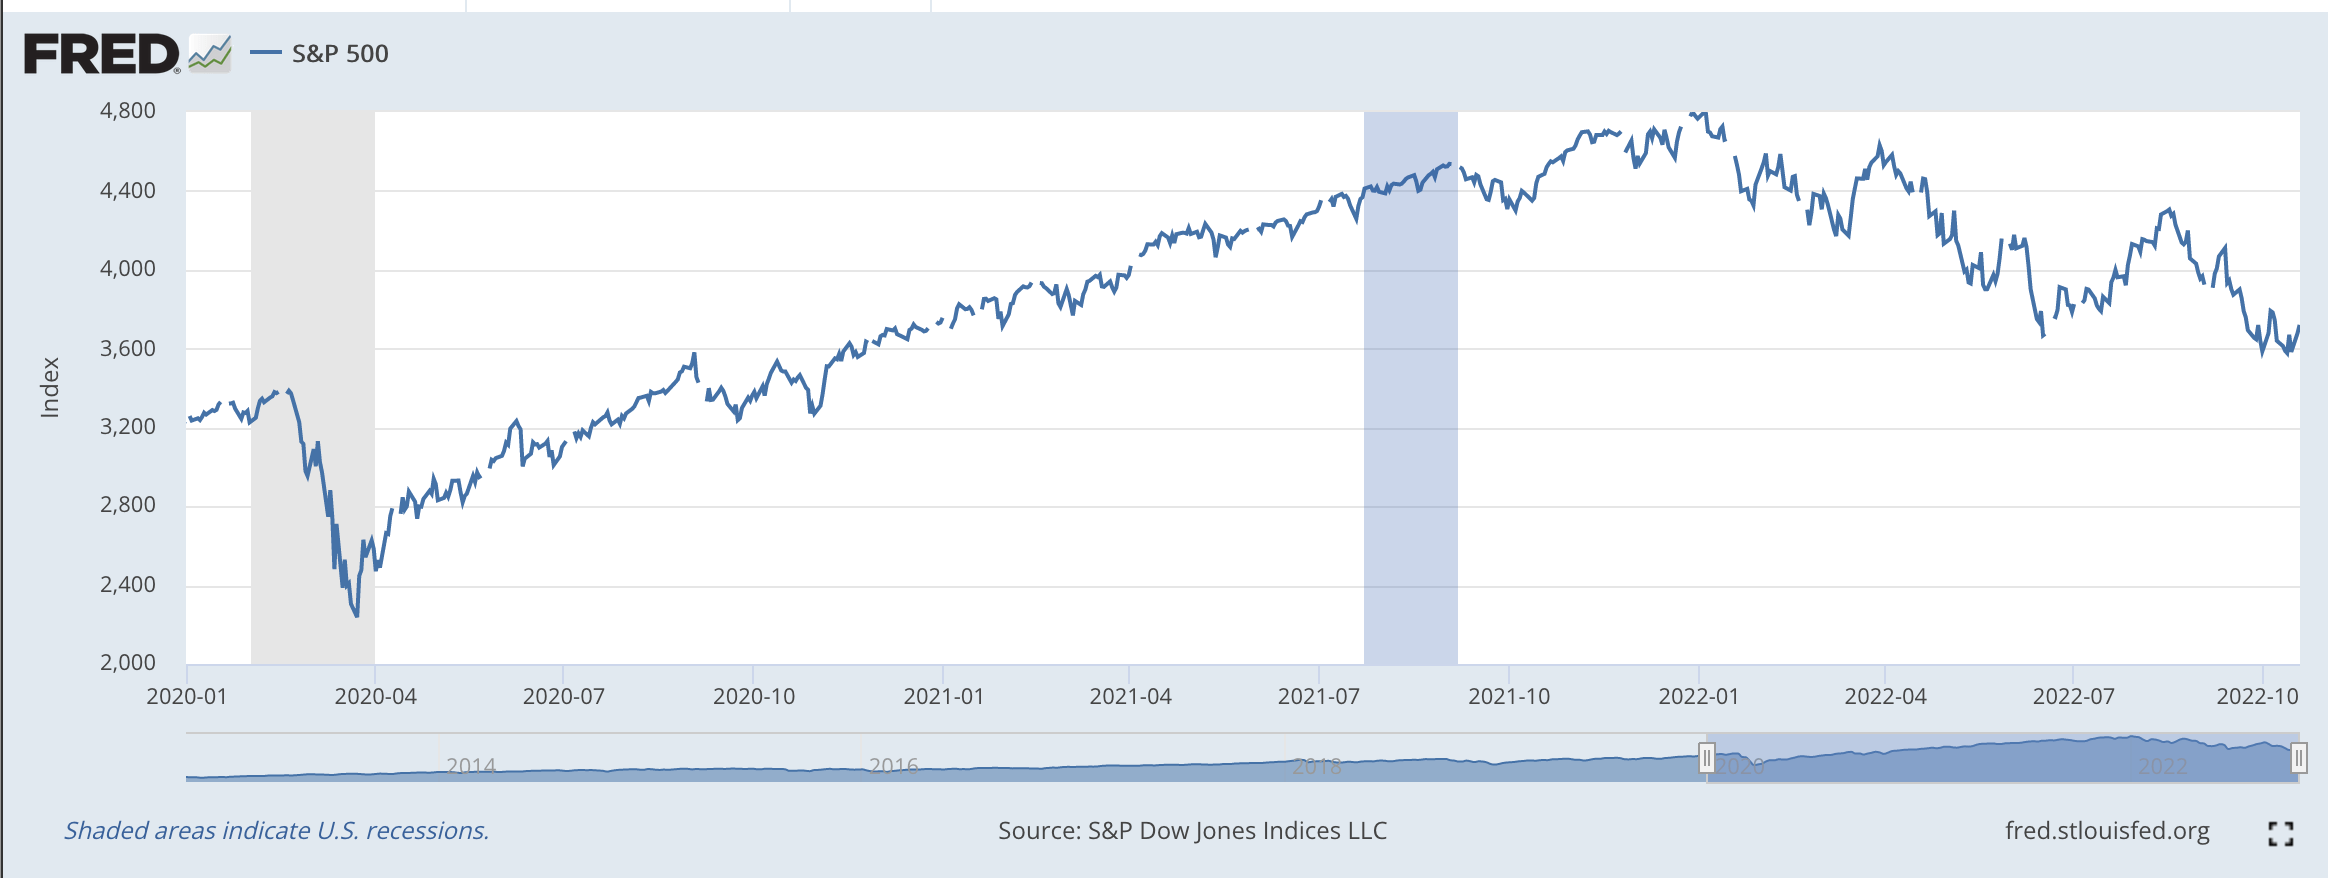
Note that the index began to move in an upwards direction beginning in March 2020, the month that the Federal Reserve began its quantitative easy program.
The index traveled steadily upwards through 2021 until it reached its last “new” historical high on January 3, 2022.
Prices were increasing at a rapid pace during the pandemic period, but they were not consumer prices. They were asset prices…stock prices, housing prices, and commodity prices.
But, these prices were “good” prices because they made people wealthy, especially investment-sophisticated wealthy people. Again, the income-wealth distribution moved in favor of those that were better off.
Something Has Happened
But, now, something has happened.
Events in the world, like the Russian invasion of Ukraine, like the energy crisis, and like the redistribution of financial assets in the world, have changed and now we are seeing monies flowing into the purchase of real goods and services.
Consequently, we are seeing the inflation of the M2 money stock flowing into the inflation of consumer prices.
And, the inflation in consumer prices is global. In Great Britain, the rate of inflation has just hit a 40-year high and is in double digits.
The inflation in Germany is 11.1 percent, as inflation throughout the eurozone rises to new heights.
And, the thing is that there is plenty of money all over the place to keep pushing consumer prices higher.
It appears as if we have moved into a new framework.
Whereas the Federal Reserve during the 2020-2021 period was acting on the premise that almost all of the money it generated went into the financial circuit of the economy, thereby pushing up asset prices and not consumer prices, we now have a different scene.
Now, we see more of these “stimulus” monies going into the productive circuit of the economy, raising consumer prices.
So, here we come back to the performance of the monetary aggregates in the past few years.
Consumer Price Inflation
Consequently, it now seems more relevant to look at the growth rates of the M2 money stock, once again, to see what inflationary damage might be done to the economy.
The economy has experienced several decades when more and more of the Federal Reserve’s monetary expansion went into the financial circuit.
We can see this happening as the velocity of circulation of the M2 money stock dropped and dropped and dropped.
Velocity of M2 Money Stock (Federal Reserve)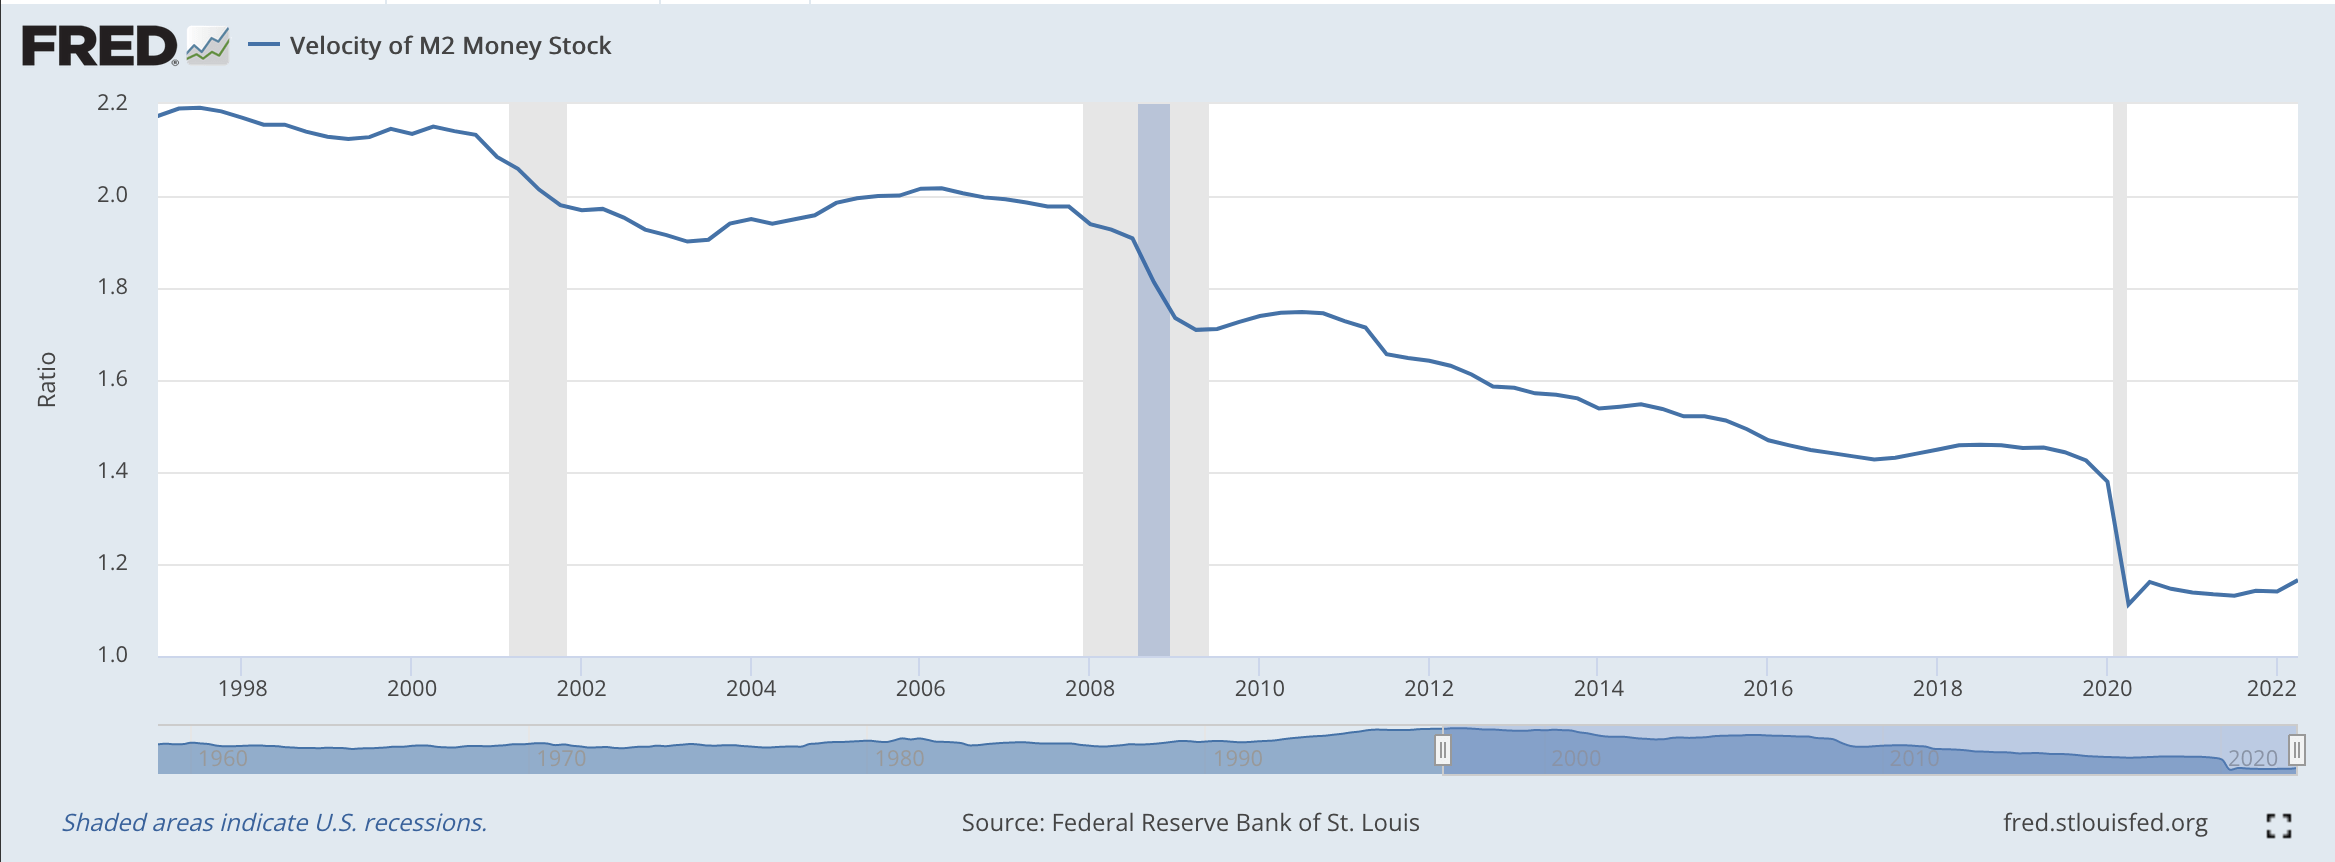
You can see that the decline in M2 velocity has been going on for some time. This is the period where I have defined the economic policies of the federal government as one of “credit inflation.”
It is a period when sophisticated investors got used to the federal government pushing up asset prices and so these investors saw to it the stimulus monies went into boosting asset prices and not spurring on the economy.
Hence the velocity of circulation of the M2 money stock fell, and fell, and fell. The decline accelerated through the pandemic crisis.
A New Era?
Does all of this point to a transition into a new era of monetary policy and a new era of inflation?
It is something that the Federal Reserve is going to have to work out.
It is something that investors are going to have to work out.
But, it seems as if we might be experiencing all sorts of “new” things. In such a world, however, must be careful using the models of the past.
Be the first to comment