

AK2
I have been growing more bullish on silver during August, and feel now is a great time to consider leveraging the idea. I have mentioned the ProShares Ultra Silver ETF (NYSEARCA:AGQ) in the past as a way to double your leverage to silver prices. Unfortunately, silver has drifted lower and the 2x AGQ product is down considerably since I first explained its prospects in October.
Why Invest Now?
Two arguments have turned me into a serious silver bull over the last four weeks. The first is that investor, trader and analyst sentiment is now decidedly bearish, which usually means future losses will be limited, and a turnaround is approaching. Below is a chart taken from my bullish iShares Silver ETF (SLV) story posted a few days ago here. In a nutshell, the Commitments of Traders (COT) report, which tracks who is buying and selling futures contracts, showed the type of large speculator and retail trader pessimism usually witnessed at an important price bottom. Conversely, in the middle of July commercial hedgers like miners, producers, and refiners were net long the greatest number of contracts since May 2019, circled in green below. In combination, bearish speculator vs. bullish industry insider positioning is one of the best indicators of a washed-out sentiment backdrop.
Tradingster Website, Silver Price Vs. Weekly COT Report, Author Reference Points, October 2018 – Present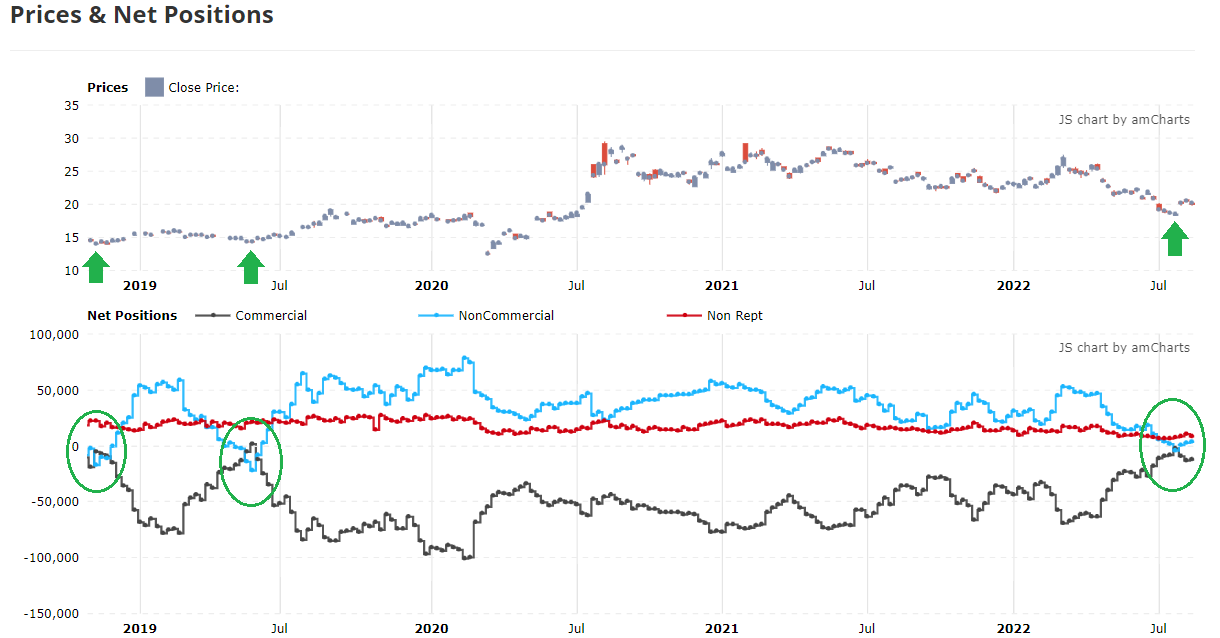
The second argument is silver’s “relative” price to other asset classes and monetary aggregates like M2 money supply and total Treasury debt is approaching its lowest reading in modern times. For example, the gold to silver ratio of 92x in August 2022 is well above the normal range of 40x to 60x since we officially left a monetary-metal standard and convertibility for dollars in the early 1970s. Effectively, I figure an all-time low number for silver vs. Federal Reserve money printing and Treasury debt borrowing is close to an equivalent of $14 an ounce today, while the fabled and infamous Hunt Bros. attempt to “corner” the silver market in late 1979 and early 1980 would be the same as $500+ for price in today’s adjusted dollars. Using the same comparison technique, I calculate a long-term “fair value” of $40 to $50 an ounce for silver currently. So, a $19 price represents a true bargain for investors and owners. I described in the previous silver/SLV article with expanded detail how I come with my relative valuation ideas, which I hope you can review if interested in silver bullion and related investments.
Spiking Lease Rates
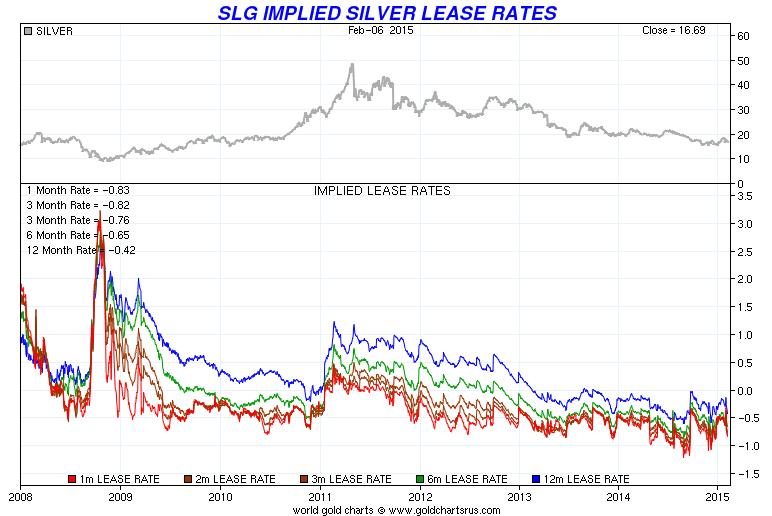
Another bullish angle I did not discuss in the first silver article was the lease rate picture is suggesting material tightness for supply now exists. All told, pressure is building on silver prices to rise by the structure of the lease market, where banks, brokers, and large hedge funds trade and lend physical bullion. Implied lease rates, based on the pricing of forward contracts for short-term 2-month borrowings have risen above the rates on 12-month loans. Typically, this is a signal of constrained supply, which will eventually cause silver to rise in price, an effort to locate new supply.
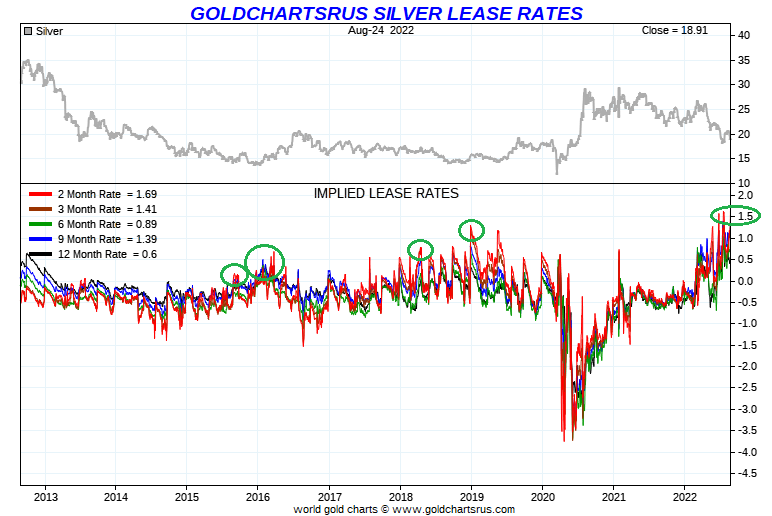
However, the “inversion” in short-term vs. long-term lease rates is just part of the story. Actual demand rates are also the highest since the important 2008 silver bottom during the Great Recession. I have circled in green below on a 10-year graph, each instance a new multi-year high level was reached for 2-month rates. Taken together, the inversion on the duration curve and multi-year highs for lease rates are strongly correlated with price bottoms. In fact, the last time a serious inversion appeared alongside a 2-month lease rate above 1.5% was October 2008, right after Lehman Bros. was allowed to fail (unleashing a counterparty banking crisis in America).
Gold Charts R Us, Silver Lease Rates, 1-Year Graph Gold Charts R Us, Silver Lease Rates, 10-Year Graph, Author Reference Points Gold Charts R Us, Silver Lease Rates, 2008-2015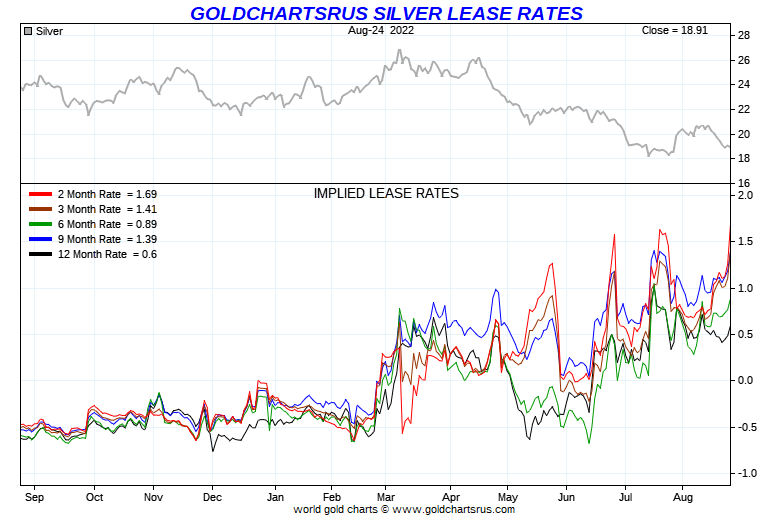
ProShares Ultra Silver
AGQ does carry a hefty 1.5% management fee yearly to create its leverage through swaps with banks and futures contracts. Plus, it suffers from the time decay of forward contango on futures contracts and swap instruments (where nearby delivery agreements are traded at higher than spot quotes). The best way to illustrate the real-world effect on the price of these inherent negative trading characteristics is by drawing some examples.
Below is a 12-month graph comparing AGQ price swings to the regular iShares Silver Trust vehicle. The -20% SLV loss more than doubled to -44% with AGQ, if you held for one year. Not only did trust owners suffer 2x the silver price drop, but fees and contango exaggerated the decline.
YCharts, 1-Year Graph, AGQ vs. SLV Performance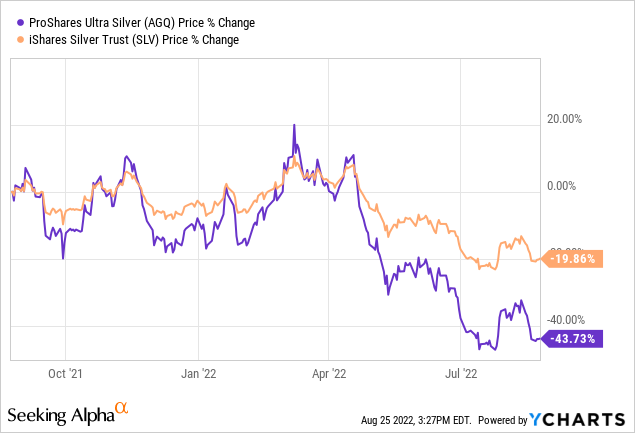
If you bought and held for five years, AGQ’s performance was even worse. A +10% SLV gain turned into a -39% loss! So, it is easy to understand buying and holding this 2x ETF product makes positive gains difficult to achieve, the longer you own it.
YCharts, 5-Year Graph, AGQ vs. SLV Performance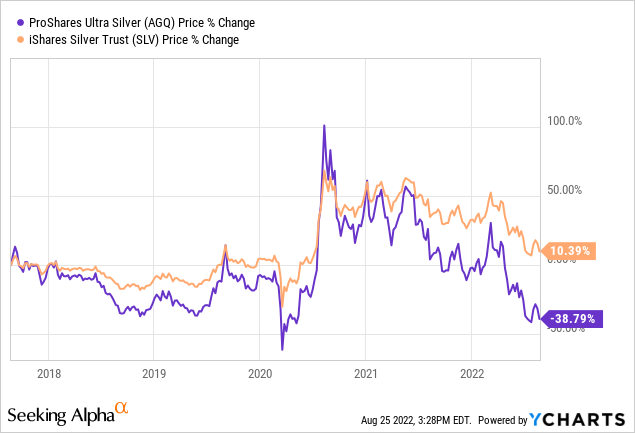
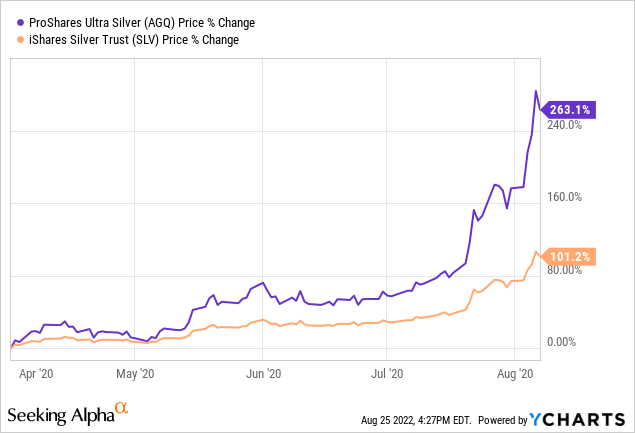
However, if you are smart or lucky enough to buy near a major bottom, a double of basic silver gains is possible, even during holding periods of a year or two. If you had purchased AGQ at the November 2018 silver price bottom and held through the August 2020 high, this leveraged instrument delivered superb gains for investors. It depends on futures premiums over time and daily swings for compounding, as prices are rebalanced each day. If you catch a series of sharp daily gains for weeks or months, you can earn better than 2x any silver advance because of the daily rebalancing feature. For example, if you had nailed the April 1st, 2020 pandemic liquidation bottom for a buy, and sold into early August’s peak, your profit was 2.6x the same period SLV rise!
YCharts, October 2018 – August 2020, AGQ vs. SLV Performance YCharts, April-August 2020, AGQ vs. SLV Performance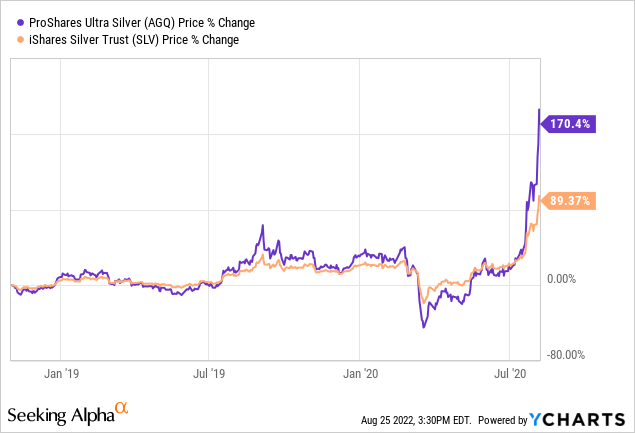
On the 2-year chart of daily trading below, we can review the steady drop in price from August 2020. Nevertheless, momentum indicators I track are not screaming intense selling pressure is evident. It’s been an orderly, arbitrage-like drop, led by the underlying silver bear market. In fact, movements in the Accumulation/Distribution Line and Negative Volume Index are the kind of bullish action usually witnessed in a rising price pattern.
StockCharts.com, 2-Year Chart, AGQ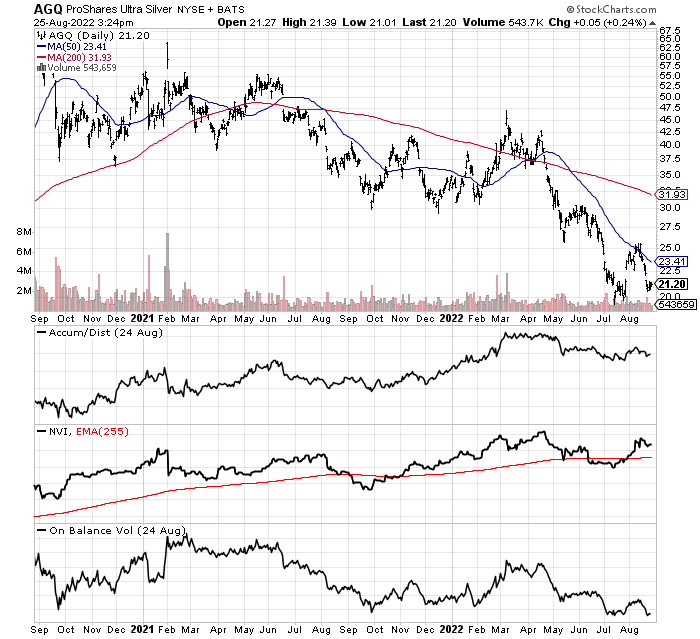
Final Thoughts
Several readers have asked me for a handful of good silver mining names. Unfortunately, these companies are smaller, many with resources outside of the U.S. and Canada. I would prefer to keep any “leveraged” silver pick tied more directly to the physical silver market, absent shaky foreign ownership titles, unpredictable tax/regulatory changes, and spontaneous operating challenges, all rolled up into an enterprise earning little profit or even losing money. For me, a straightforward leveraged product on silver quotes will suffice and simplify my risks – the most efficient choice in this category for retail investors is AGQ.
Is silver guaranteed to rise substantially in September? No, it may fumble around another month or two before finding a stronger bid. If U.S. stock and bond markets continue to slide this autumn, a recession in industrial demand and drained liquidity in the markets by the Federal could hold silver prices down for a spell. However, this scenario should also lead to considerably greater bank liquidity and lower interest rates by early next year. At that point, silver may skyrocket back above $30 an ounce.
My thinking is silver either begins to rise in price now or will climb even faster at the beginning of next year. Because I cannot pinpoint exactly when oversized buying tilts the supply/demand balance in favor of bulls, a cost-average approach to AGQ may be the smartest risk-adjusted way to build a position. If you buy an opening stake now and silver immediately takes off, you will still participate. But, if silver struggles in price for another month or two, you can add to your AGQ holdings at lower quotes, preparing for the turnaround without predicting which day the final bottom is outlined. Then, late in the year, if silver has still not jumped into an uptrend, you can finish purchasing a full position.
What’s the upside? If silver is ready to climb above $50 an ounce by late 2023 or sometime in 2024, AGQ could deliver outstanding returns. Gains of 200% or even 300% are possible vs. theoretical downside limited to -100%. From a risk/reward standpoint, I feel ProShares Ultra Silver is worthy of more research and perhaps a spot in the “speculative” bucket of your brokerage account.
Thanks for reading. Please consider this article a first step in your due diligence process. Consulting with a registered and experienced investment advisor is recommended before making any trade.
Be the first to comment