

lucky-photographer
The Nasdaq has experienced several sharp declines since bottoming in 2009, but the right strategy has been to buy the dip each time. We will use Nasdaq 100 futures (which track the Nasdaq 100 index, same as the Invesco QQQ ETF) for our analysis. For simplicity purposes, if we use the 200-day moving average as a benchmark, Nasdaq 100 has been under the 200-day MA for 852 days out of the last 4236 trading days. 2022 so far has seen the most number of days under the 200-day MA since 2008.
Days below 200 day MA (Author calc on public info)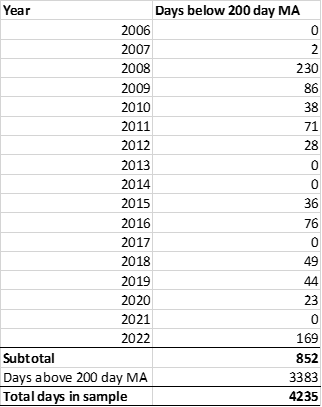
So this begs the question, is the current dip a buy or a sell? Given that the right move has been to buy for the last 13 years, how can we tell this time?
This article is based on an observation: during a downtrend, the Nasdaq 100 index futures are often trading flat or even up before the U.S. equities markets open, and then it suddenly starts to head south during the U.S. session (9:30 AM to 4 PM ET).
Based on this observation, I constructed an indicator (which I will call “Regular/After-hours Divergence Indicator,” or “RAD”) using all-day Nasdaq 100 index futures data to show divergence between U.S. session regular hours (i.e., 9:30 AM to 4 PM) and afterhours. For details on how RAD is calculated, please see the appendix at the bottom.
I will use the Nasdaq 100 index futures as it has regular and afterhours trading, whereas the Invesco QQQ ETF (NASDAQ:QQQ) has more limited afterhours trading data.
- A positive RAD means that average prices during the regular hours are higher than after hours, vice versa for a negative RAD. The cumulative RAD is shown below (i.e., the daily RAD is added cumulatively). The results are plotted below against the Nasdaq 100.
RAD vs Nasdaq 100 (Author calc based on Nasdaq 100 index futures continuous contract)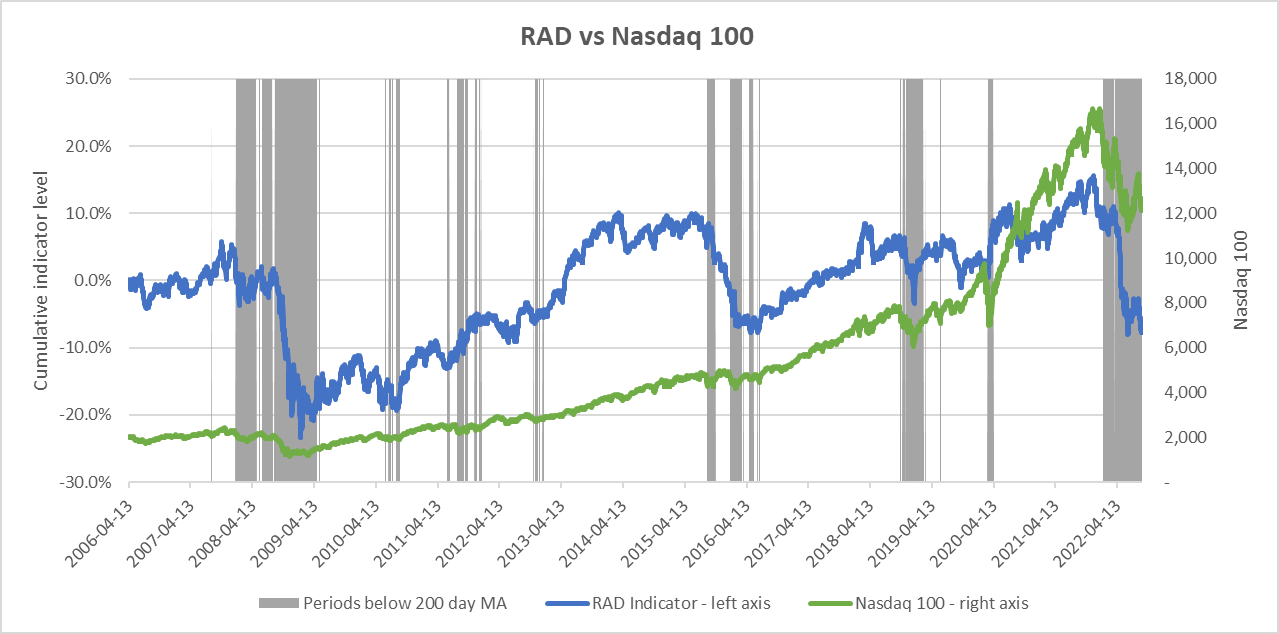
Note:
Greyed out areas indicate days/periods where the closing price was below the 200-day moving average.
- It appears the RAD is trendless or trends positively in a bull market and trends negatively in a bear market/correction. Which means in a bear market, afterhours trading is generally at a higher price before declining during regular hours trading (this is consistent with our observation and feel of how the market usually behaves).
- It is hard to precisely explain this phenomenon, it could be that:
- U.S. investors on average are more savvy than non-U.S. session investors, so during bull markets, they consistently price U.S. stocks at higher prices than non-U.S. session investors and vice versa during bear markets; or
- Information is priced within regular trading hours as real money investors (e.g., mutual funds and such institutions) impact prices; or
- Market-moving information is mainly released during regular trading hours and during a bear market this information is consistently negative or perceived as such, hence pushing prices towards a negative direction (and vice versa in a bull market);
- Afterhours had relatively lighter trading, but there is still a fair amount of volume being traded: during Jan-Aug 2022, afterhours volume accounted for roughly 30% of total volume (the percentage was quite consistent in each month). This was a bit lower in 2007 (at around 18%), but increased to 25% by 2012 and hovered between 25% and 33% for the next decade.
- If we combine this with 200-day MA (greyed out areas represent those days/periods where the closing prices were under the 200-day MA), we can see that the sharp moves down in the RAD coincide with the periods where the closing price was below the 200-day MA, while the RAD levelled off or increased when the closing price was above the 200-day MA.
Let’s break it down into a few major periods and see how the RAD performed in each.
Apr 2006-Dec 2009
RAD vs Nasdaq 100 (Author calc based on Nasdaq 100 index futures continuous contract)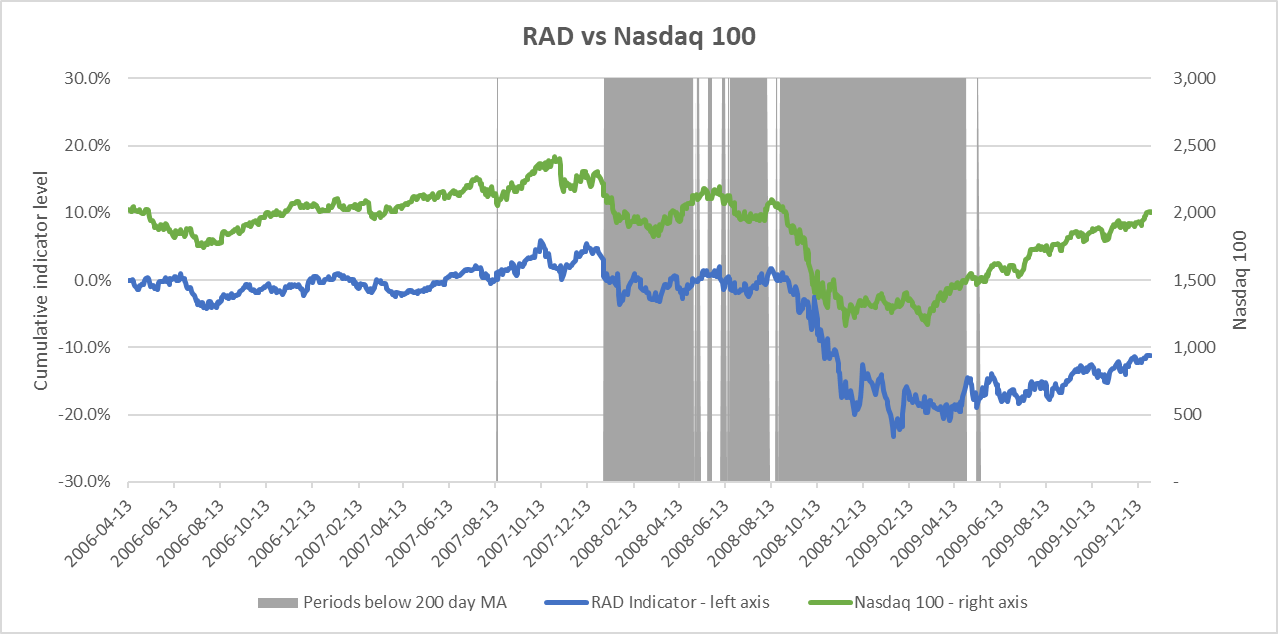
Note:
Greyed out areas indicate days/periods where the closing price was below the 200-day moving average.
In 2006-2007, both the Nasdaq 100 and the RAD largely trended in the same direction and the RAD hovered around 0% and did not portend the tectonic shift to come.
The RAD sharply fell after the September 2008 Lehman shock and continued to fall till bottoming in February 2009 (stocks ultimately bottomed in March 2009). From February 2009 onwards, the RAD largely did not trend though it fluctuated on a day-to-day basis.
2010-2014
RAD vs Nasdaq 100 (Author calc based on Nasdaq 100 index futures continuous contract)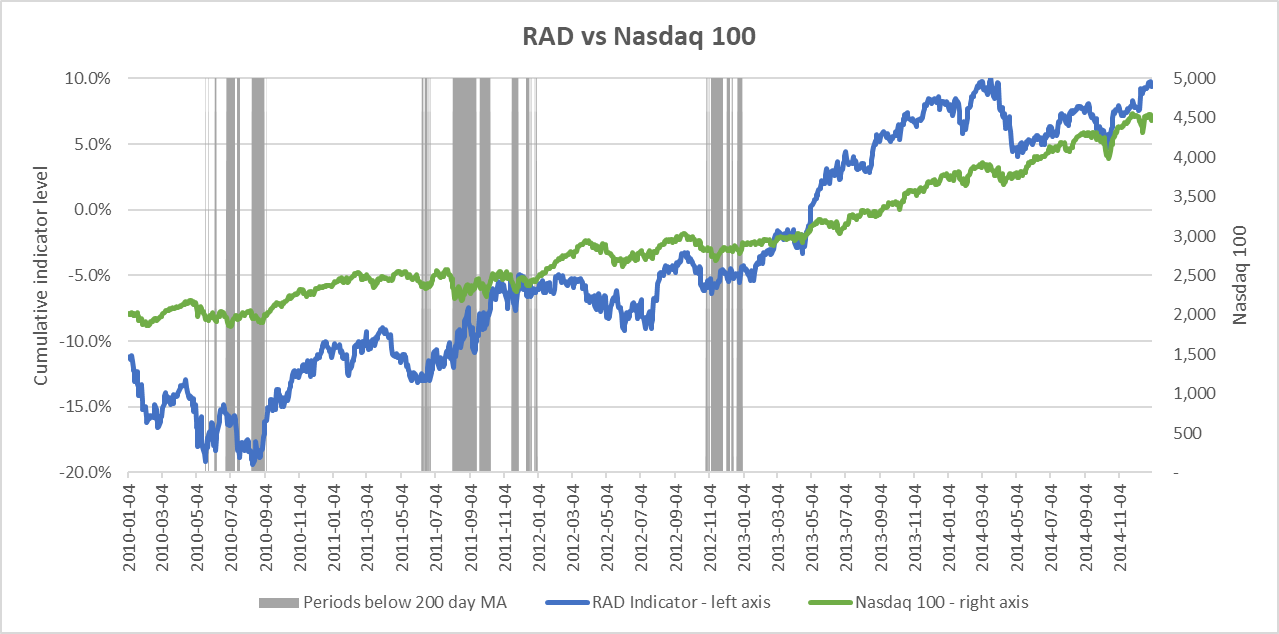
Note:
Greyed out areas indicate days/periods where the closing price was below the 200-day moving average.
2010 started with a selloff in mid to late 2010. During this period, Nasdaq 100 spent a lot of time oscillating around the 200-day MA as the European debt crisis simmered, but there was not a major negative movement in the RAD and stocks resumed their upward course.
2015-2019
RAD vs Nasdaq 100 (Author calc based on Nasdaq 100 index futures continuous contract)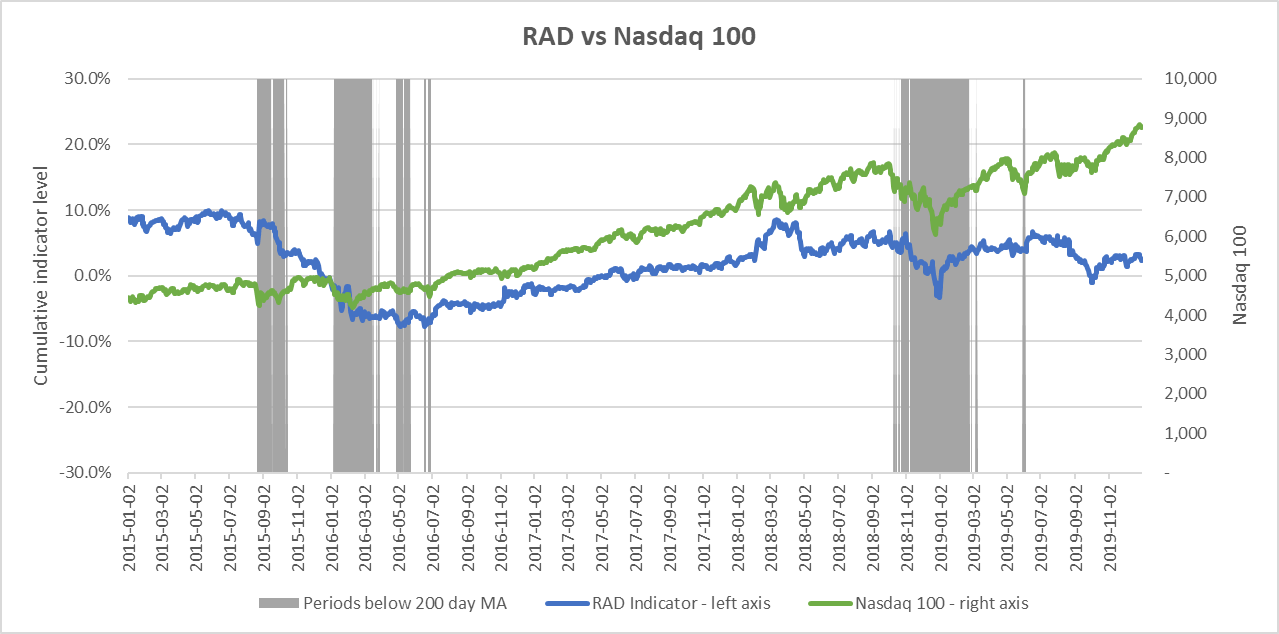
Note:
Greyed out areas indicate days/periods where the closing price was below the 200-day moving average.
From 2015-2019, the RAD showed a persistently negative move in Sep-2015 to Mar-2016 but afterwards it did not deteriorate any further and stocks resumed their upward trend. Amazingly, during this entire trade war period, the RAD did not show much of a negative move except in late 2018. Most of the time the RAD oscillated nowhere and stocks went up.
2020-present
RAD vs Nasdaq 100 (Author calc based on Nasdaq 100 index futures continuous contract)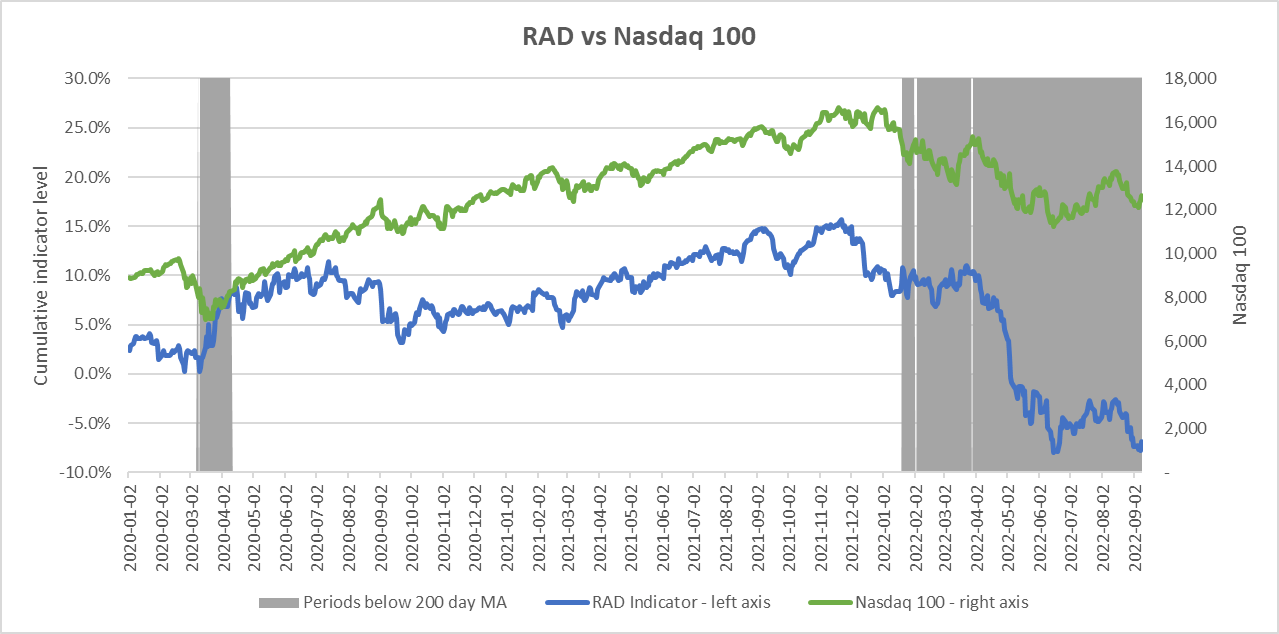
Note:
Greyed out areas indicate days/periods where the closing price was below the 200-day moving average.
This period gets very interesting. Despite a sharp sell-off in March 2020, RAD trended up (meaning regular hours trading had prices higher than afterhours) for most of the period! The RAD was screaming buy while the media was hyping up 100% infection rates on a certain unfortunate cruise ship and Europeans going into lockdown, etc.
The RAD started persistently falling in Nov-21, similar to when stocks overall began declining. Since then the Nasdaq has mostly been under the 200-day MA and the RAD has entered a fresh bout of declining since August 2022.
Where are we in the current stage:
From the chart above, it’s apparent the current downtrend is the longest time spent below 200-day MA for 13 years, and also the sharpest and longest decline in the RAD in the past 13 years, and the RAD has recently continued declining rather than bottoming out. The last time it was this bearish in 2008/2009, the RAD indicator and Nasdaq spent 5 months bottoming out, before entering into a bull market. Per 2008-2009, once this indicator starts to level out and the Nasdaq regains the 200-day MA, it may be a sign of a real bottom, but it appears we may yet be some time away.
I am not presenting this indicator as a silver bullet, however, it may be helpful:
- As a high frequency indicator (economic indicators and earnings are much more lagging). It is especially interesting to see despite the large declines in U.S. equities during the March 2020 coronavirus panic, U.S. regular trading hour session investors were more interested in buying equities than the afterhours investors, which may have been a good indicator of where the smart money was going when every other price-based indicator would have gone haywire, economic data would not be known for months and the news implied the apocalypse was just days away.
- The reader is encouraged to do his own iterations, I’m sure there can be fancier iterations (e.g., adding volatility, cross-checking with other indicators, etc.), I will just show the bare-bones analysis in this article without any bells and whistles.
Appendix: Calculation methodology of RAD
- Calculated average price for the regular trading hours and after hours for each day based on Nasdaq 100 index futures 5-minute data from Apr 2006 (two years before the Great Financial Crisis of 2008 to establish a baseline) to mid-Sept 2022.
- Subtracted for the difference and converted into a percentage.
- 9:30 AM to 4 PM as U.S. sessions regular trading hours (referred to below as regular trading hours) and all other hours as afterhours.
- The difference is then added cumulatively, so it is easier to see a trend (as there are large gyrations day-to-day, if the daily results are plotted, the trend is less obvious).
Be the first to comment