

undefined undefined/iStock via Getty Images
Last week, the most important information came from Friday’s employment report. Let’s first look at data from the household survey:
Household survey data (BLS)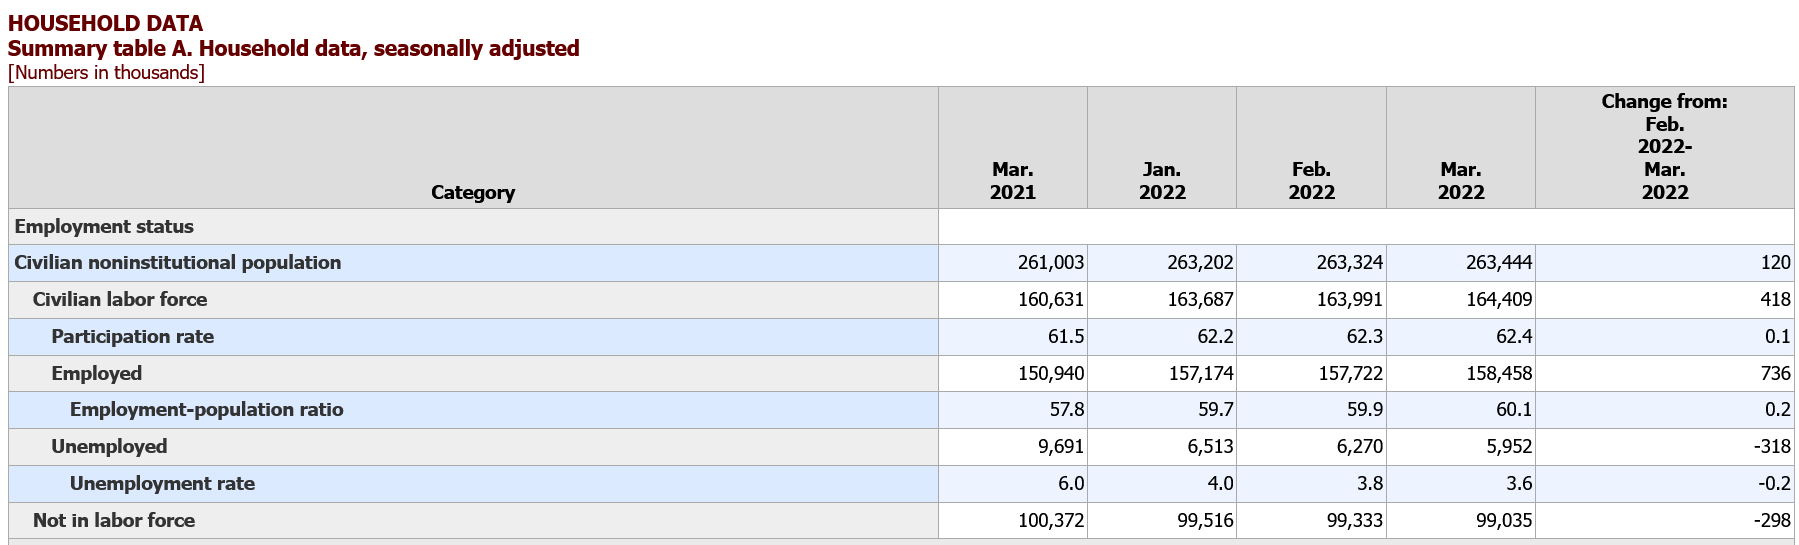
The civilian labor force (the total number of people employed or unemployed) increased by 418,000. The number of employed rose by 736,000 – a healthy number, while the number of unemployed decreased by 318,000 – another healthy development. This table shows a very strong labor market.
Next, let’s look at the establishment data:
Establishment Data (BLS)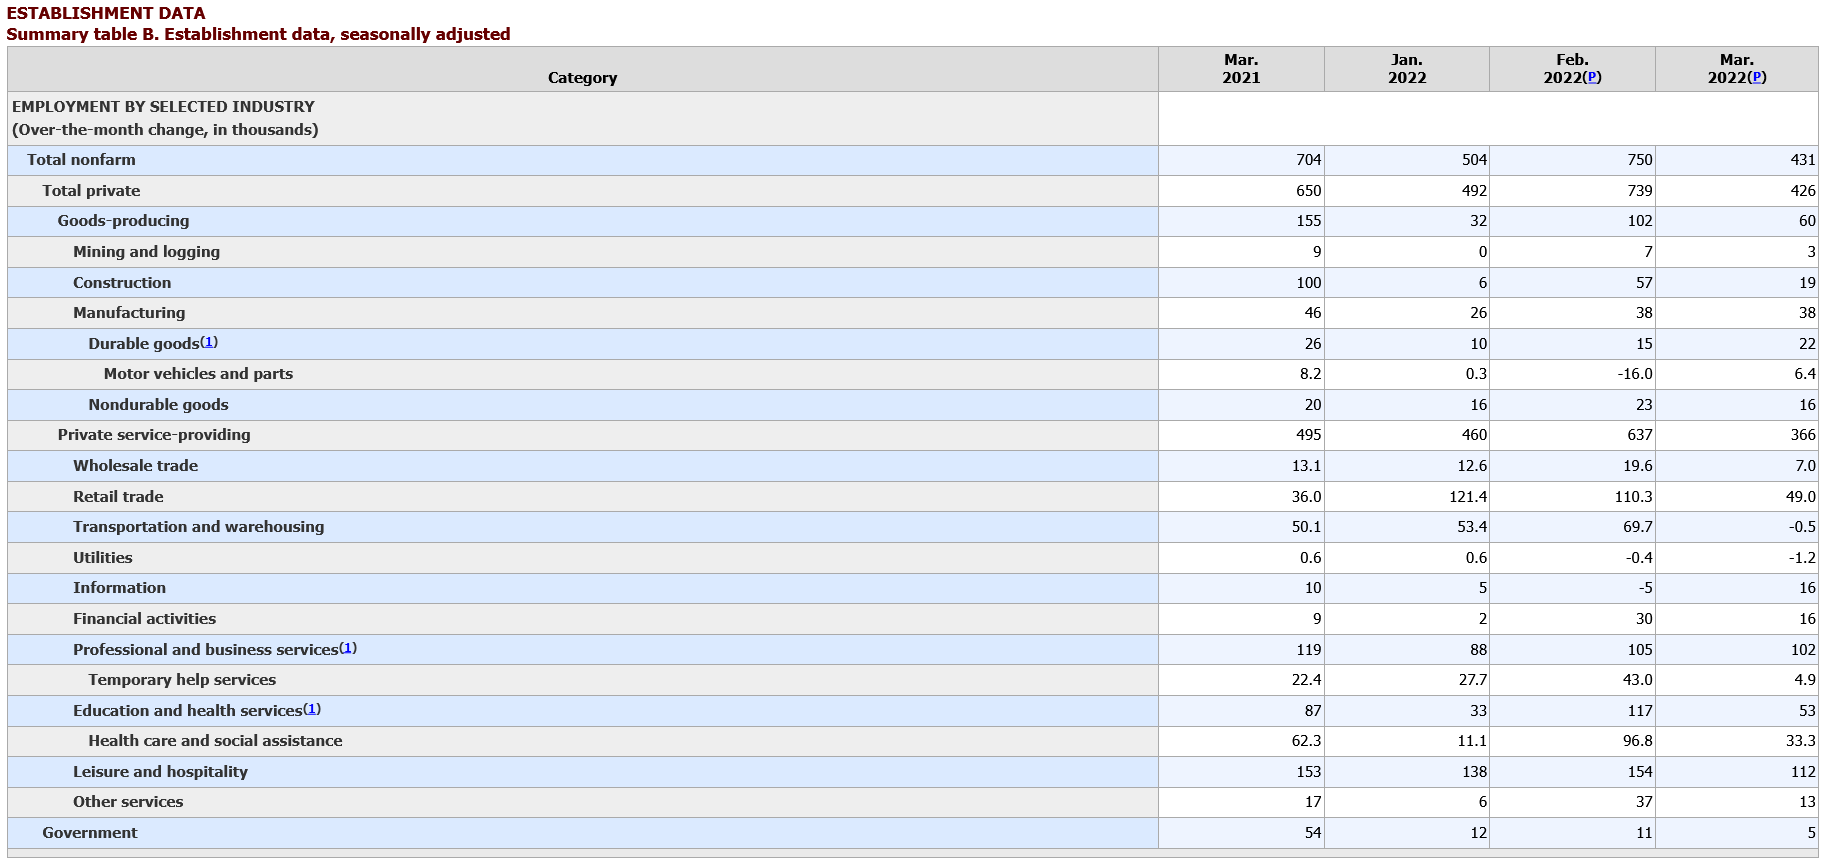
The headline number was the lowest in three months but is a still healthy 431,000. Goods-producing employment was lower due to a smaller number of construction hires. Service industries were lower due to a decline in retail, transportation, and temporary help employment.
Finally, let’s look at a chart of three averages of establishment growth:
3, 6, and 12-month averages of establishment job growth (Data from FRED; author’s calculation)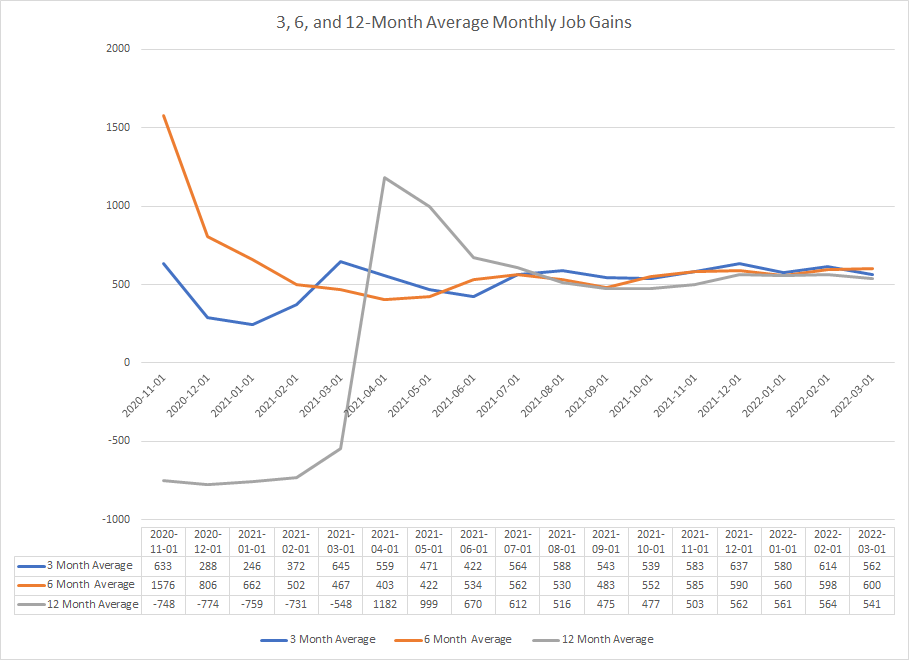
All three averages started to coalesce around the 500-600 level during the beginning of 2021.
The conclusion is that the labor market is in strong shape right now.
The BEA released the latest personal consumption and PCE price index data. There are two key points from the data.
REAL PCE (FRED)
Real personal consumption expenditures continue to inch higher.
PCE price indexes (FRED)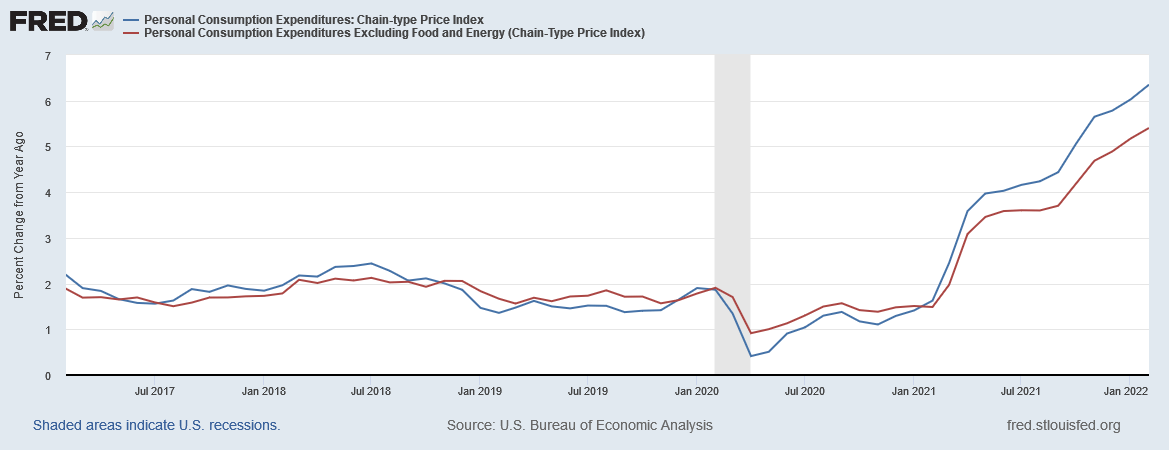
Prices are still rising.
I’ll cover the ISM manufacturing data next week, which will also include the service numbers.
Let’s turn to the charts, starting with the EMA picture:
EMAs of four main ETFs (Data from Stockcharts; author’s calculations)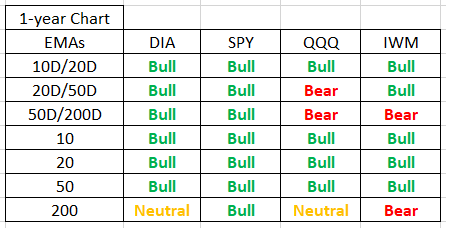
There are two positive changes above. DIA’s 50-day EMA crossed over the 200-day EMA and SPY’s 200-day EMA is now moving modestly higher. The larger-cap EMA pictures are mostly bullish while QQQ’s and IWM’s internals are still a bit mixed.
Next, let’s take a look at market breadth:
Market breadth and A/D lines (Data from Stockcharts; author’s calculations)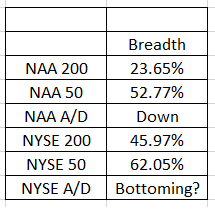
The Nasdaq’s technicals are bearish: a majority of stocks are below their respective 200-day EMAs while a slight majority are above their 50-day EMAs. This also means that a majority of stocks’ 50-day EMAs are below their 200-day EMAs, which is also bearish. Finally, the Nasdaq advance/decline line is moving lower.
The NYSE picture is slightly better, with 46% of stocks above their 200-day EMAs and a majority of stocks above their 50-day EMAs. It’s also possible that the running A/D line has bottomed
Next, let’s take a look at the charts.
YTD SPY, QQQ, DIA, and IWM (Stockcharts)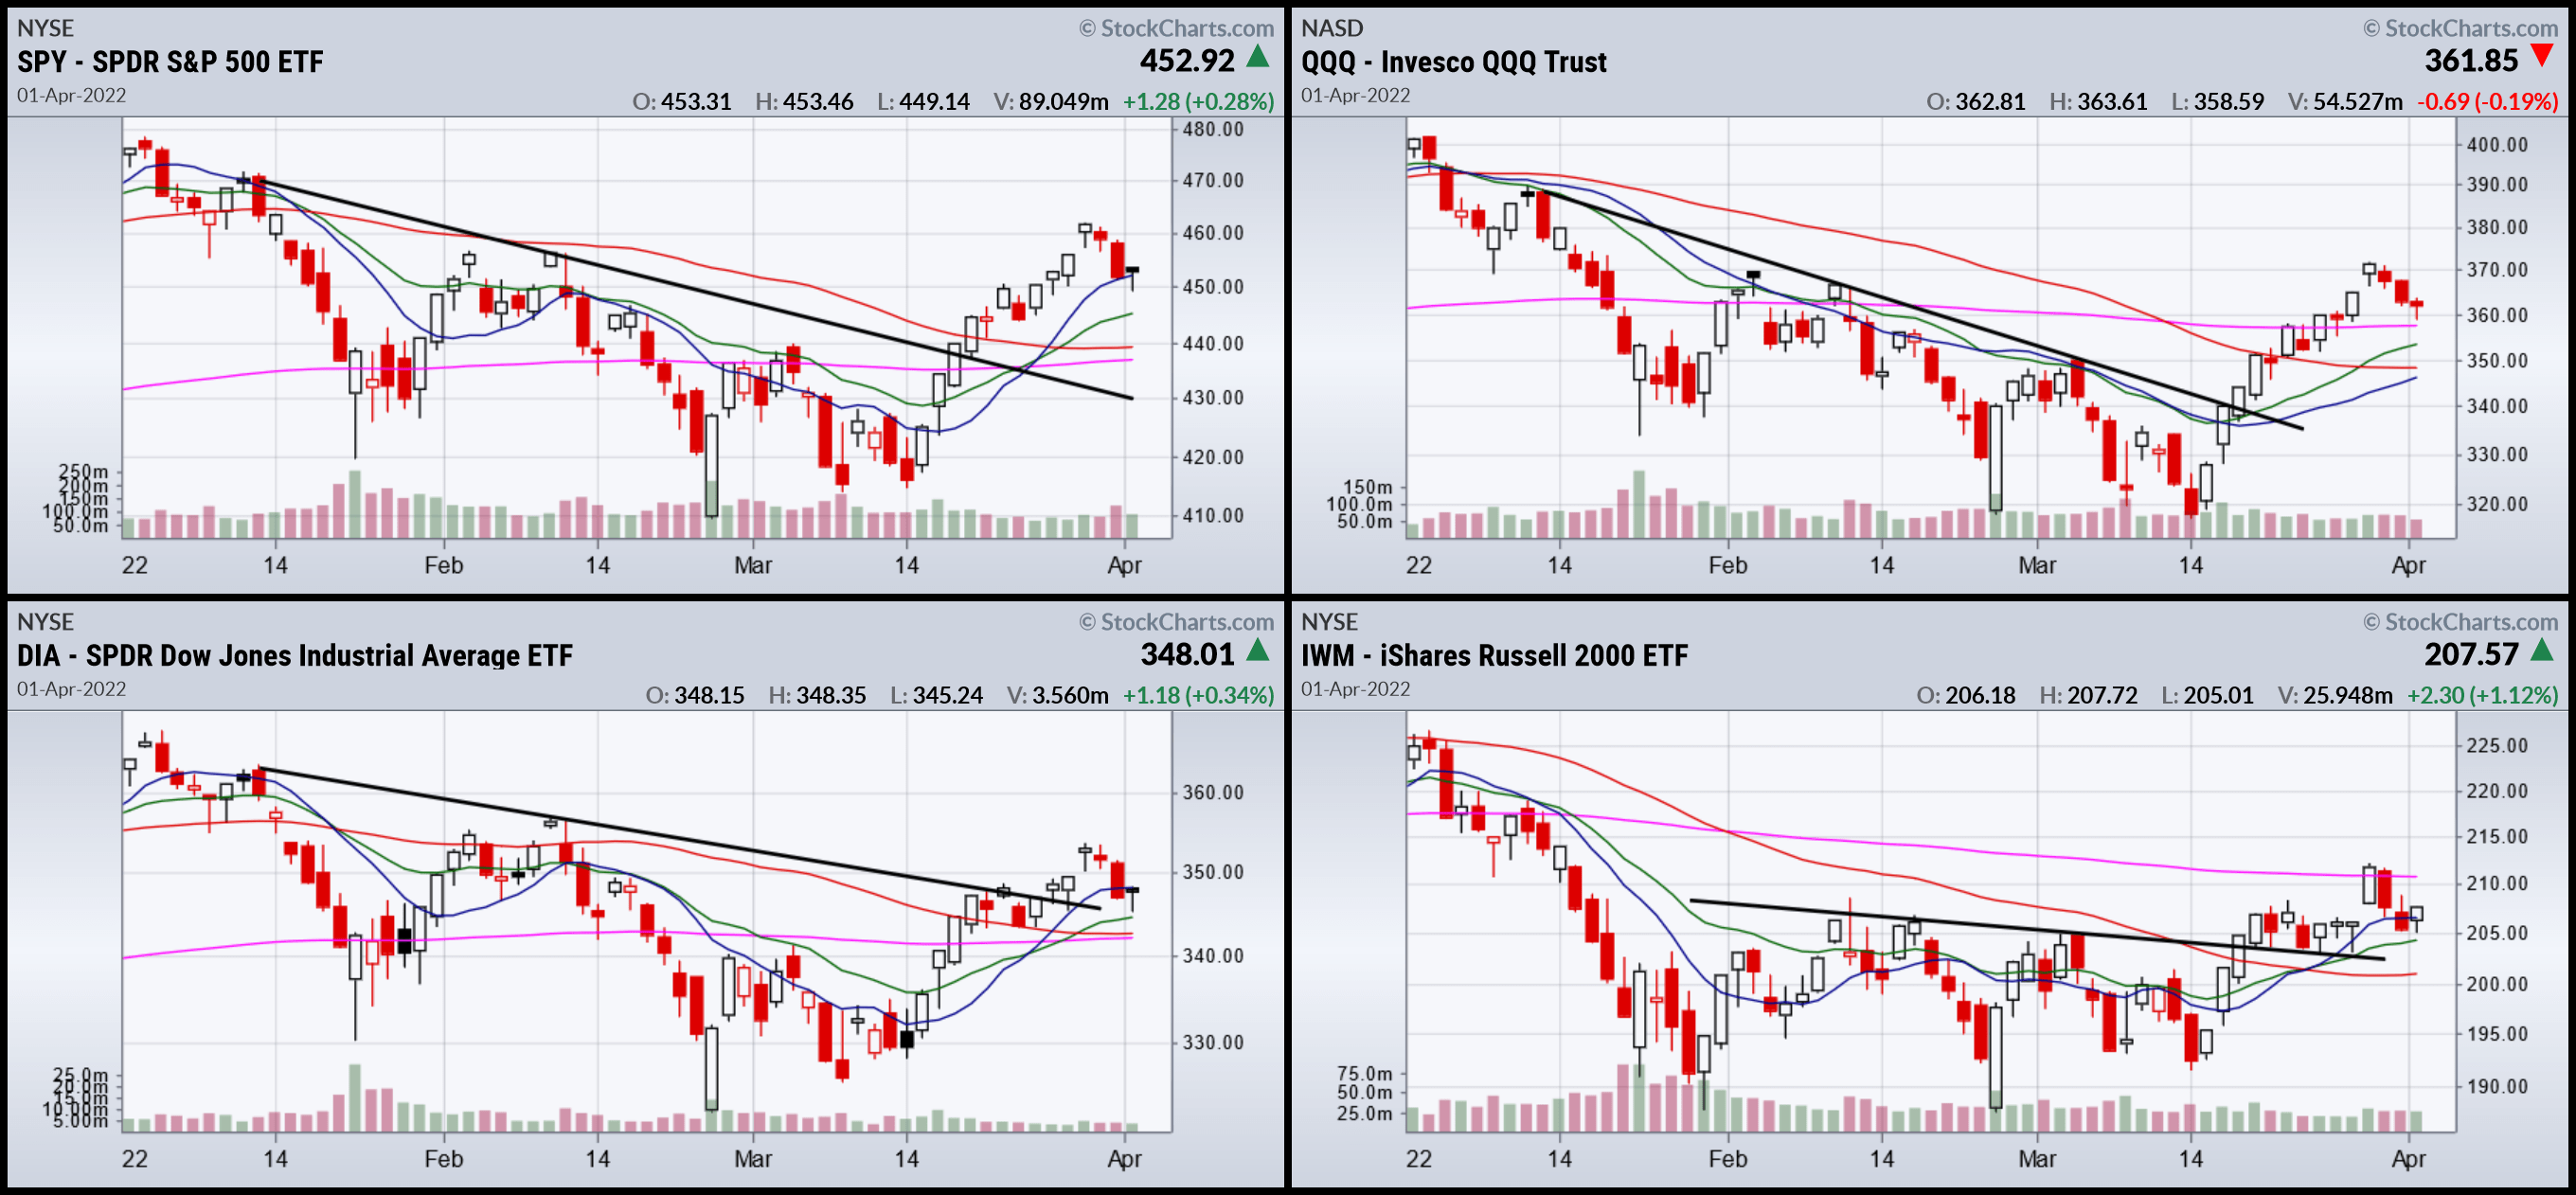
There are two trends. The markets were heading lower for most of the year. But that changed in mid-March when the indexes started a rally that took each through resistance, and, in the case of SPY, QQQ, and DIA, above the 200-day EMA. Last week, all the indexes sold off after the strong rally that started in mid-March.
30-day SPY, QQQ, DIA, and IWM charts (Stockcharts)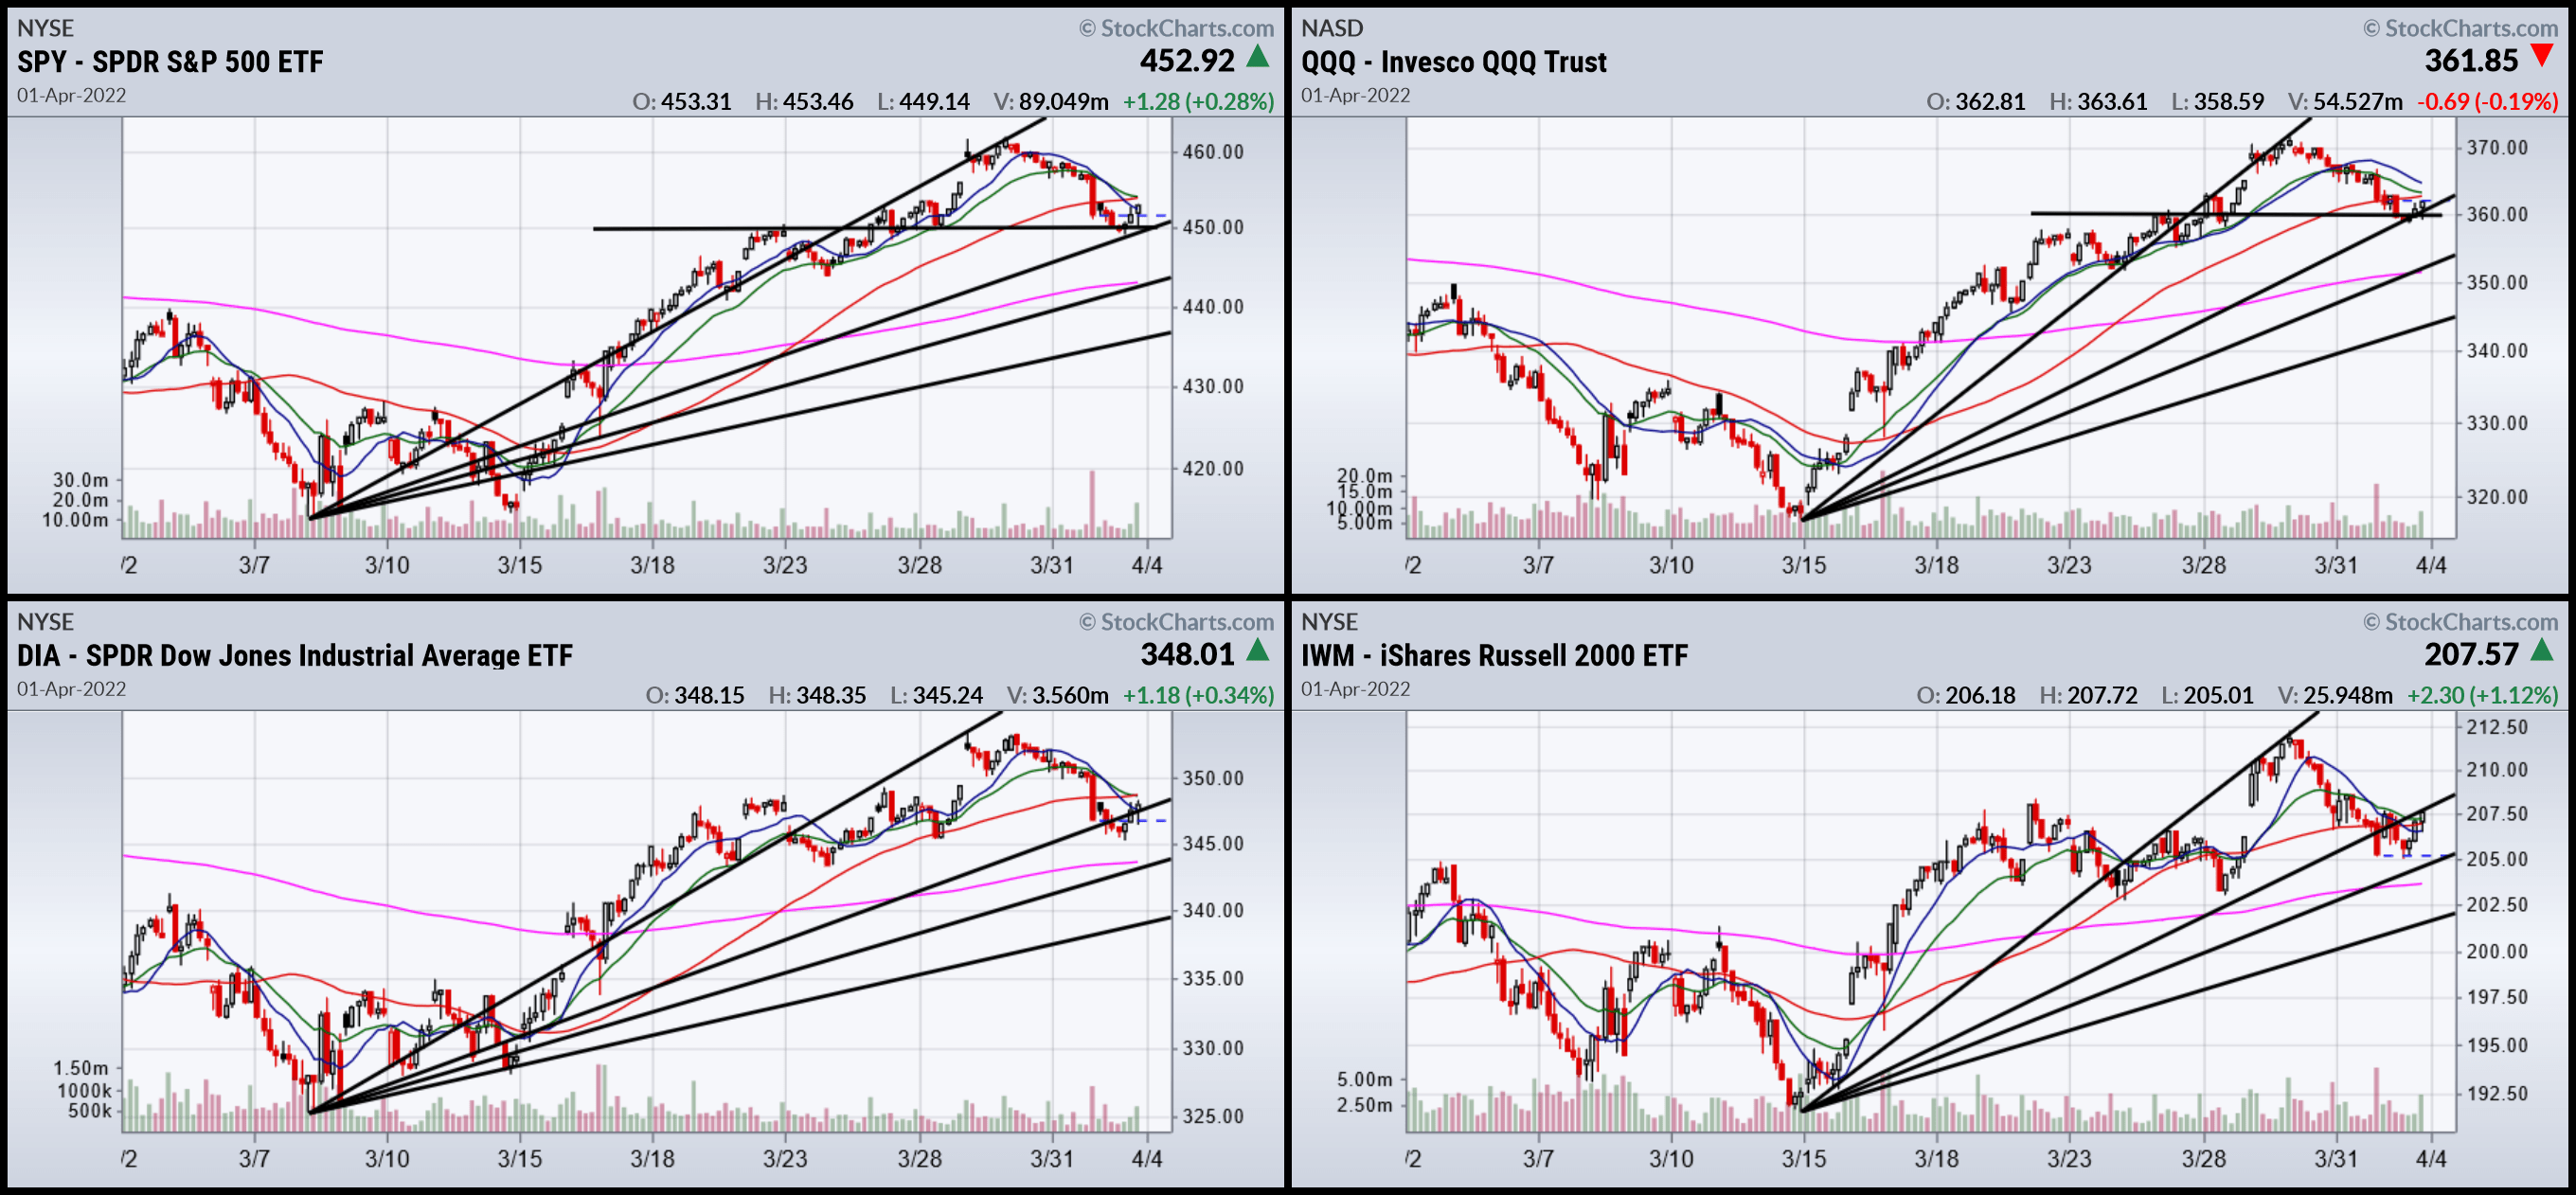
The 30-day charts show that all the indexes have sold off to key technical levels.
2-week SPY, QQQ, DIA, and IWM (Stockcharts)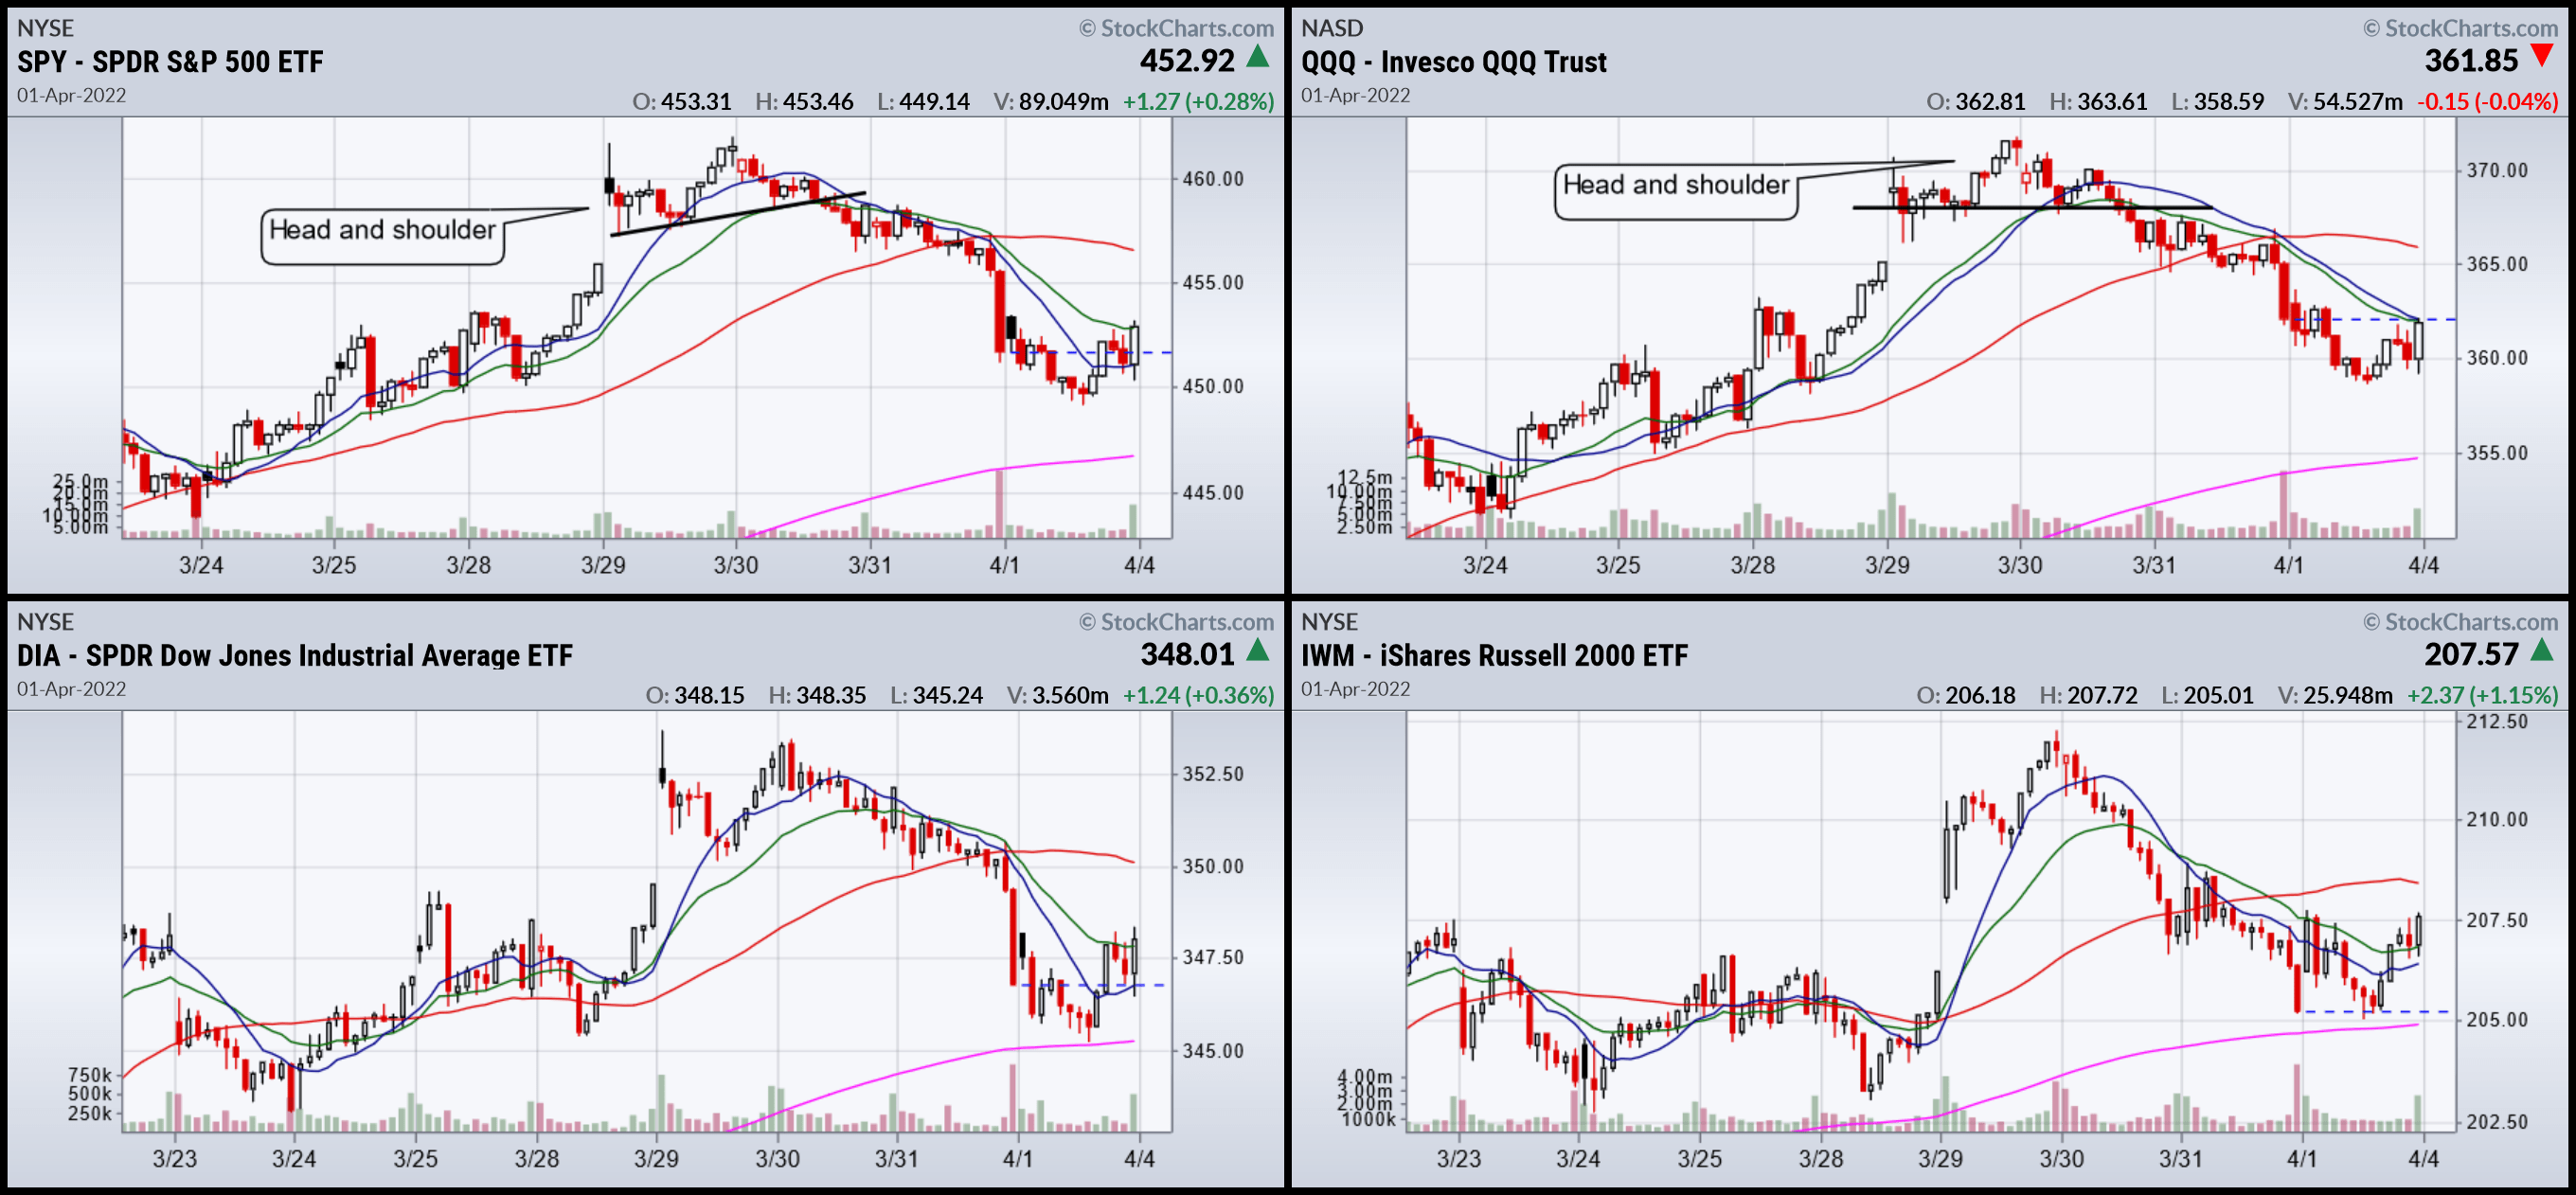
Finally, it looks as though SPY and QQQ formed head and shoulder patterns, meaning that the strong rally from mid-March is over. There are no clear bottoming formations on any of the above charts.
Last week is best thought of as a standard pause/sell-off after a good rally. These are healthy developments; they allow traders to take profits and new investors to take positions.
Let’s hope that the selling is over and the bulls retake the lead next week.
Be the first to comment