

Natalya Bosyak
Chart created by writer from C Trader.
With some of the major equities attempting to form macro bullish wave patterns, things aren’t quite the same for Nvidia (NASDAQ:NVDA). Optimism appears to be at a low, which is reflected by the action in its share price.
Announcing Q2 earnings in August 2022, a whopping 17% miss on earnings estimates certainly doesn’t help, reported concern over supply chain issues, gaming revenue concerns and an SEC fine of $5.5 million over inadequate crypto disclosures, adds to the bad run Nvidia has been experiencing. After its stock split in July 2021, Nvidia has made one bullish three wave pattern which completed its target before falling into bearish mode. The second bullish patterns were actually attempted to be formed directly after the first but ultimately failing and actually eventually setting up wave patterns south.
Post stock split, we can see the last of Nvidia’s bullish waves which led to its last high point at $345 before reversing to bearish. Quite an innocuous pattern with wave one $179-229, wave two $229-190, and wave three $190 to third wave target at $310 and eventually peaking around the Fibonacci 261 at the $345 region.
Nvidia post stock split (C Trader )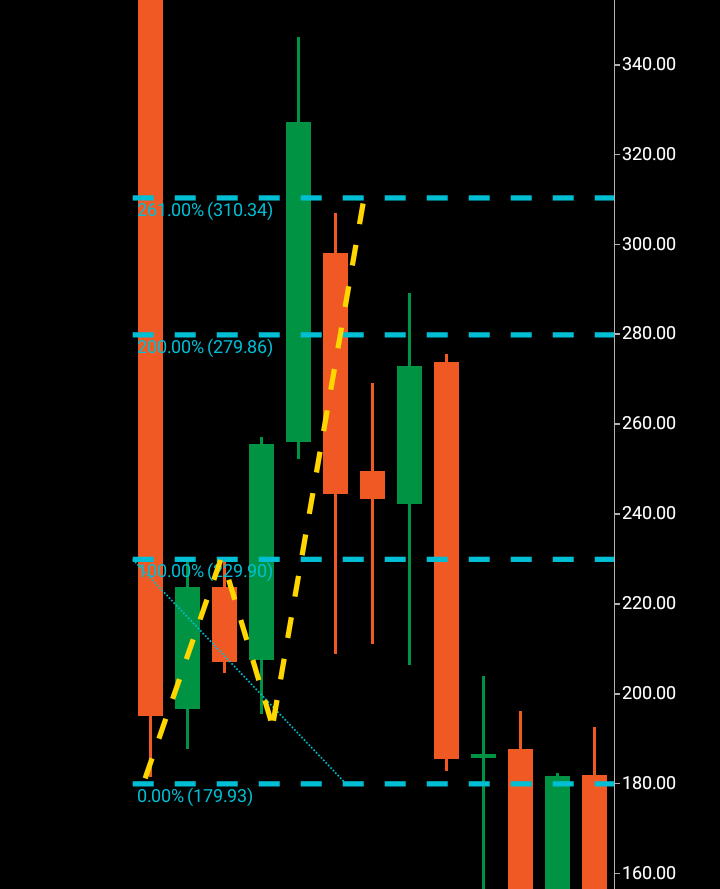
Nvidia’s failed attempt at a second bullish wave (C Trader )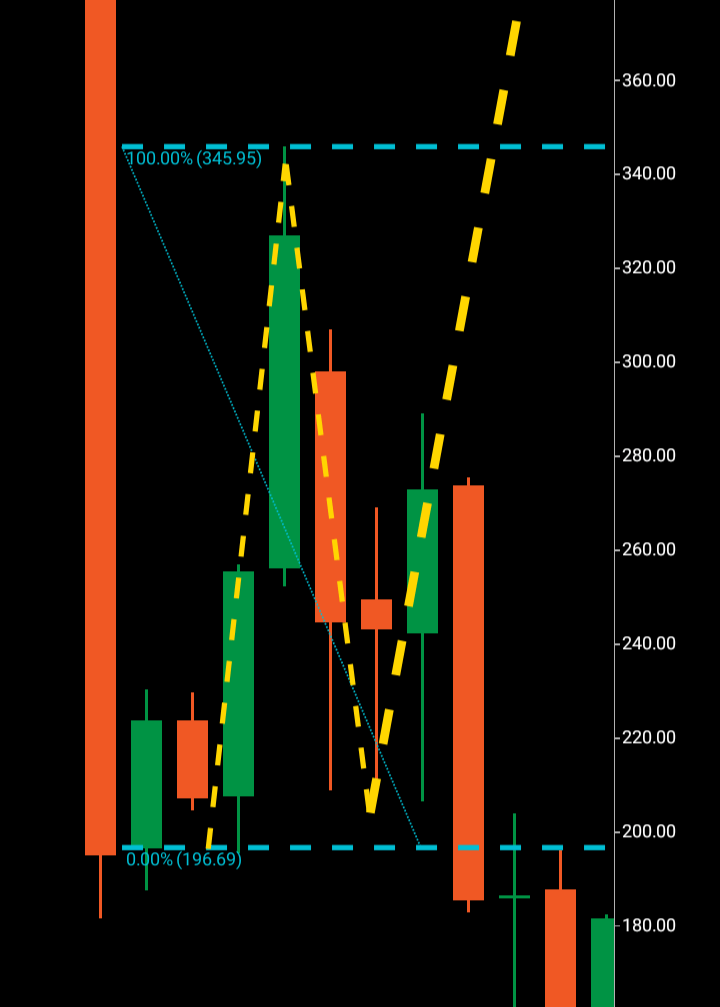
We can then see the failed attempt at the second bullish wave pattern which may have given false hope with the development of the bullish buy up candle highlighted by the thick yellow line. It is interesting that a bullish candle that forms on the outside of a potential upcoming bullish pattern acts as three different things. It obviously acts as a foundation to a bullish buy up contributing to the attempt at the upward wave, but also in turn becomes very bearish if price gets driven below the start of the candle as such obvious bullish sentiment gets slammed in the other direction really killing off short term optimism. The third is of course it acts as a rejection candle but in bearish form. In order to form a bullish or bearish third wave, a rejection candle must be present at or near the peak or low of the wave one and two. In this case, that is exactly what transpired, and we can now see the bearish path set out for Nvidia.
Any of the macro associated charts like weekly or monthly show no signs of a bullish turnaround. We can now look at where Nvidia broke through into its bearish third wave and where the likely targets may be. Below we can see the current setup.
Nvidia current macro chart (C Trader )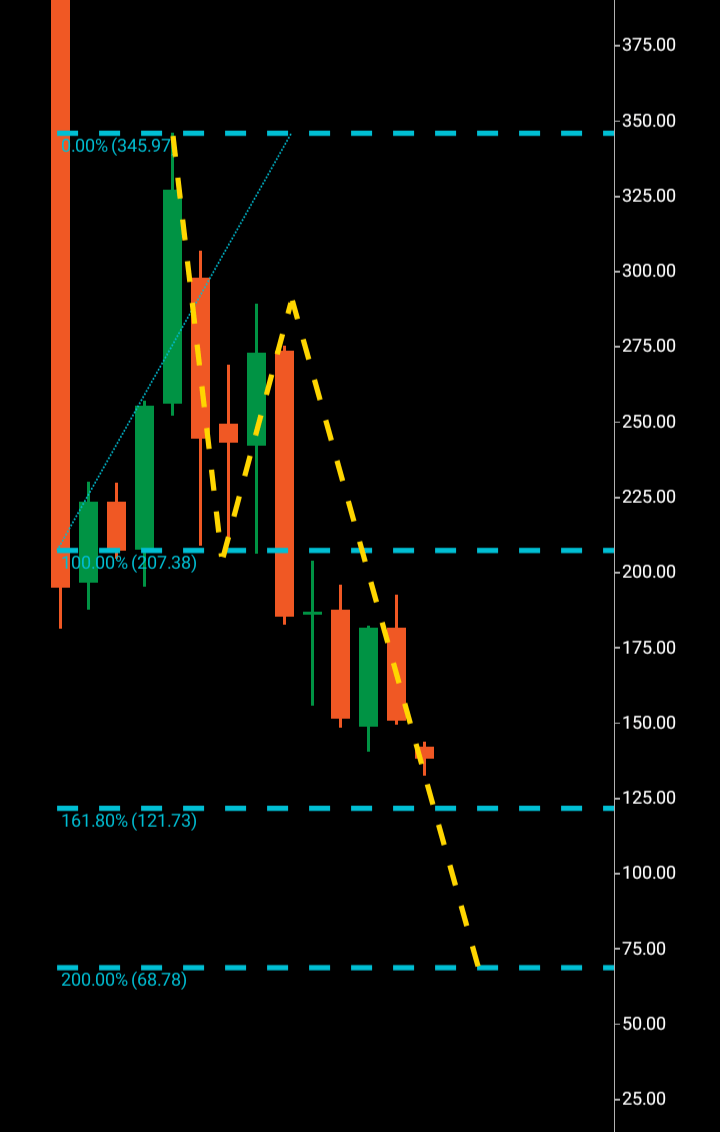
A wave one $345 $207, a wave two $207 – $290 with the third wave confirmed by the break of support at $207.
We must look to the Fibonacci 161 first as bearish waves actually have a less probability of completing at the third wave target being a numerical copy of wave one than bullish. At times, bearish waves can turn around at the Fibonacci 161 so this level must be watched more closely than that of a bullish wave. If price chooses to bypass that Fibonacci level at $121 while failing to show any signs of a turnaround, the 200% would be the main target to then turn to at $68.
Nvidia gap down (C Trader )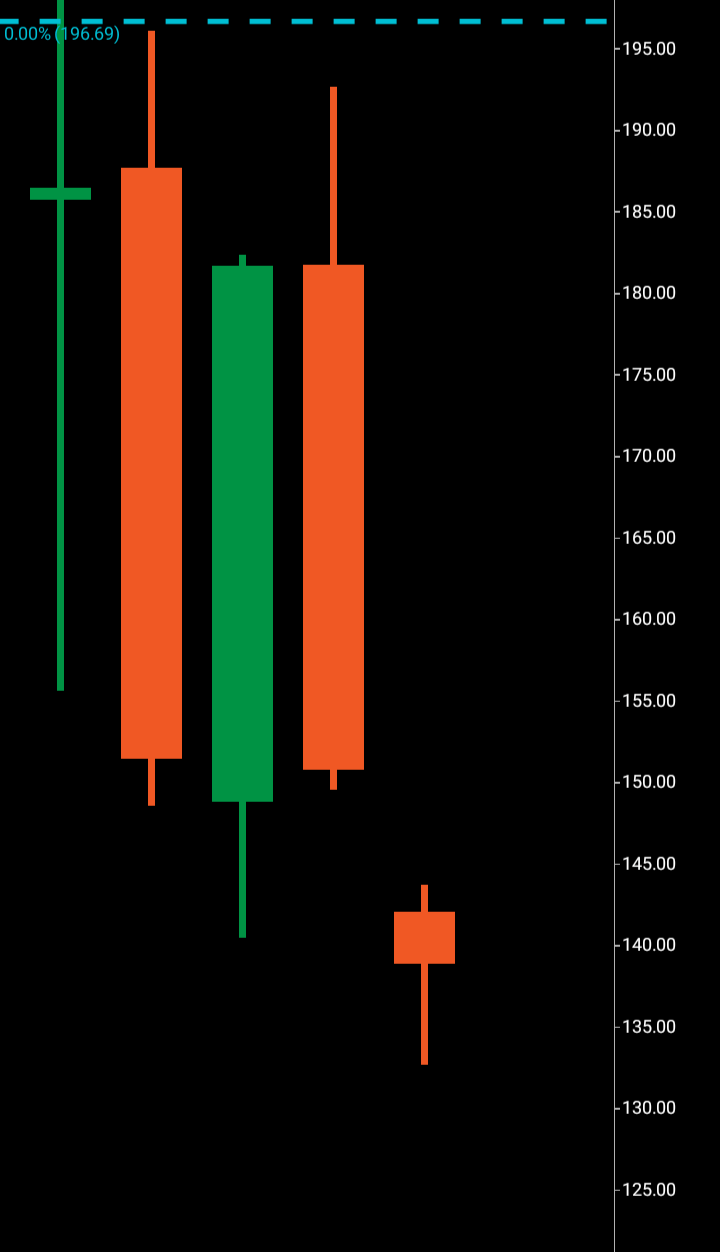
Also to note a gap down open for September, which can be perceived as very bearish intent, normally when a financial product gaps up or down, the market will at least drive price to the area it gapped from to cover the over the gap in price before making its decision, normally carrying on in the original direction the gap was created in. Gaps in bearish form mean there were no buying orders or that they were removed before the market opened and although not definitive, they can measure short term sentiment at least.
To finalize, I would expect Nvidia to continue south to first the $121 area, where I would be looking for turn around bullish signals. Failing this, the next target would be $68. Potentially arriving at target $121 within the next 60-90 days.
About the Three Wave Theory
The three wave theory was designed to be able to identify exact probable price action of a financial instrument. A financial market cannot navigate its way significantly higher or lower without making waves. Waves are essentially a mismatch between buyers and sellers and print a picture of a probable direction and target for a financial instrument. When waves one and two have been formed, it is the point of higher high/lower low that gives the technical indication of the future direction. A wave one will continue from a low to a high point before it finds significant enough rejection to then form the wave two. When a third wave breaks into a higher high/lower low, the only probable numerical target bearing available on a financial chart is the equivalent of the wave one low to high point. It is highly probable that the wave three will look to numerically replicate wave one before it makes its future directional decision. It may continue past its third wave target, but it is only the wave one evidence that a price was able to continue before rejection that is available to look to as a probable target for a third wave.
Be the first to comment