

INDU BACHKHETI/iStock via Getty Images
Introduction
2022 has likely been a disappointing year for all those who have investment stakes in the equity markets; if one were to breakdown different pockets of the S&P 500, one would discover that only one sector has managed to generate positive returns this year – The energy sector; the performances of all the other sectors have been in stark contrast to the former. Incidentally, the ETF I’m about to cover today, belongs to the worst-performing sector of the year – Communications services, which is down by 38%!
YCharts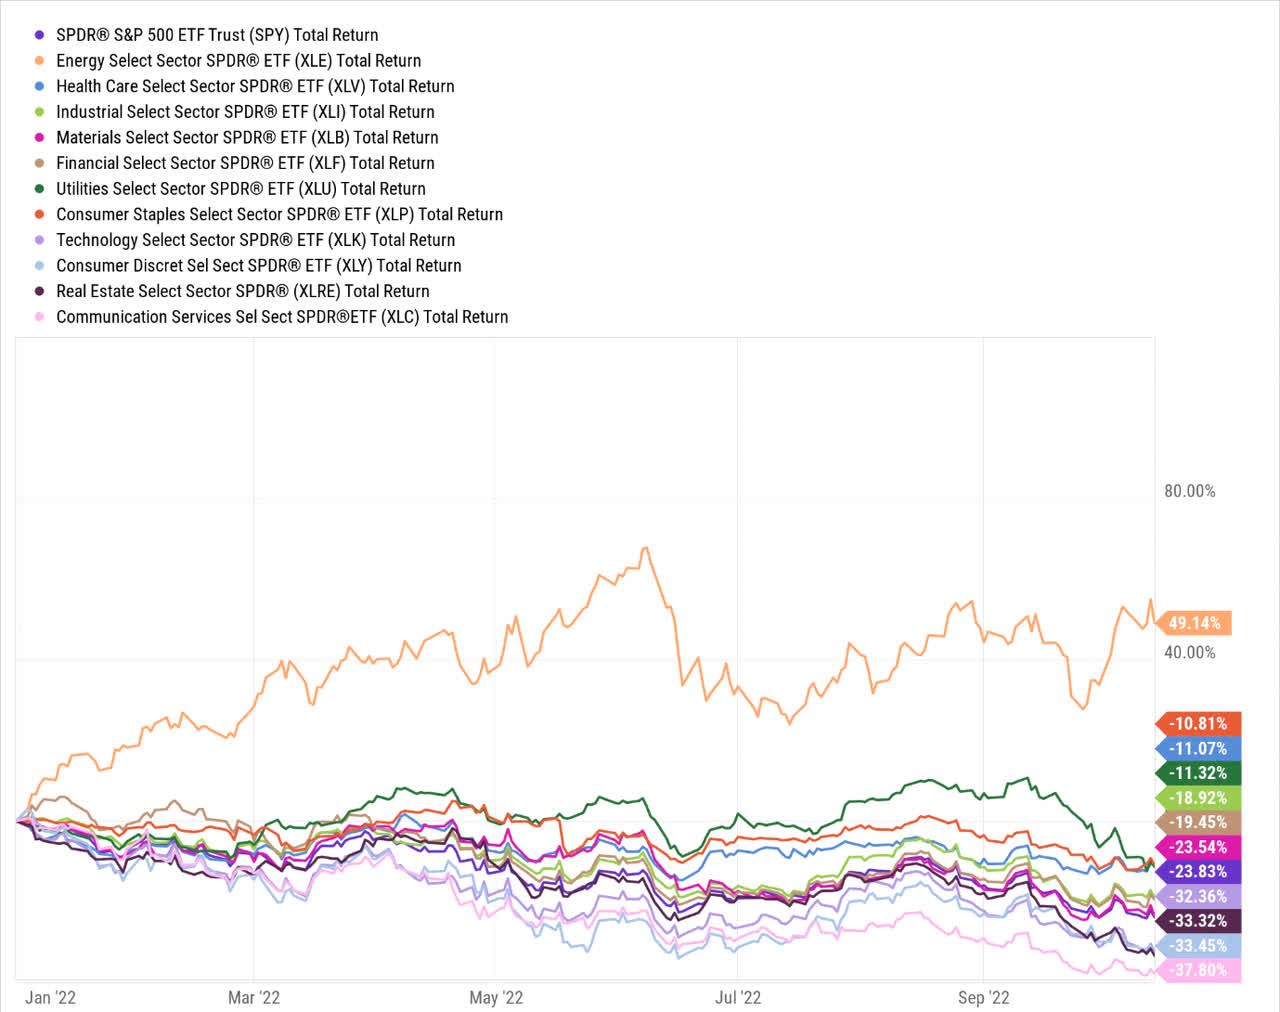
Granted, with liquidity conditions tightening by the day, and recessionary hues fast gathering pace, the environment isn’t too ideal for these communication services stocks to flourish. Besides, some of the major names in this space have lost their edge in certain markets where they previously enjoyed great pull. It also appears as though the previously buoyant customer acquisition metrics will likely slow going forward. All these factors would understandably call for some degree of de-rating in these stocks. We’ve seen that happen for much of this year, and I’d like to believe that at current prices, a lot of those risks are priced in.
Regardless, if you’re prepared to go against the tide and are fishing for suitable opportunities in this beaten-down space, I would like to pitch the Fidelity MSCI Communication Services Index ETF (NYSEARCA:FCOM), with roughly half a billion in AUM, which offers coverage to 117 odd stocks from the MSCI USA IMI Communication Services 25/50 Index.
Here are three reasons to consider FCOM.
Better Than Its Largest Peers
FCOM isn’t the most popular option in this space; there are two other larger ETFs – the Communication Services Select Sector SPDR ETF (XLC) with $7.7bn in AUM, and the Vanguard Communication Services ETF (VOX) with $2.4bn in AUM. Given some of FCOM’s structural benefits, as well as its performance track record and its ability to adroitly juggle risk and deliver returns, I believe it deserves more attention.
Firstly, as a structure, there are a lot of things going for it. It is the cheapest option in this space, with an expense ratio of just 0.08%. When it comes to the income theme, the communication services sector is clearly not the sector one should be fishing in but yet still, compared to its peers, FCOM still offers the best yield at current prices (1.34%). FCOM also covers the largest portfolio of stocks amongst the three options (117), and this would come in handy during drawdowns where your returns are not overly linked to a small batch of stocks, like XLC (just 27 names). FCOM like VOX also offers useful exposure to mid (11%) and small-cap stocks (5%) which give you higher earnings growth potential than the large-caps.
YCharts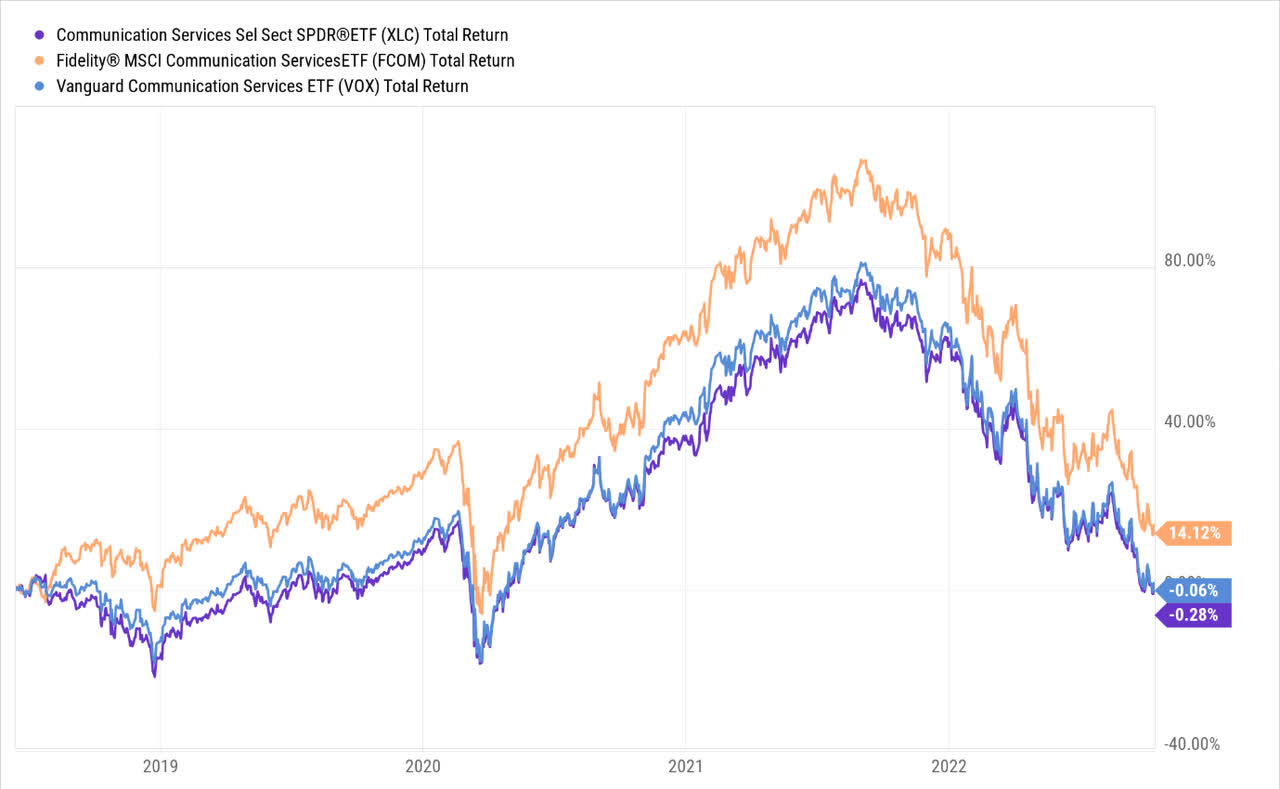
Hitherto, FCOM has also generated the highest returns since XLC came into being (XLC was only set up in June 2018). Incidentally, FCOM is the only one of the three to generate positive returns since then.
It isn’t just the superior return differential; also consider how effectively it juggles its risk profile whilst generating superior returns. Based on the annualized standard deviation metrics, we can see that XLC is the most volatile out of the lot. This could be on account of the fact that it covers the smallest number of stocks. Nonetheless, considering its heightened volatility, XLC does well to generate the highest Sharpe ratio (Excess returns over the risk-free rate as a function of the volatility) of the three. When it comes to FCOM, note that despite having a similar volatility profile to VOX, it comfortably generates a much superior Sharpe ratio, which is almost twice as good.
Crucially, do consider the Sortino ratios of all three products. This gives you a sense of how well these products deliver excess returns when faced with harmful volatility, much like what we’ve seen this year. Note that FCOM comes out as the clear winner on this front.
Seeking Alpha, YCharts, ETF.com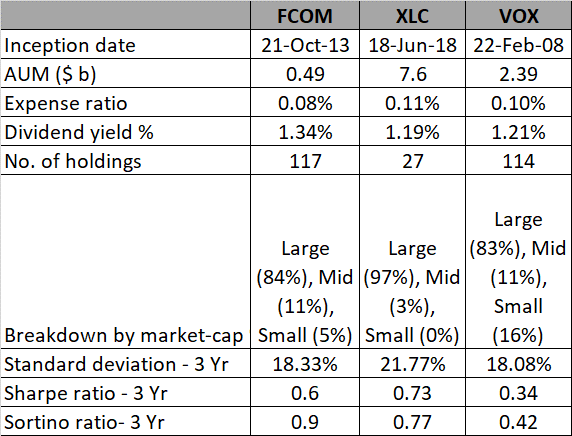
Forward Valuations Look More Palatable
A year ago, you could argue that some of FCOM’s names were trading at valuations that just didn’t make sense; that’s no longer the case, and in fact, the equation has shifted quickly towards the other end of the spectrum, where they now look remarkably cheap.
The image below highlights the forward valuations of the top 10 names of FCOM, relative to their own historical averages. As you can see, 8 out of the top 10 names of FCOM currently trade at discounts ranging from 31-71% relative to the 5-year averages. In effect, on a weighted average basis, the top 10 names can be picked up at a 33% discount to the 5-year forward P/E multiple of 28.2x.
Just considering the P/E alone may come across as an incomplete exercise; at the end of the day, the primary reason why investors chase these stocks is on account of the superior earnings runway that they facilitate. Given the deteriorating macros and a steepening cost of capital, can these stocks still deliver ample earnings growth? Do the P/Es make sense in light of the earnings growth? To answer that, we consider the forward PEG ratio.
Whilst the results are not as widespread as the P/E results, we can still see that 6 out of the 10 names currently trade at PEG valuation discounts (relative to the 5-year averages). Besides, on a weighted average basis, the top 10 names currently trade at a forward PEG of 1.87, a 10% discount over the long-term average.
Seeking Alpha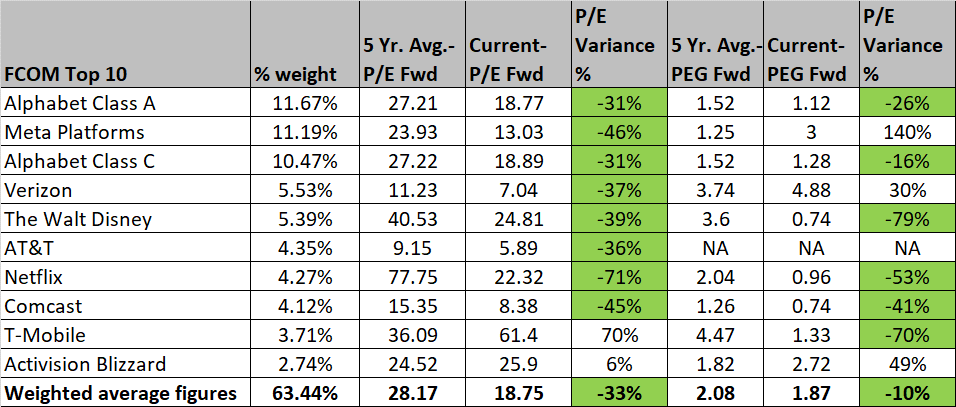
Good Risk-Reward On The Charts
Finally, I would point to the attractive risk-reward that can be gleaned from the relative strength chart and the standalone chart. The first chart highlights how overextended to the downside FCOM looks relative to its peers from the total stock market. The ratio is currently at lifetime lows and a good 24% away from the mid-point of the zone. If one sees a strong melt-up move, FCOM could be one of the chief beneficiaries.
StockCharts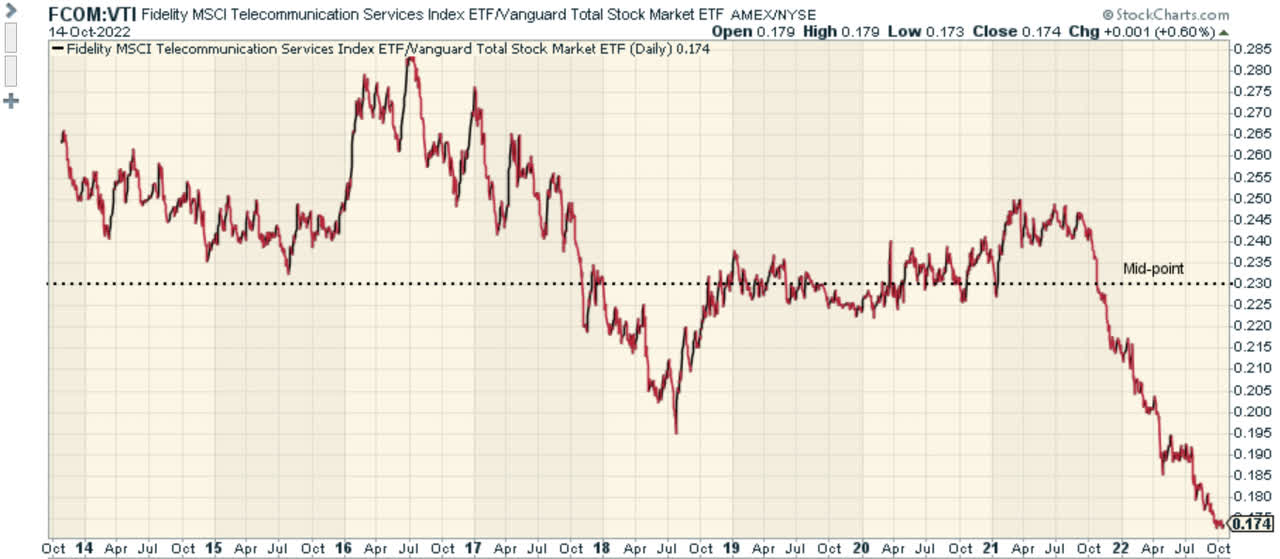
Investing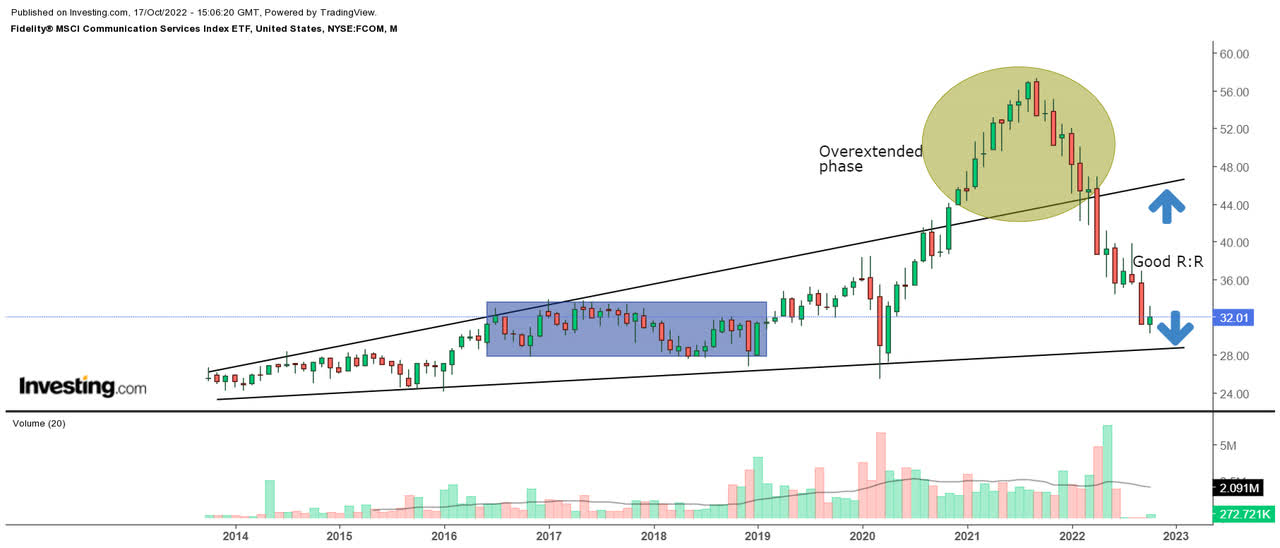
On the standalone chart, we can see that the FCOM has well and truly shaken off some of the upside excesses that were seen from November 2020 until March 2022; during this period, the ETF had surged well above the upper boundary of the ascending wedge. Currently, the price action has dropped to levels not too far away from the lower end of the wedge, and it also coincides with the congestion zone seen from H2-2016 till the end of 2018. There’s a good chance we see some bottom formation close to the current levels.
Be the first to comment