

That’s a tasty idea. Allen yu/iStock via Getty Images
Get ready for charts, images, and tables because they are better than words. The ratings and outlooks we highlight here come after Scott Kennedy’s weekly updates in the REIT Forum. Your continued feedback is greatly appreciated, so please leave a comment with suggestions.
Lately we’ve been talking to investors about preferred shares. It’s time to discuss the common shares. We added to our very small position in Granite Point Mortgage Trust (GPMT). These shares are extremely cheap, but this is also a high-risk pick. In these situations, I find the risk/reward on a very small allocation is attractive, while the risk from a large allocation could be too great.
Sometimes that concept confuses investors because they only look at the idea in isolation. I’ll give an example.
Example
Say you have an investment opportunity that will only take one day to deliver returns. It has a 60% chance of doubling and a 40% chance of going to zero. Your expected value on the trade would be a 20% return. That’s the weighted average of the outcomes. Your dollar either becomes $2 or it becomes $0, but it becomes $2 more often so the weighted average is $1.2. If you’re sitting down at a poker table, you take those odds every time. If you’re sitting down at a poker table, you’re only carrying cash you can afford to lose.
While some analysts would say people should “only invest what they can afford to lose”, that’s simply not practical. Real returns on Treasuries and savings accounts are often negative. What investor can actually save up enough for their lifetime using only investments that carry a negative real return? How different would retirement planning look if we assume the investor earns a negative return every year? Retiring indefinitely would be impossible.
Avoiding Big Hits
With that in mind, we need to recognize the importance of not taking big hits. If an investor puts their entire portfolio into one trade with those odds, 40% of them get wiped out. That’s it. Game over. Back to work.
However, if the investor’s portfolio was split between 1,000 of those opportunities with zero correlation, they would expect to win between 560 and 640. They would expect to achieve a return near the 20% implied by the weighted average.
The point here is that it is worth taking on a few higher-risk positions within the portfolio.
GPMT
The potential returns profile for GPMT is nowhere near as binary as that example. Investors are unlikely to promptly double their investment or lose it. However, there is the potential for much higher volatility. Consequently, we’re building our allocation with small purchases. We want to recognize the higher risk level in this macro environment. GPMT has some poor loans and will face impairments on some of those loans. They’ve already taken some material reserves to reflect projected losses, but we want to be explicit about the downsides.
Despite requiring a significant discount to real estate values when writing loans, GPMT took on too much exposure to weaker property types and it’s taken a toll on book value and earnings. However, we still see an attractive risk/reward profile so long as the allocations are small. The price-to-book ratio is low enough to price in a significant decrease in the value of GPMT’s assets across the board. Most of those assets are unlikely to take any hit, though a few will take significant hits.
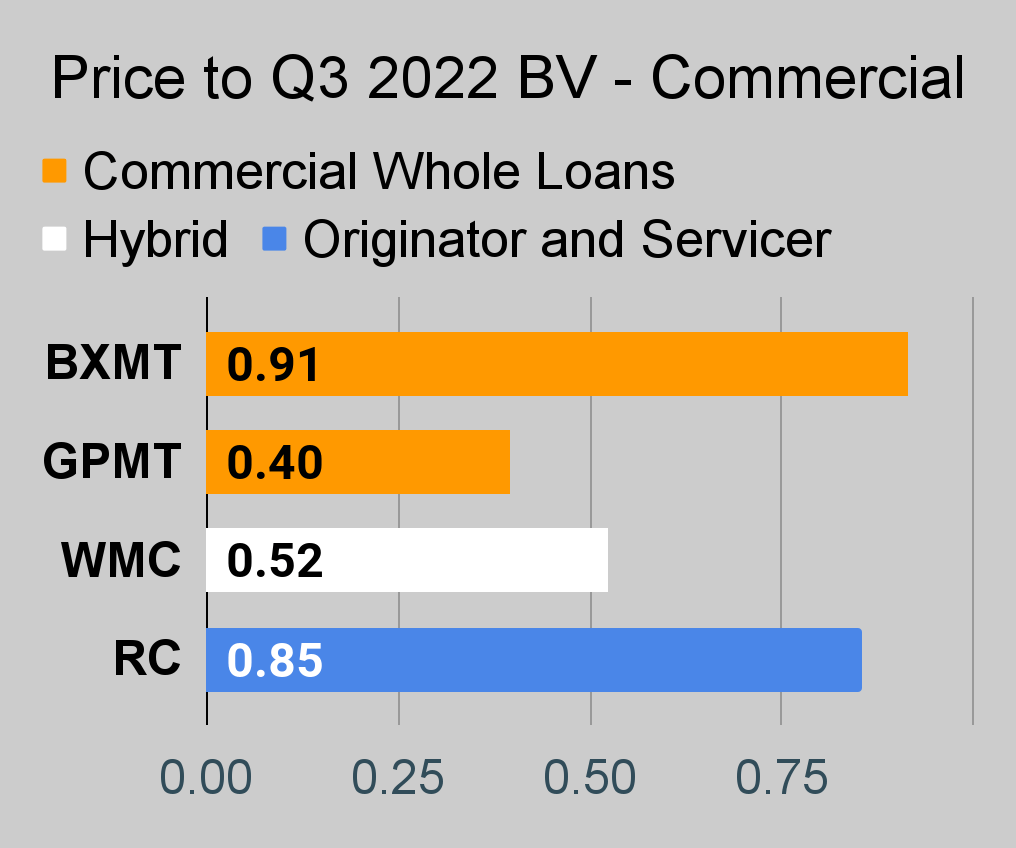
We wouldn’t be recommending GPMT at all if the price-to-book ratio was high. However, our purchase carried a price-to-book ratio around .36. Shares have rallied some since then, but the price-to-book ratio is still about .40. That remains very low.
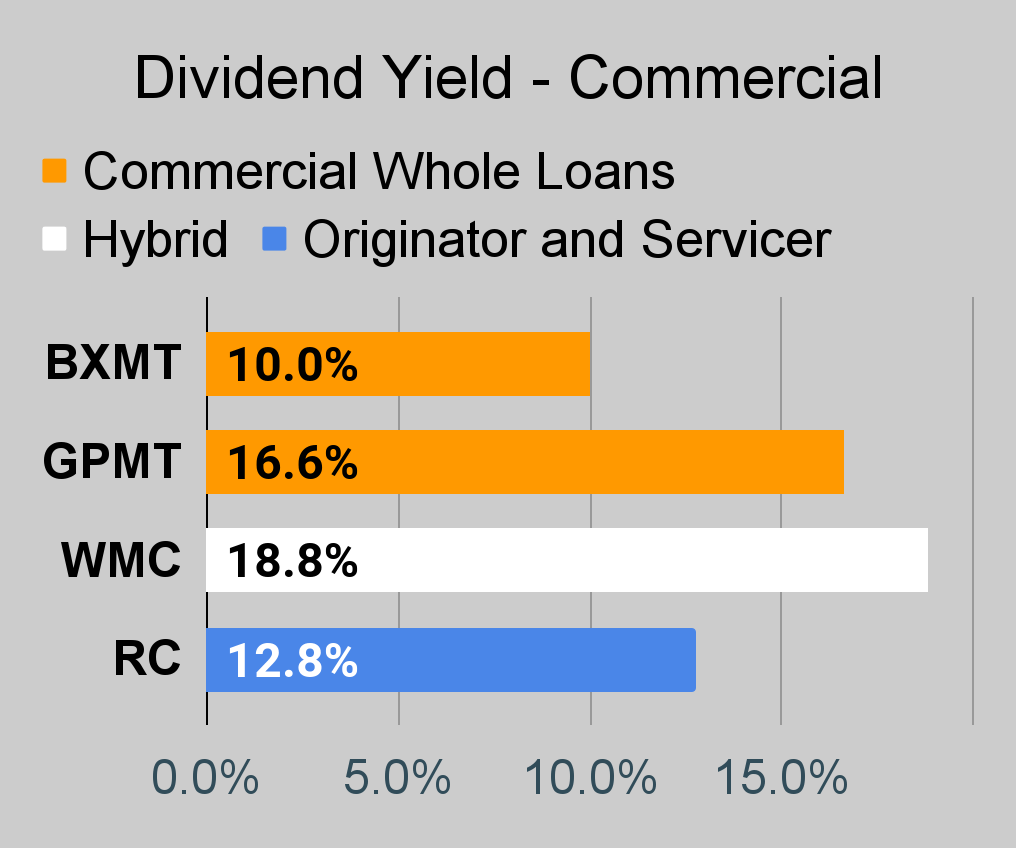
It’s also worth pointing out that there is significant risk in the dividend. Currently the yield is 16.6%, but that could be reduced as earnings have been weak. It’s not certain either way. Even with a significant reduction, we could still be looking at a double-digit yield.
Those earnings could recover some as they were squeezed in a pretty rough place between the floors on loans and the rising costs of debts combined with setting their worst loans to non-accrual status. Those loans have already been written down significantly. The book value we’re discounting from is the book value that remains after projecting material losses on those loans. Further, GPMT could get an attractive earnings yield on repurchasing shares or buying back some of their preferred shares.
Below is an abbreviated version of the trade alert we sent to subscribers:
Trades Placed
- Purchased 478 shares of Granite Point Mortgage Trust at $5.5799.
Execution
The trade went through Fidelity:
Fidelity
Returns for Open Positions
The REIT Forum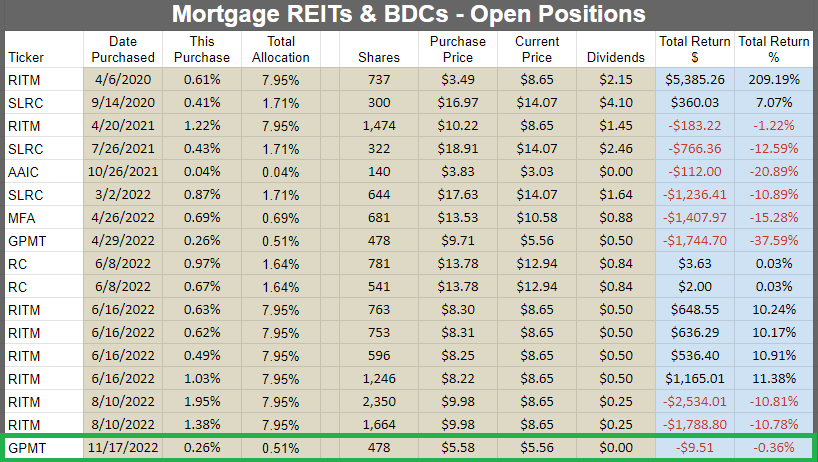
Notice that this purchase doubled our position, but only increased it from 0.26%. GPMT looks very cheap here, yet we’ve remained extremely cautious with the high-risk shares. Given the latest plunge in the share price, I felt it made sense to double my allocation.
Conclusion
GPMT is one of the higher-risk mortgage REITs. However, a price-to-book ratio of around 0.36 is low enough to provide the potential for substantial gains. With such high risk, I wouldn’t want to risk a large chunk of our portfolio. However, I do think it merits an allocation for small trading positions.
I’d love to see management get more intelligent about running the REIT. They have an absolutely massive discount on common shares and a very large discount on preferred shares. The yield on simply repurchasing preferred shares (9.77% stripped yield today with an eventual floating rate) is comparable to the best they could hope to generate from leveraging their net interest spread and it would reduce risk to common shareholders (less total leverage).
Repurchasing common shares would also be a huge winner. While their leveraged net interest spread income on book value is weak, it would be far better if book value was acquired near 36% of the actual book value. Simply put, GPMT doesn’t deserve to trade at book value. However, they could trade quite a bit higher than 36% of book value.
Management indicated that they expect origination volume to remain low, though I think they would be better off limiting originations to loans already under contract and refinancing non-accrual loans when new buyers come in with enough equity.
Scott recently provided subscribers with a far more in-depth review of GPMT’s Q3 2022 earnings results.
We do not expect to be in shares forever. We’re here to catch a rally in the share price.
Previously, we sold off our shares of GPMT on 5/5/2021 and 6/16/2021 at $13.19 and $15.49. Those trades resulted in total returns of 139% and 178%. I don’t expect to hit it out of the park like that again, but we were rewarded for buying during the panic. Those shares had a cost basis of $5.89 and we collected $.90 in dividends in addition to the capital gain.
Now go out there and have a great Thanksgiving.
Stock Table
We will close out the rest of the article with the tables and charts we provide for readers to help them track the sector for both common shares and preferred shares.
We’re including a quick table for the common shares that will be shown in our tables:
Let the images begin!
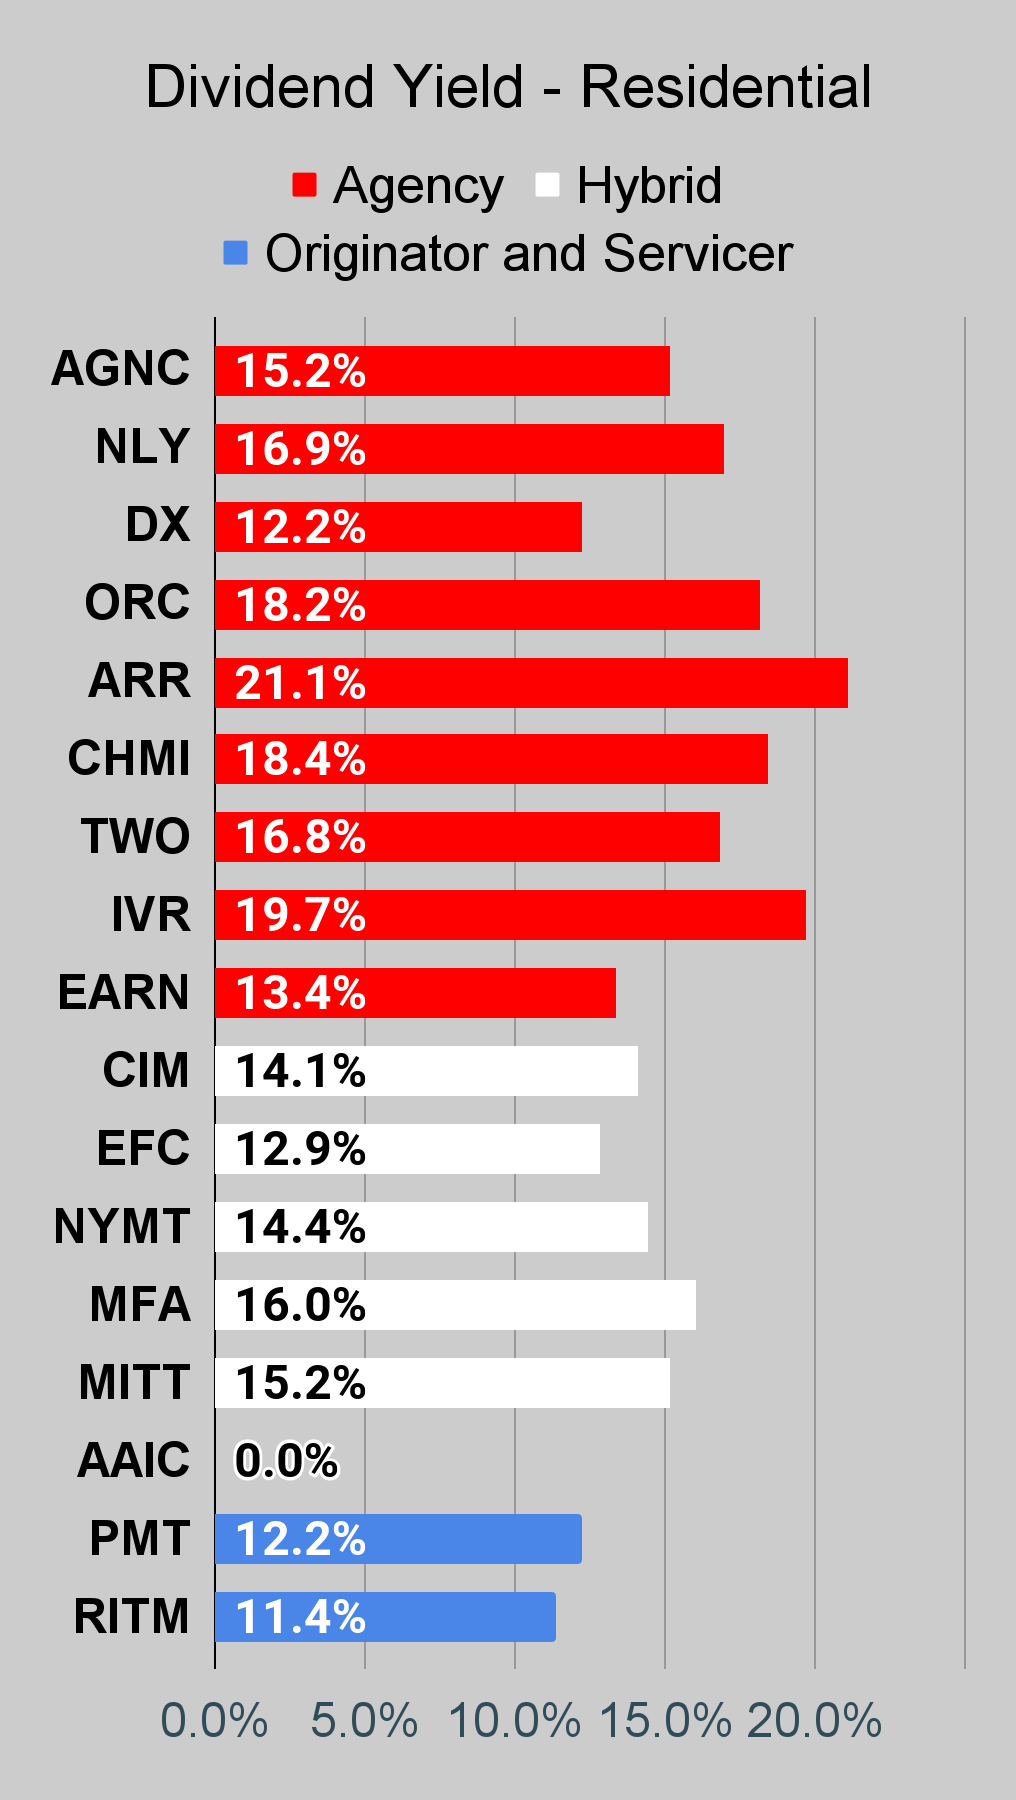
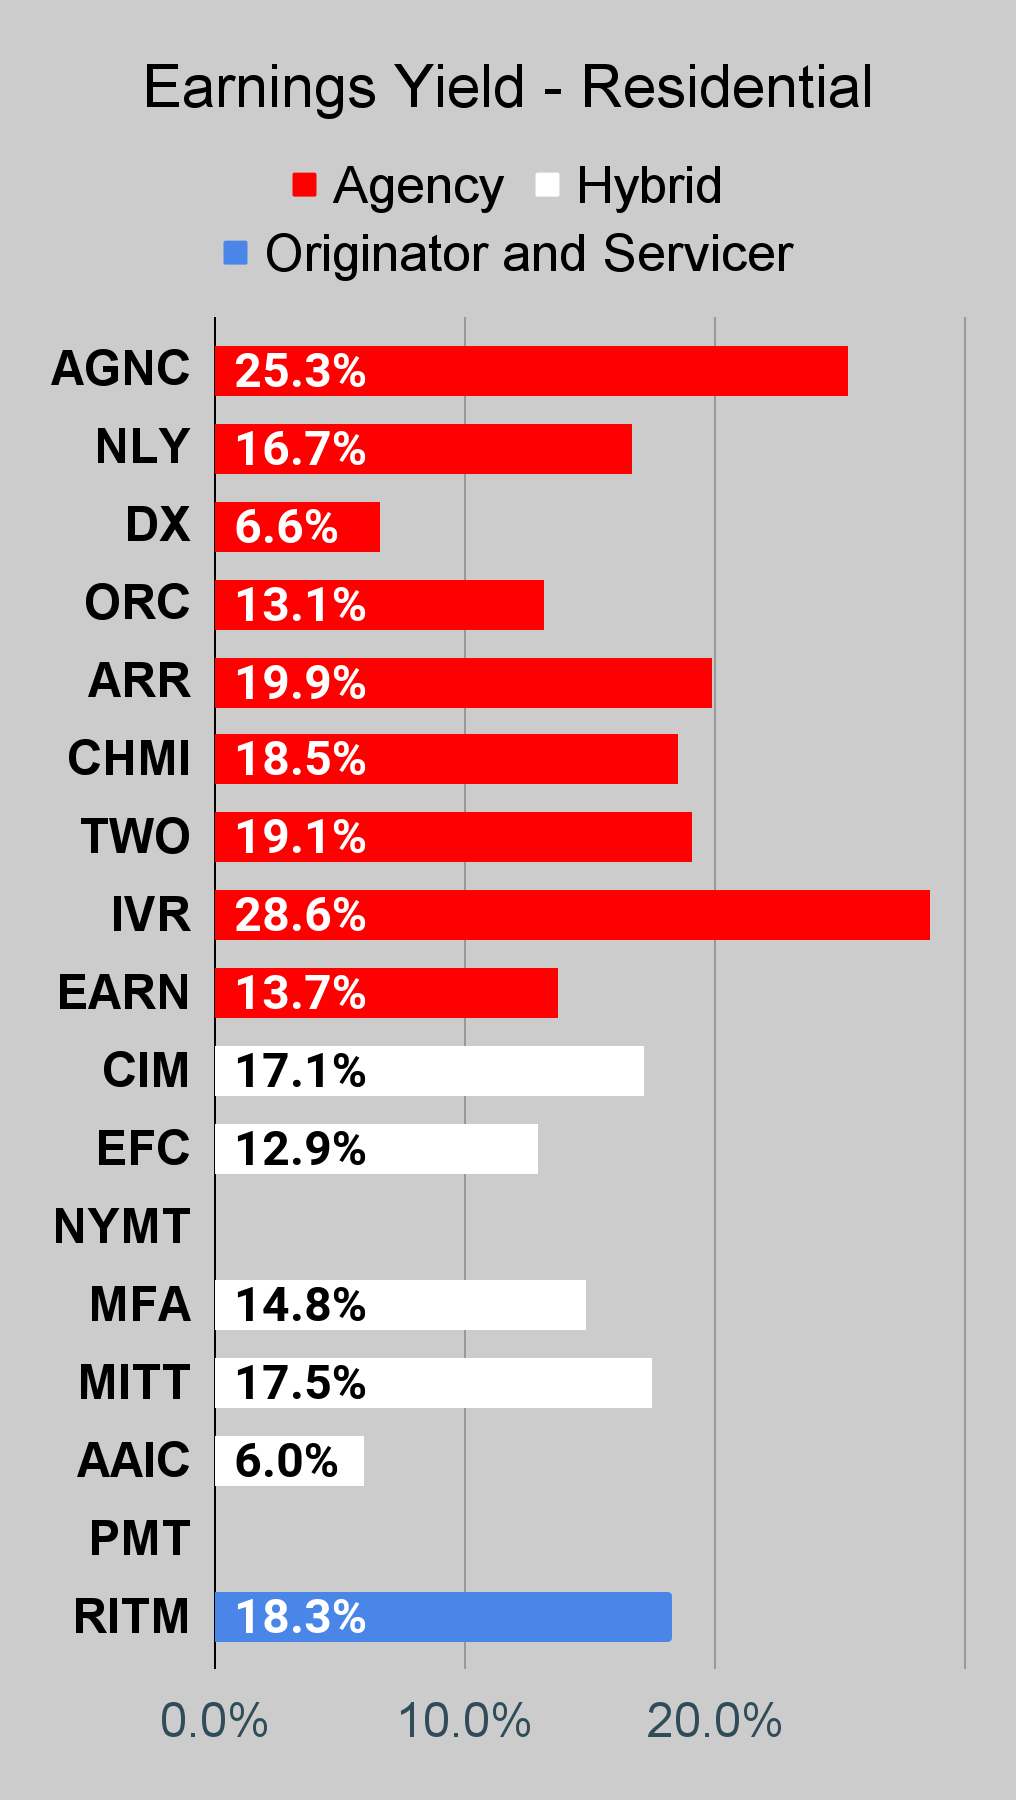
Residential Mortgage REIT Charts
Note: The chart for our public articles uses the book value per share from the latest earnings release. Current estimated book value per share is used in reaching our targets and trading decisions. It is available in our service, but those estimates are not included in the charts below. PMT and NYMT are not showing an earnings yield metric as neither REIT provides a quarterly “Core EPS” metric.
 The REIT Forum |
 The REIT Forum |
 The REIT Forum |
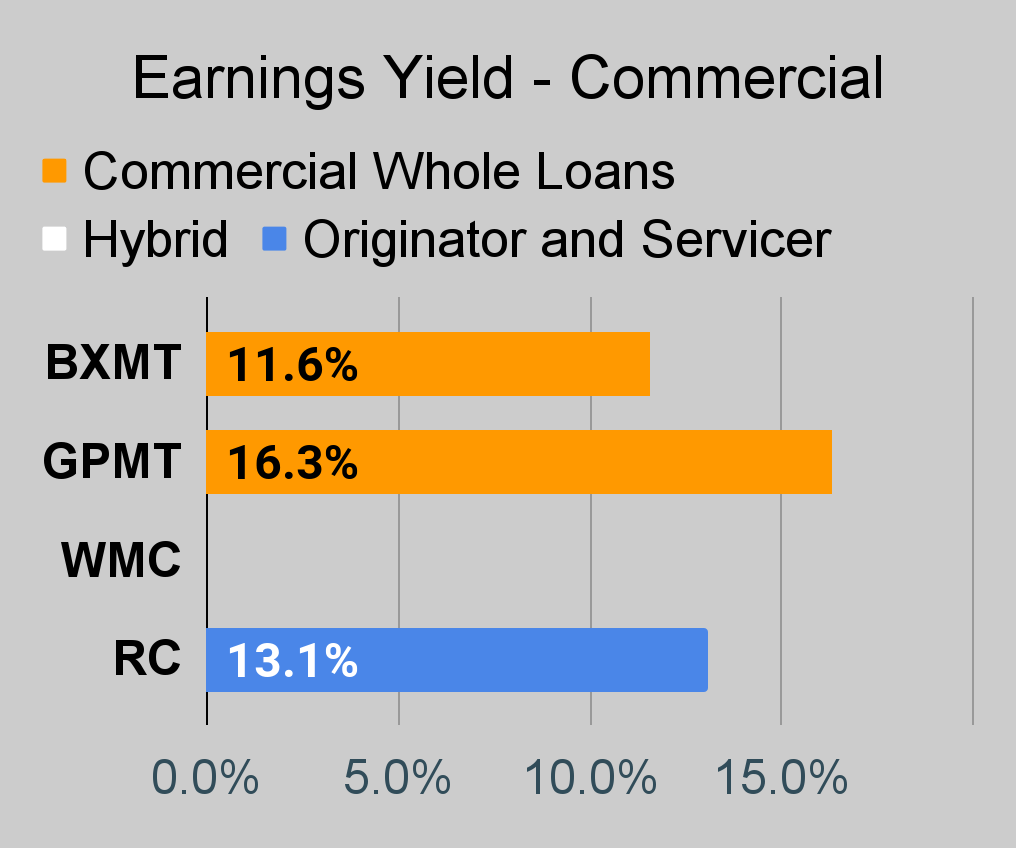
Commercial Mortgage REIT Charts
 The REIT Forum |
 The REIT Forum |
 The REIT Forum |
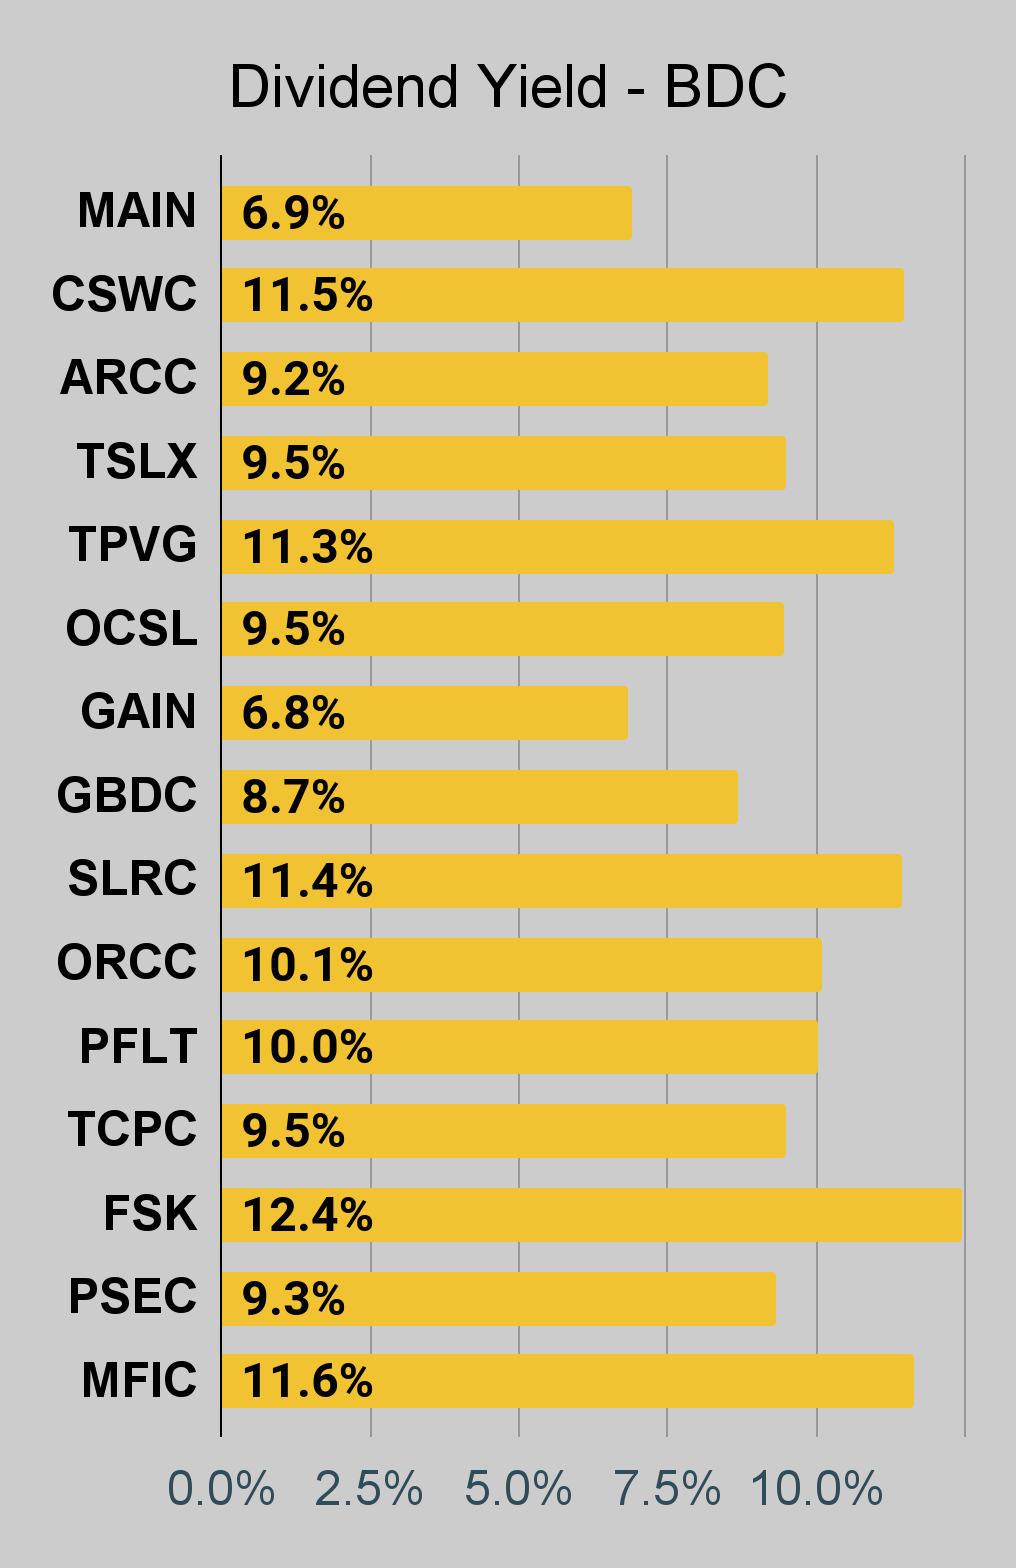
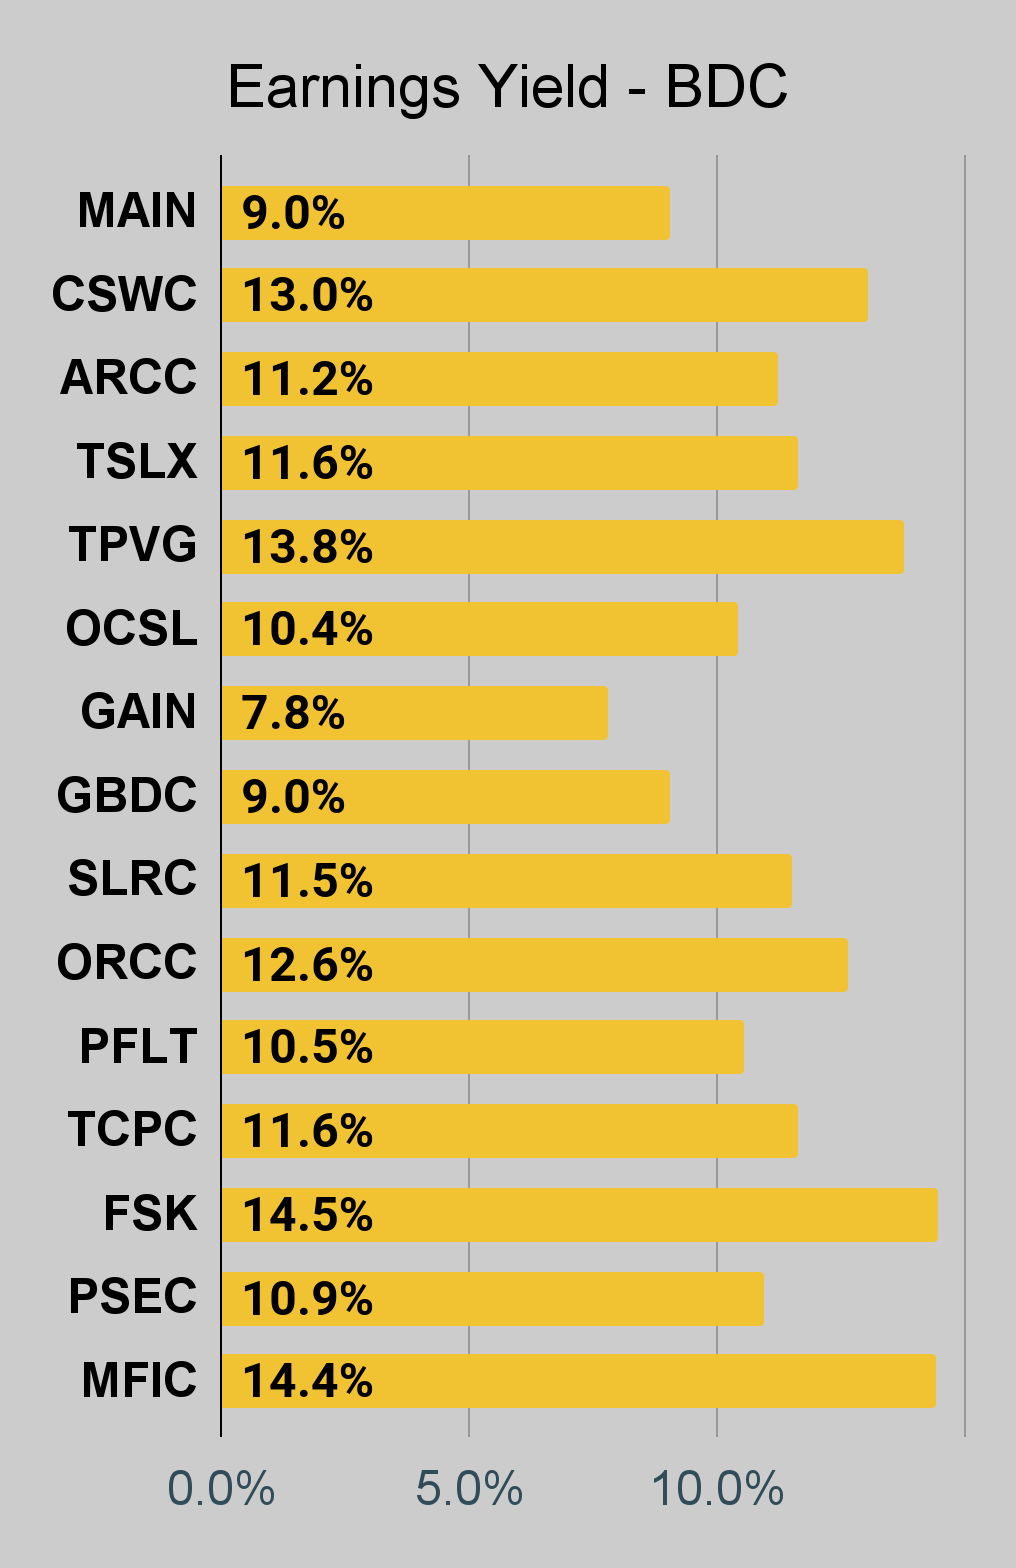
BDC Charts
 The REIT Forum |
 The REIT Forum |
 The REIT Forum |
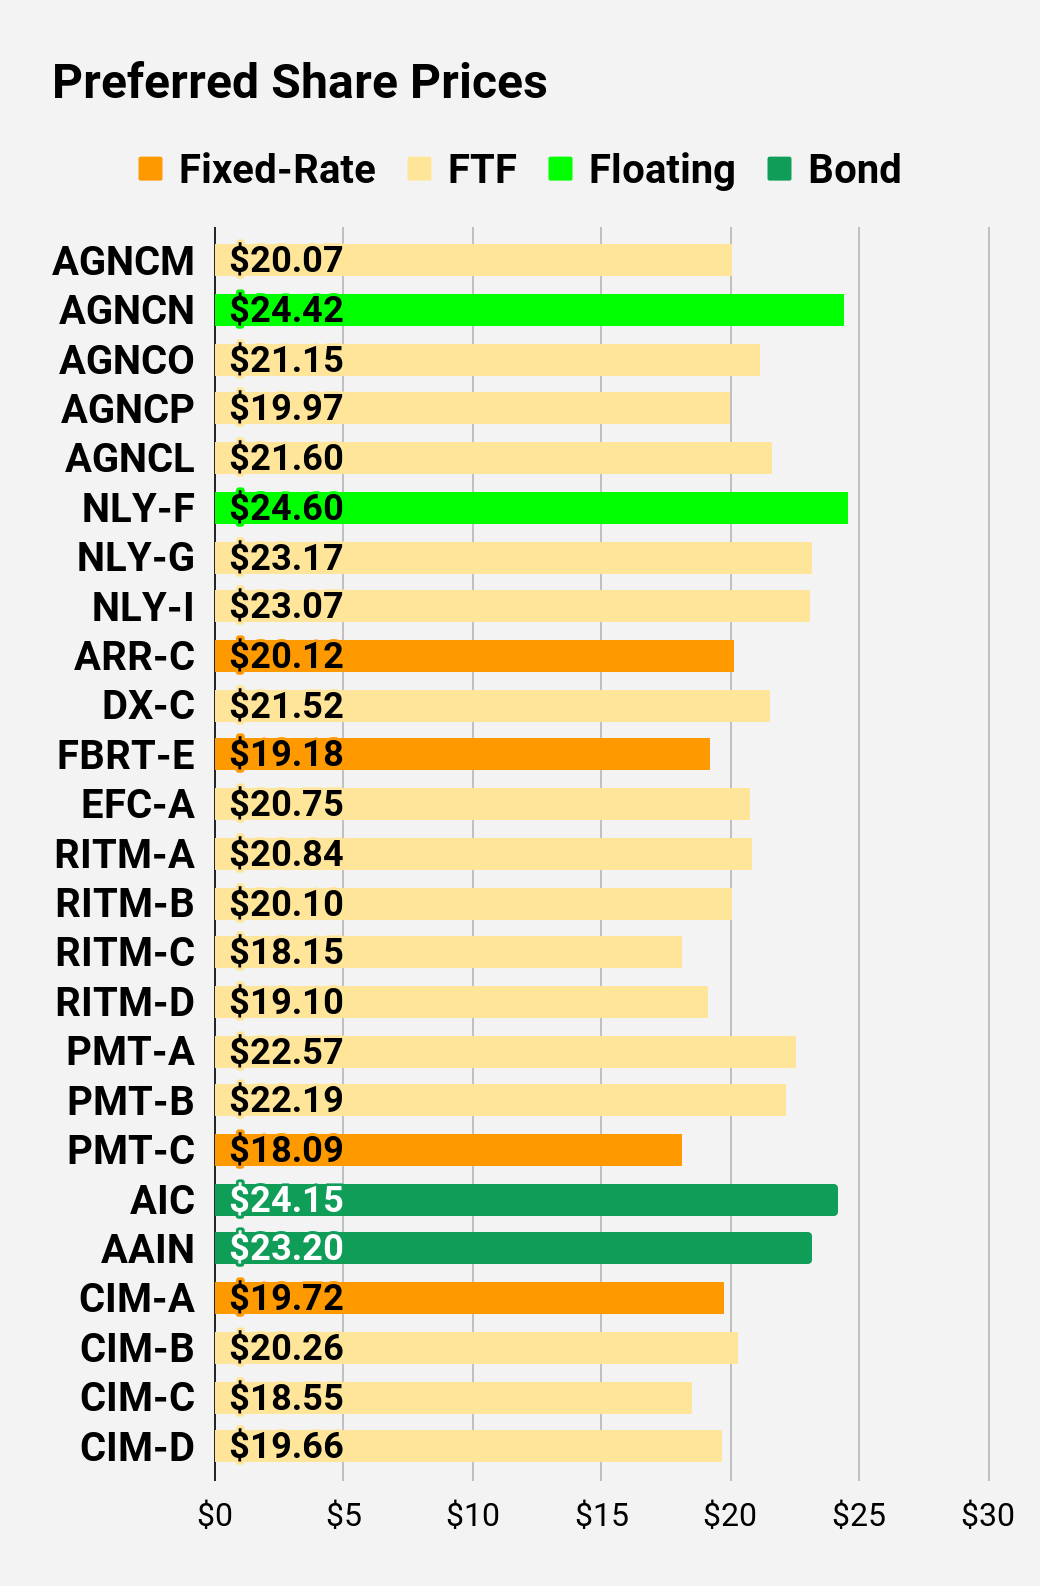
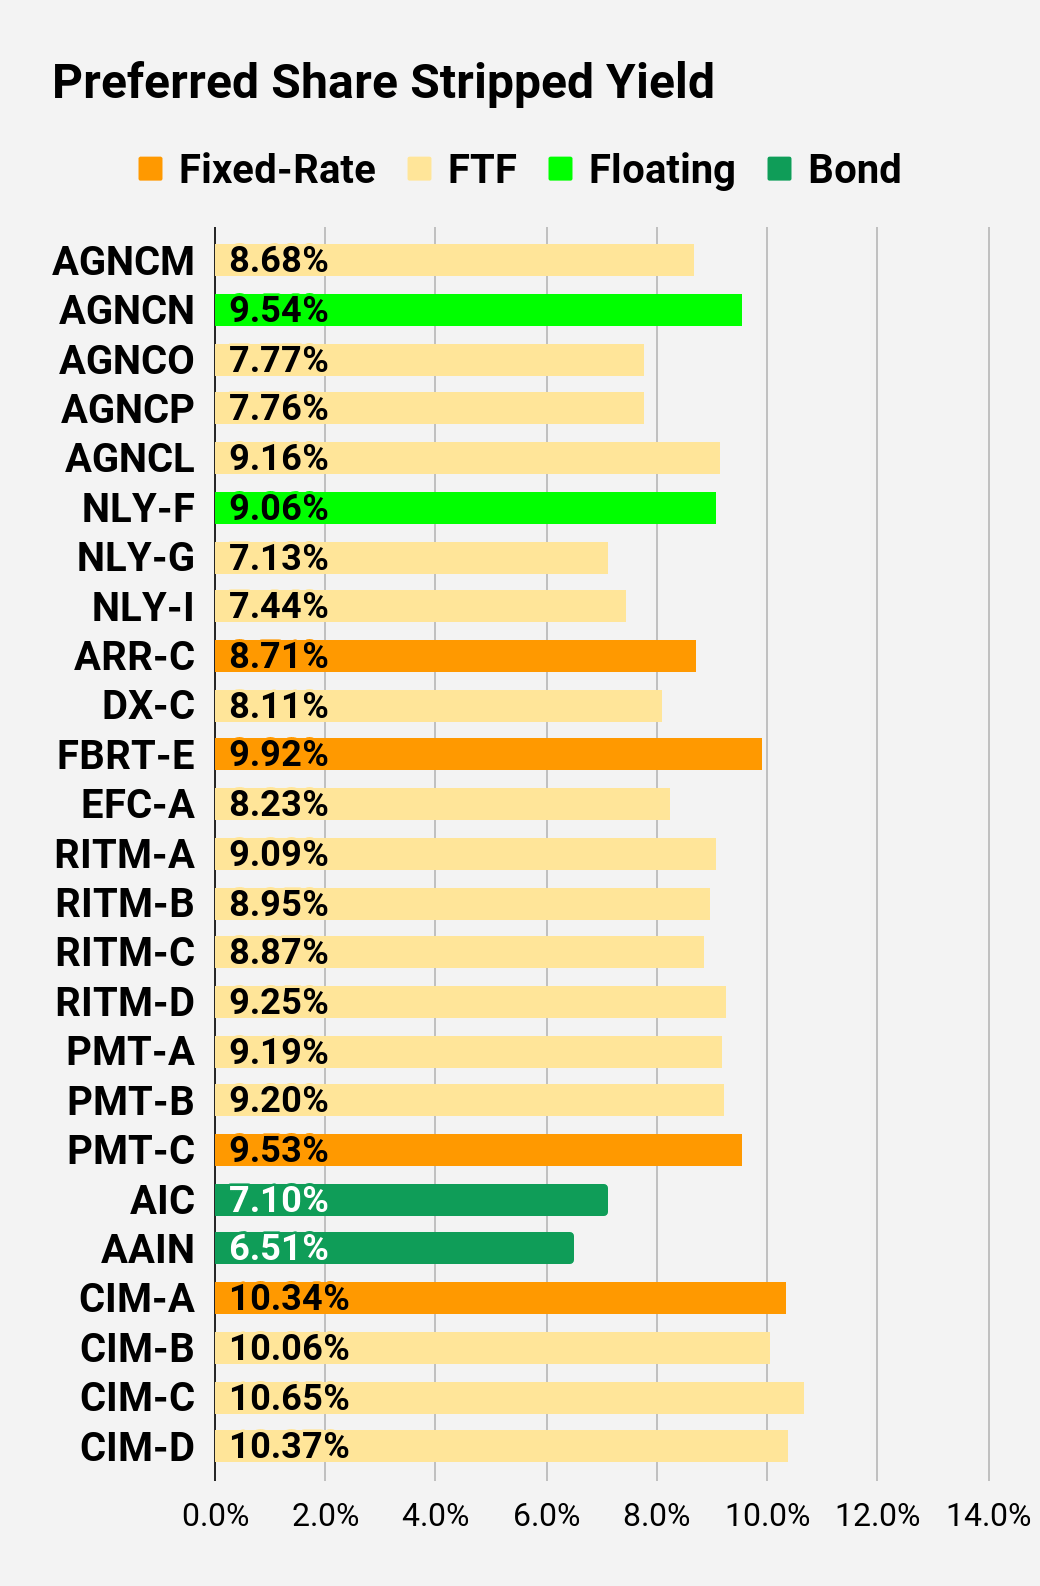
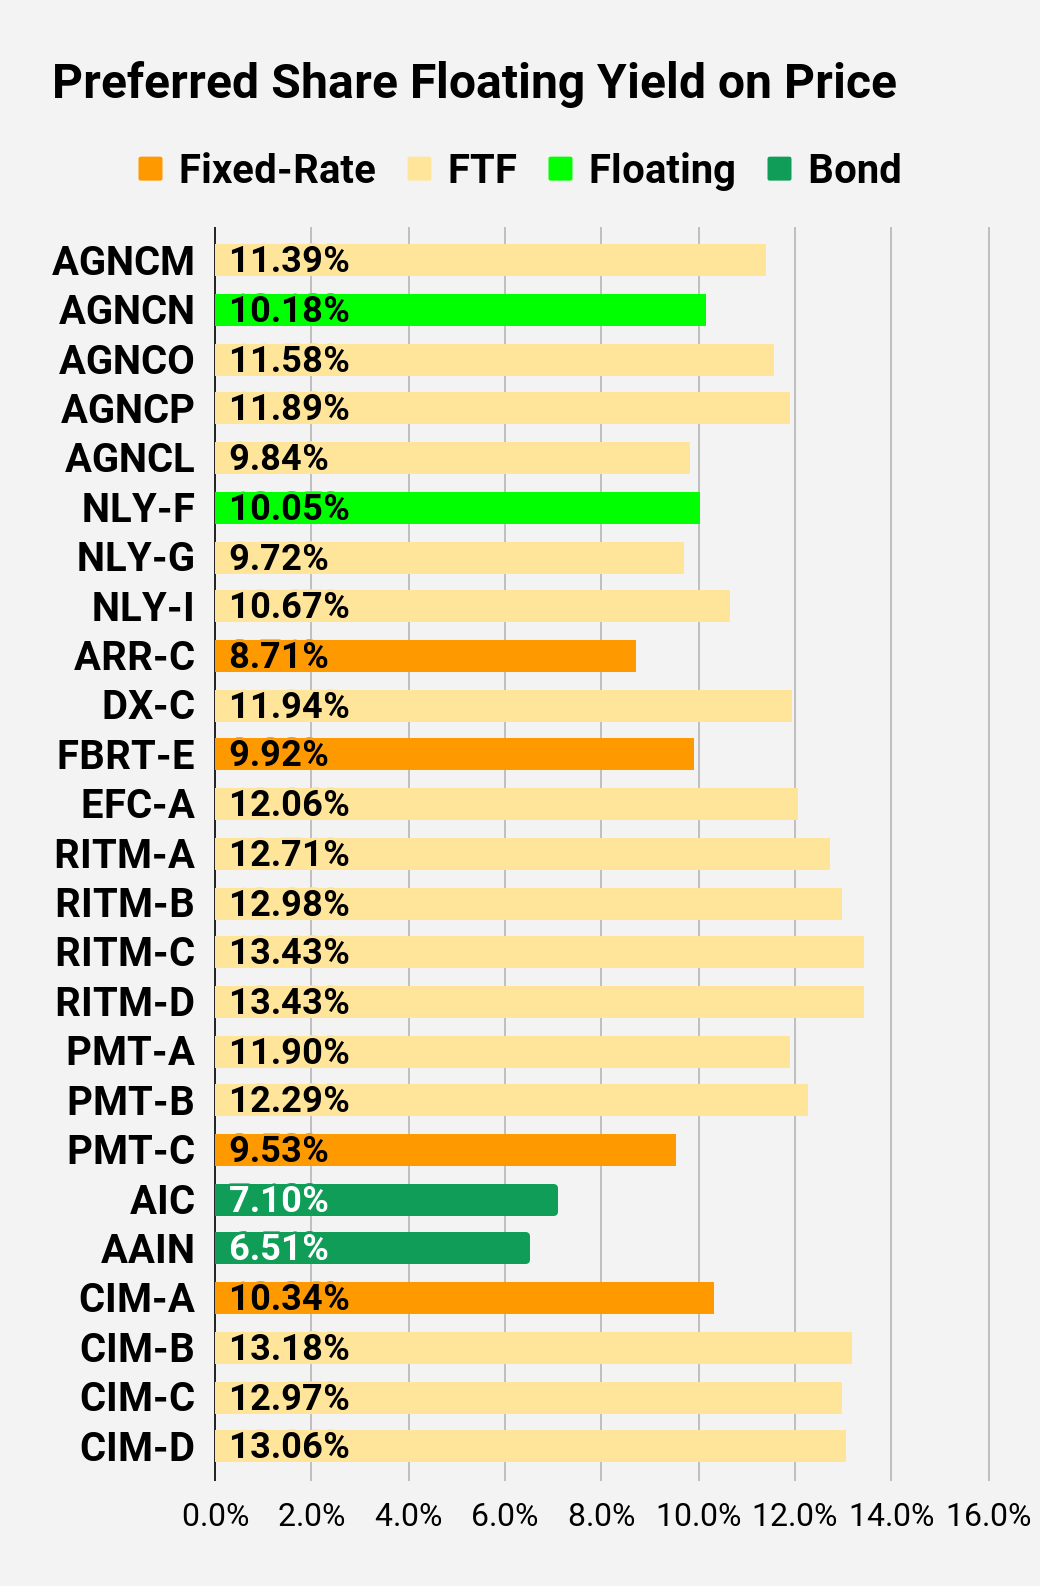
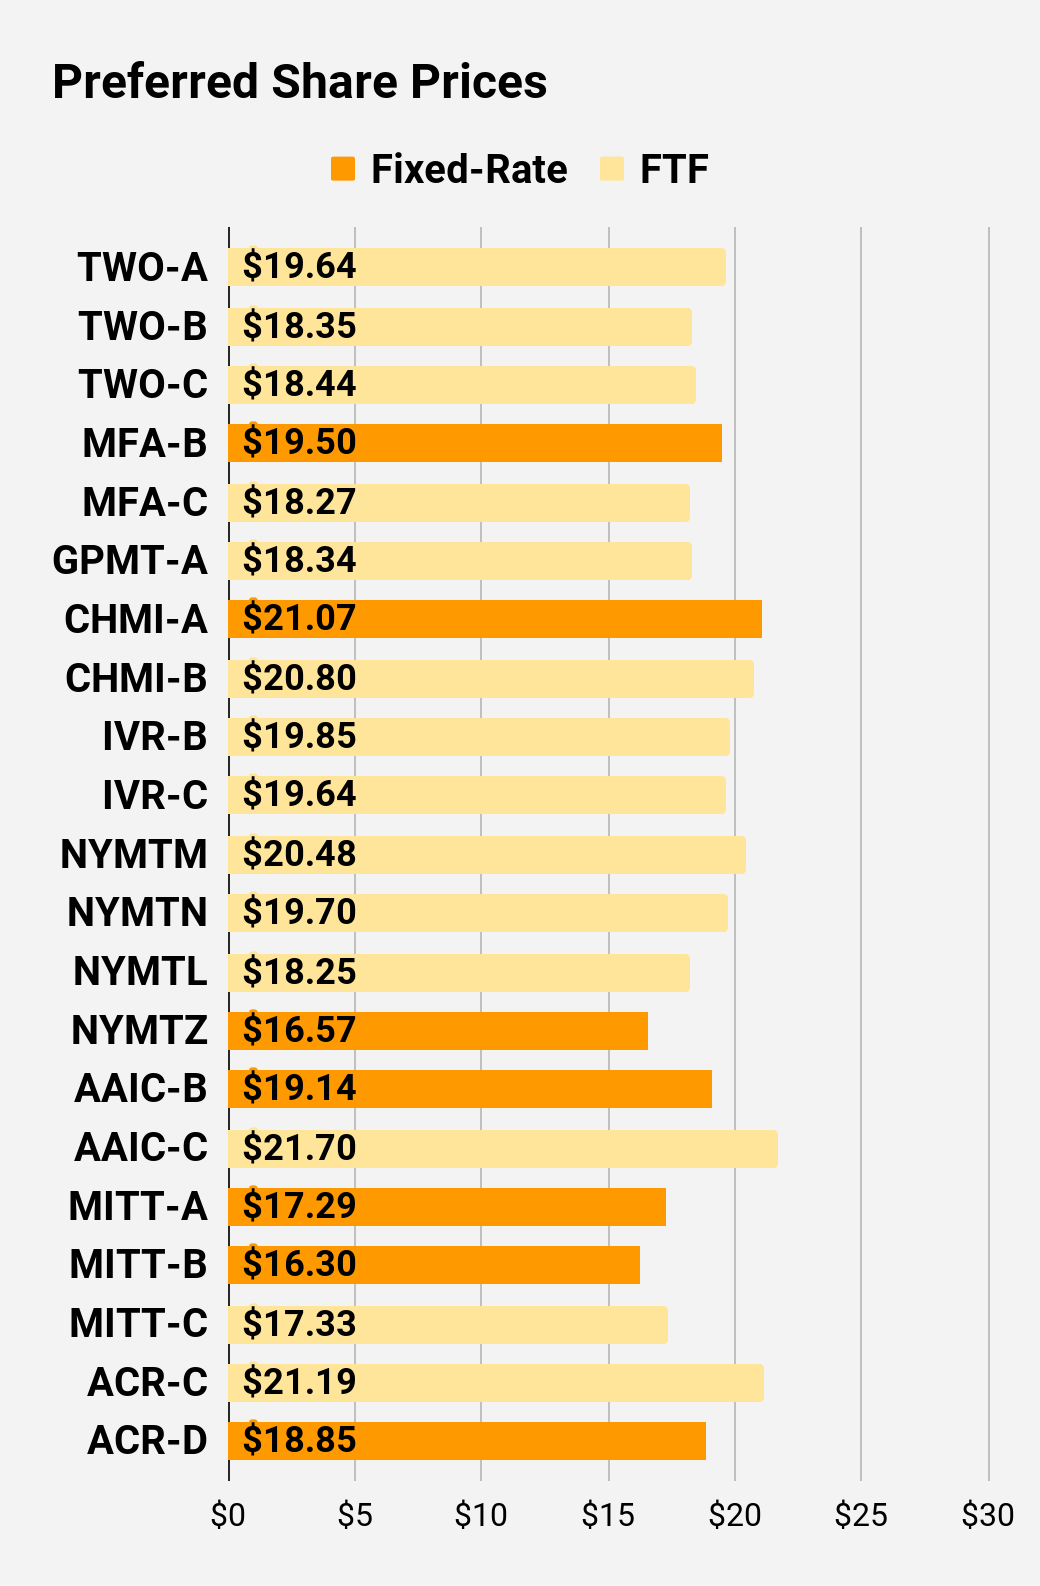
Preferred Share Charts
I changed the coloring a bit. We needed to adjust to include that the first fixed-to-floating shares have transitioned over to floating rates. When a share is already floating, the stripped yield may be different than the “Floating Yield on Price” due to changes in interest rates. For instance, NLY-F already has a floating rate. However, the rate is only reset once per 3 months. The stripped yield is calculated using the upcoming projected dividend payment and the “Floating Yield on Price” is based on where the dividend would be if the rate reset today. In my opinion, for these shares the “Floating Yield on Price” is clearly the more important metric.
 The REIT Forum |
 The REIT Forum |
 The REIT Forum |
 The REIT Forum |
 The REIT Forum |
 The REIT Forum |
Preferred Share Data
Beyond the charts, we’re also providing our readers with access to several other metrics for the preferred shares.
After testing out a series on preferred shares, we decided to try merging it into the series on common shares. After all, we are still talking about positions in mortgage REITs. We don’t have any desire to cover preferred shares without cumulative dividends, so any preferred shares you see in our column will have cumulative dividends. You can verify that by using Quantum Online. We’ve included the links in the table below.
To better organize the table, we needed to abbreviate column names as follows:
- Price = Recent Share Price – Shown in Charts
- BoF = Bond or FTF (Fixed-to-Floating)
- S-Yield = Stripped Yield – Shown in Charts
- Coupon = Initial Fixed-Rate Coupon
- FYoP = Floating Yield on Price – Shown in Charts
- NCD = Next Call Date (the soonest shares could be called)
- Note: For all FTF issues, the floating rate would start on NCD.
- WCC = Worst Cash to Call (lowest net cash return possible from a call)
- QO Link = Link to Quantum Online Page
Second Batch:
Strategy
Our goal is to maximize total returns. We achieve those most effectively by including “trading” strategies. We regularly trade positions in the mortgage REIT common shares and BDCs because:
- Prices are inefficient.
- Long-term, share prices generally revolve around book value.
- Short-term, price-to-book ratios can deviate materially.
- Book value isn’t the only step in analysis, but it is the cornerstone.
We also allocate to preferred shares and equity REITs. We encourage buy-and-hold investors to consider using more preferred shares and equity REITs.
Performance
We compare our performance against 4 ETFs that investors might use for exposure to our sectors:
The REIT Forum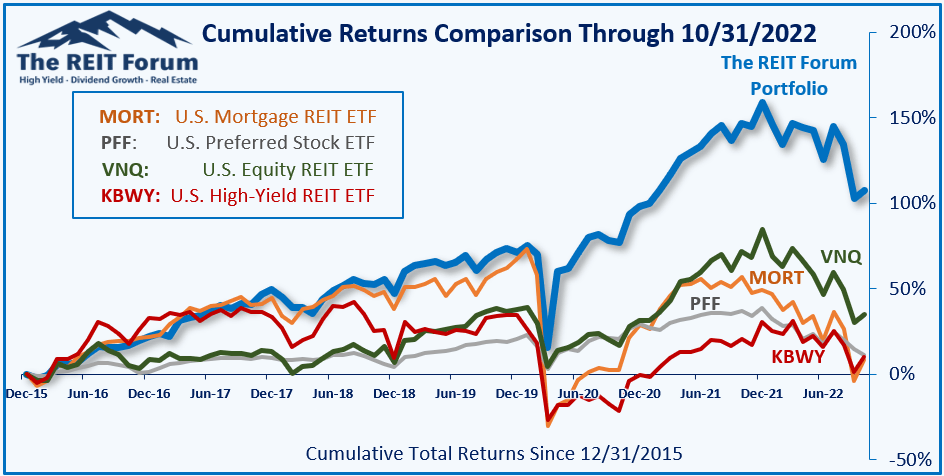
The 4 ETFs we use for comparison are:
|
Ticker |
Exposure |
|
One of the largest mortgage REIT ETFs |
|
|
One of the largest preferred share ETFs |
|
|
Largest equity REIT ETF |
|
|
The high-yield equity REIT ETF. Yes, it has been dreadful. |
When investors think it isn’t possible to earn solid returns in preferred shares or mortgage REITs, we politely disagree. The sector has plenty of opportunities, but investors still need to be wary of the risks. We can’t simply reach for yield and hope for the best. When it comes to common shares, we need to be even more vigilant to protect our principal by regularly watching prices and updating estimates for book value and price targets.
Ratings:
Bullish on GPMT. Suggesting limited allocation sizes due to the potential for volatility. I wouldn’t buy shares unless I thought they were worth the risk. That should be pretty obvious.
Be the first to comment