

The United States is the world’s leading producer and exporter of corn to the world. The tall annual cereal grass is an ingredient in a wide range of foods for humans and feeds for livestock. Corn is also a source of biofuel, and processors use the coarse grain to manufacture a variety of useful chemicals.
Each year, the weather conditions across the fertile plains of the United States determine the path of least resistance for the price of corn and other agricultural commodities. In 2012, drought conditions in the US sent the price of nearby corn futures to $8.4375 per bushel, an all-time high for the price of the commodity. Over the past seven years, bumper crops that satisfied global demand weighed on corn prices. The crops have created glut conditions where even storing the corn with a limited shelf life became a challenge for producers.
On April 20, the price of nearby crude oil futures fell into negative territory for the first time since futures began trading in the 1980s. We are now in the 2020 planting season for corn. Farmers face the lowest corn prices in years because of the deflationary spiral caused by Coronavirus. The weather conditions over the coming weeks and months could determine if corn faces the same future as we witnessed in crude oil last week. The Teucrium Corn ETF product replicates the price action in three of the most liquidly traded corn futures on the Chicago Board of Trade division of the CME.
Last week, the price of corn fell to a level that created a significant technical formation that could determine the future path of least resistance for the coarse grain.
Corn futures are under pressure
May futures rolled to July as the market begins to move from the planting to the growing season in the United States.
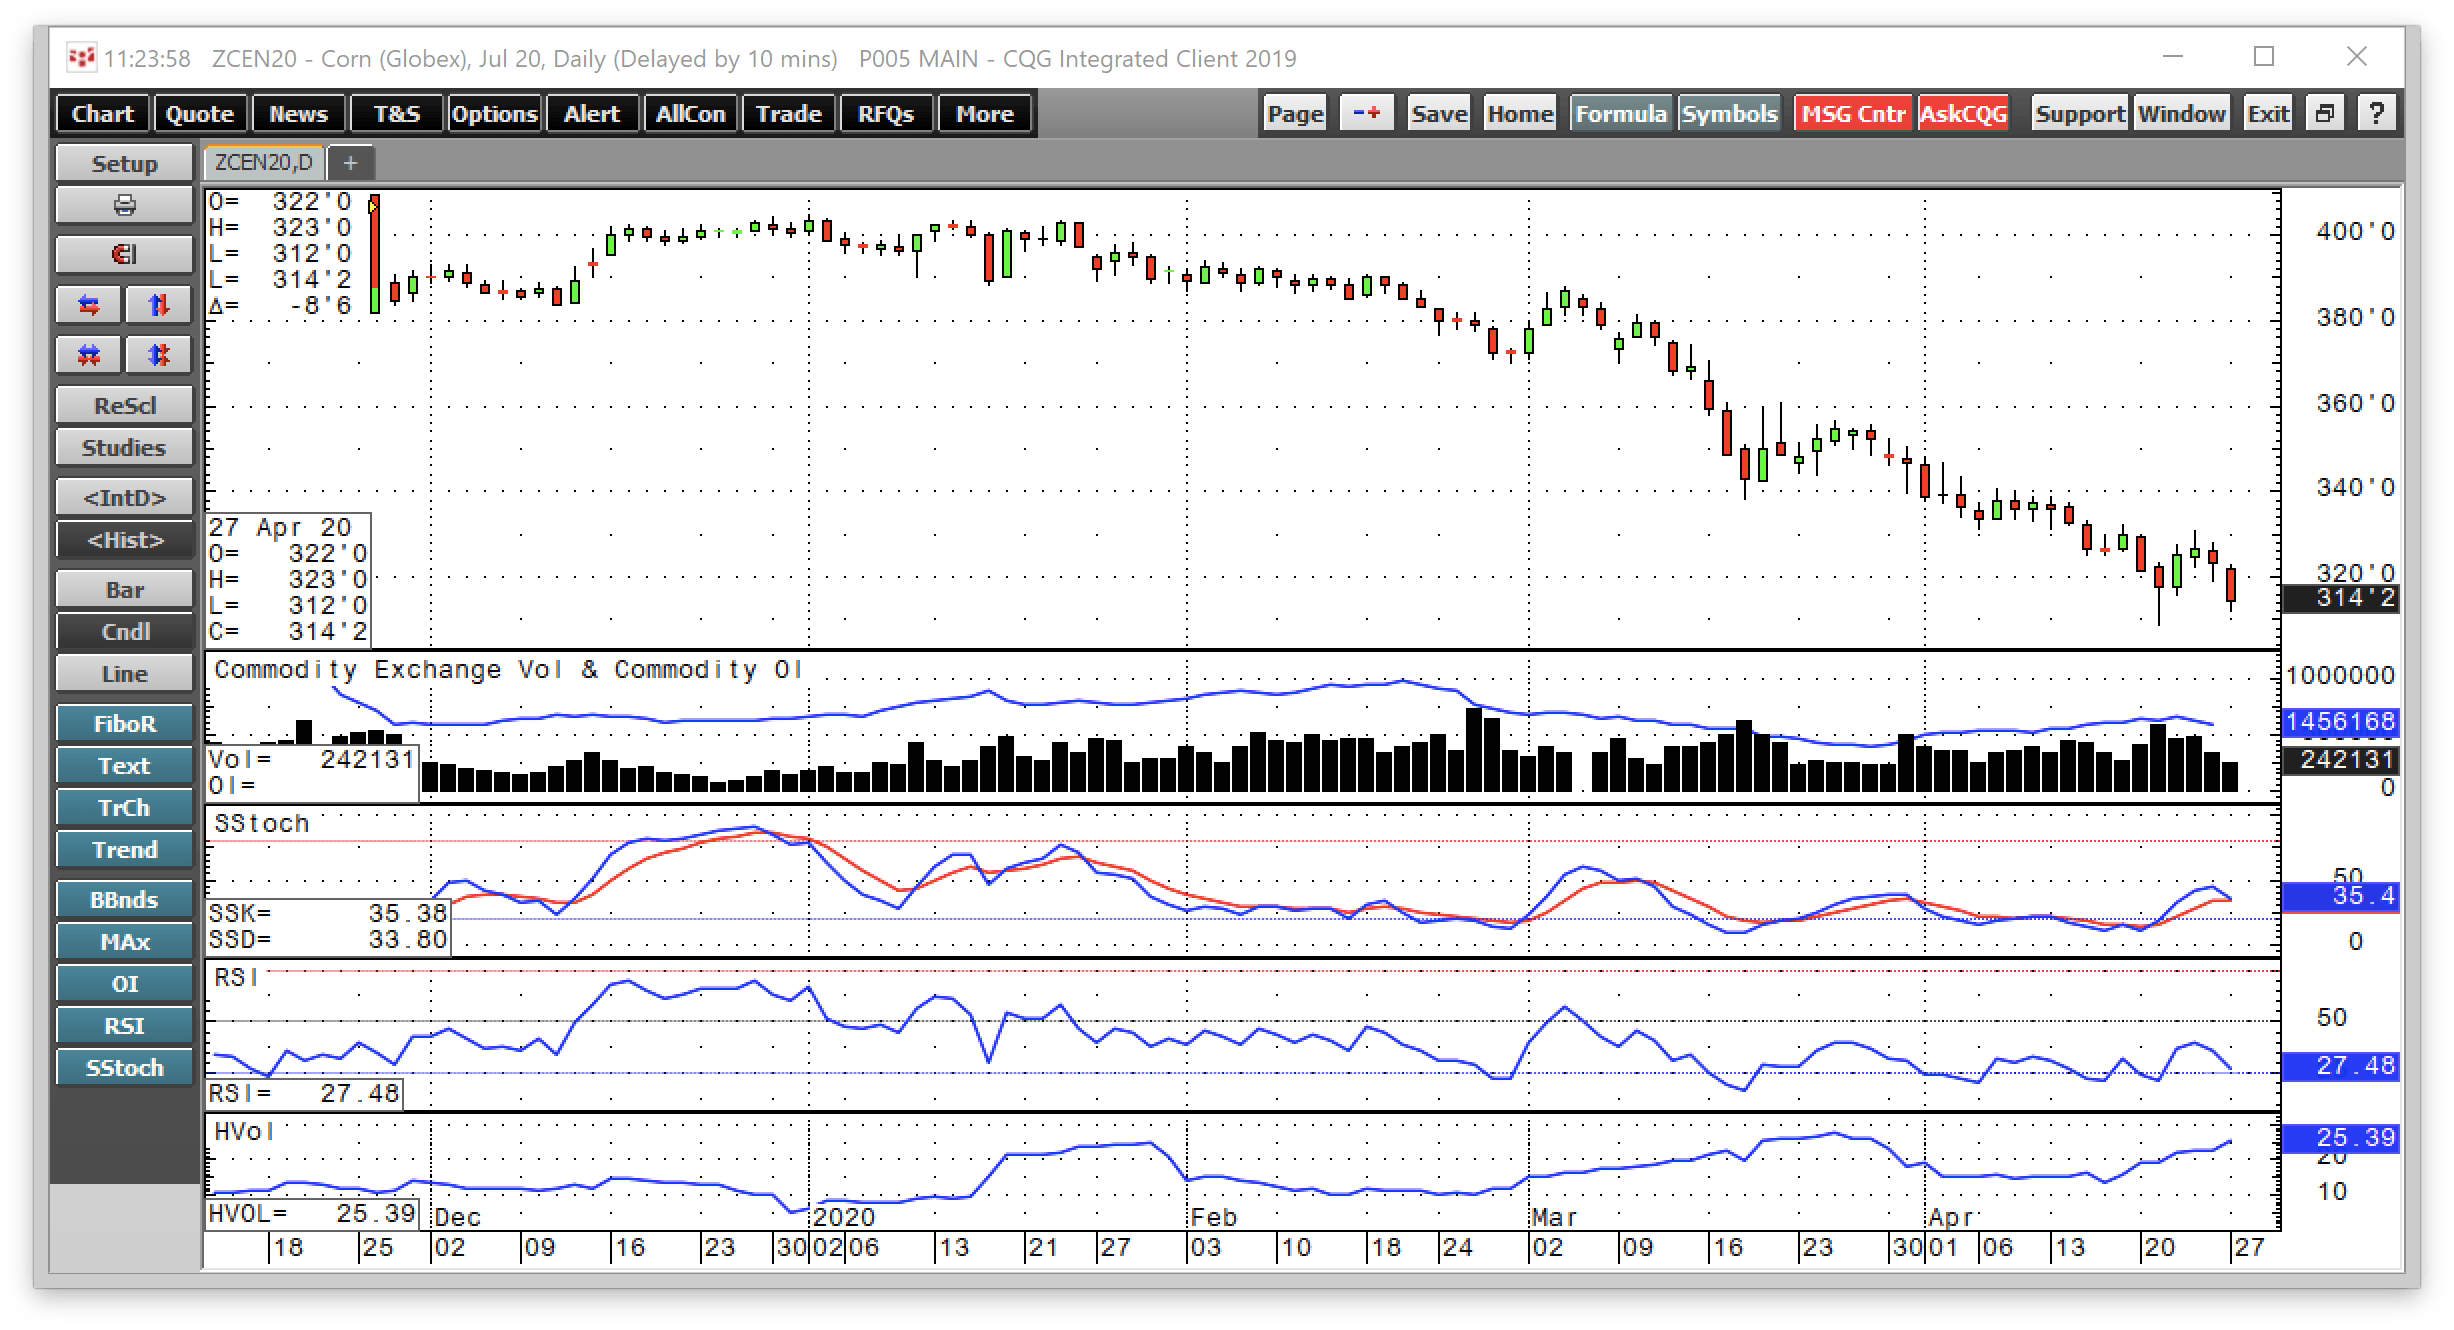
Source: CQG
The daily chart of July corn futures highlights that the price of the coarse grain has been steadily declining throughout 2020. The most recent low came on April 21 when the price reached $3.09 per bushel. The price was trading near the low at around the $3.14 level on April 27. The price momentum indicator was below neutral territory along with the relative strength index as of April 27. Daily historical volatility was at around 25.5%, reflecting wider daily trading ranges in the corn market. The total number of open long and short positions has been rising since late March when it reached a low of just under 1.37 million contracts. Since then, the price declined from the $3.55 level, and the open interest metric rose to over 1.46 million contracts as of April 24. Falling price and higher open interest tend to be a technical validation of a bearish trend in a futures market.
While markets across all asset classes have experienced selling pressure because of the deflationary spiral caused by Coronavirus, the crude oil and gasoline prices have done the worst. A flood of production and lack of demand has weighed on the oil patch.
Energy is a problem for the coarse grain
On April 20, the price of nearby NYMEX crude oil futures traded into negative territory for the first time since they began trading on the exchange.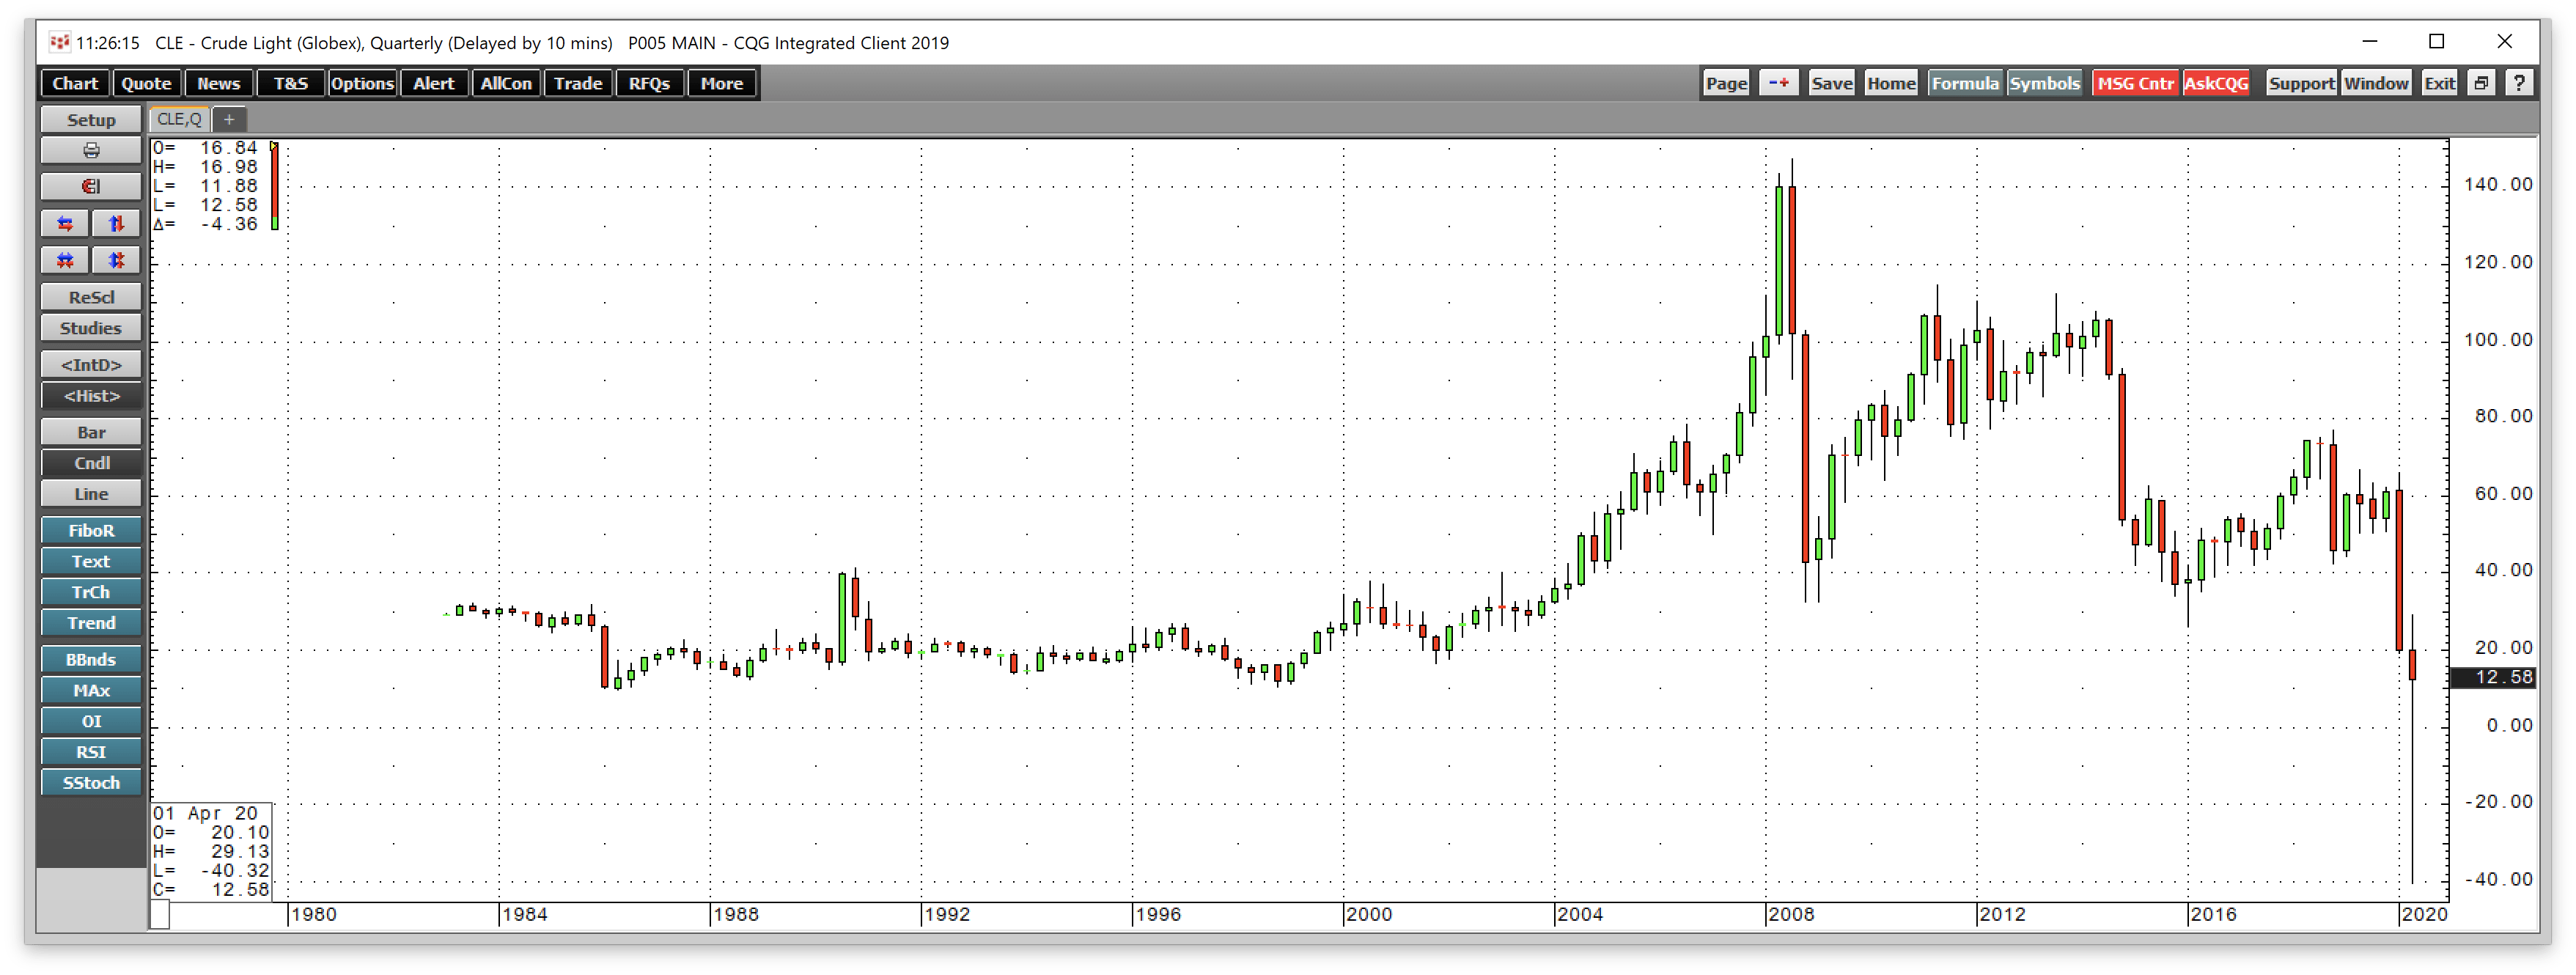
Source: CQG
The quarterly chart shows the extent of the price decline in the oil futures market. On April 20, the price fell below the 1986 low at $9.75, under zero, and to a low of an incredible negative $40.32 per barrel. The low in gasoline came during March.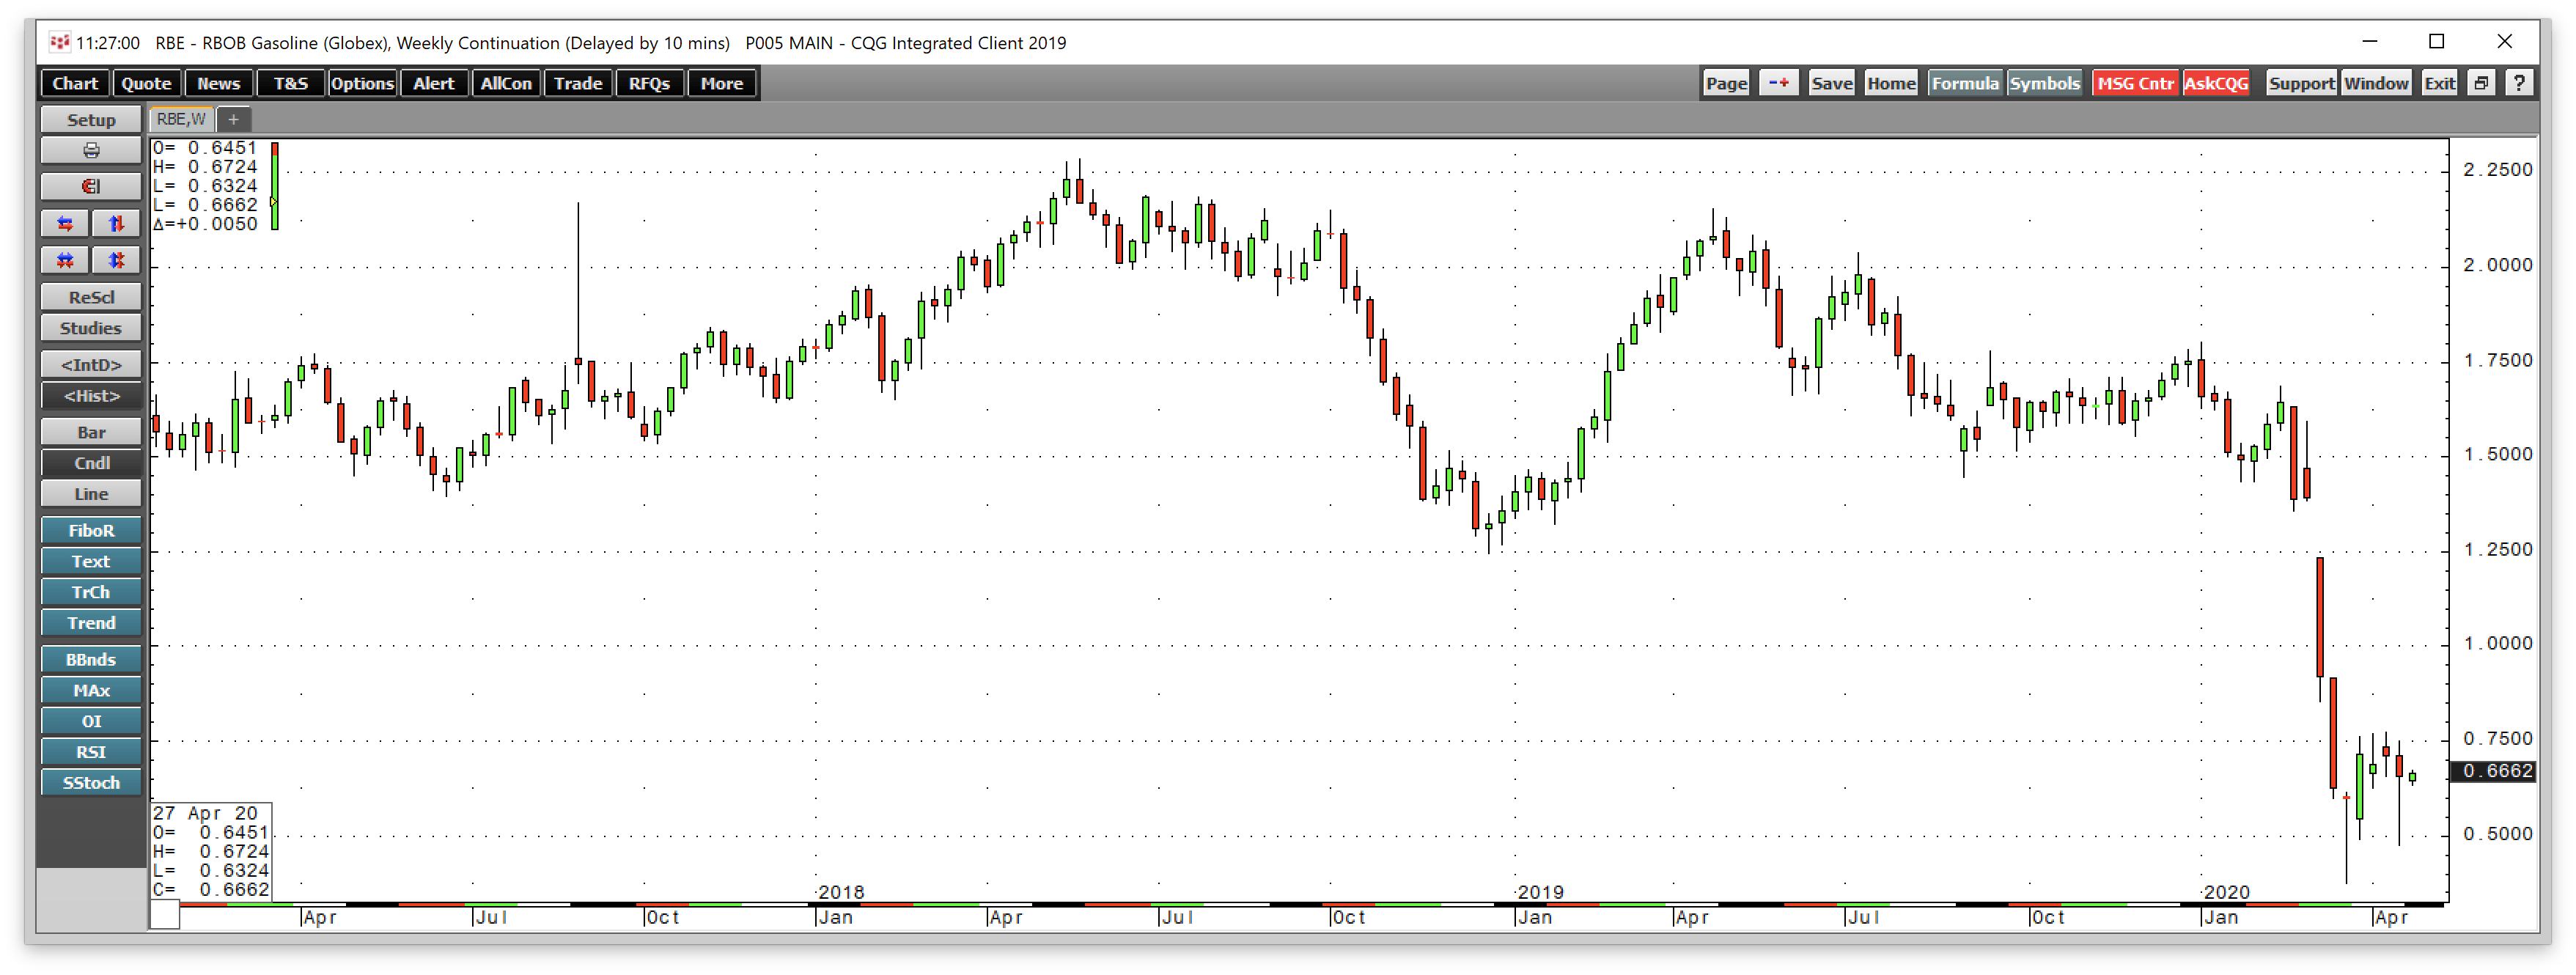
Source: CQG
The weekly chart shows that the wholesale price of gasoline declined to a low of 37.60 cents per gallon during the week of March 23, which was the lowest level of this century.
30% of the annual corn crop goes to ethanol
The ethanol mandate in the US requires that a percentage of all gasoline that powers automobiles is a blend between the oil product and ethanol, the biofuel. In the US, corn is the primary ingredient in the production of ethanol.
Each year around 30% of the annual corn crop moves into refineries for processing into the biofuel. The ethanol mandate serves three functions. In past years, the use of ethanol reduced US dependence on crude oil from the Middle East. Environmentalists also believe that the mandate lowers carbon emissions. Finally, the massive demand for corn each year is a way for the government to support and subsidize farmers. In 2012 when drought conditions sent the price of corn to over $8.40 per bushel, the price of crude oil was between $80 and $100 per barrel, and gasoline prices were over $3 per gallon wholesale.
Uncertainty over the 2020 crop at this time of the year
Nearby June gasoline futures closed last Friday at 70.01 cents per gallon compared to prices at over $2 last year at this time. Corn futures at the $3.235 on April 24 correspond to the $3.50 level last year. The decline in demand for gasoline in 2020 has been destructive for corn demand.
Meanwhile, we are now at the peak time of the year for uncertainty over the 2020 crop. While farmers are planting crops, there is no guarantee that this year will produce the same bumper crop levels from 2013 through 2019. It is the weather across the corn belt that will determine if the yield will be enough to satisfy the global demand after the harvest season in the fall of this year.
Therefore, the price of corn and other agricultural commodities in the futures market will be a function of the weather over the coming weeks and months. A dry and hot growing season that creates shortages could cause significant price appreciation. Volatility in the corn market on the back of changing weather conditions throughout the late spring and summer will dictate the path of least resistance for the futures prices.
Meanwhile, the price of nearby corn futures fell to the lowest price since 2016 last week.
A double bottom formation on the long-term chart- CORN is the ETF product
Corn has not traded below $3 per bushel since 2009. A break below that level would be a significant technical event for the coarse grain.
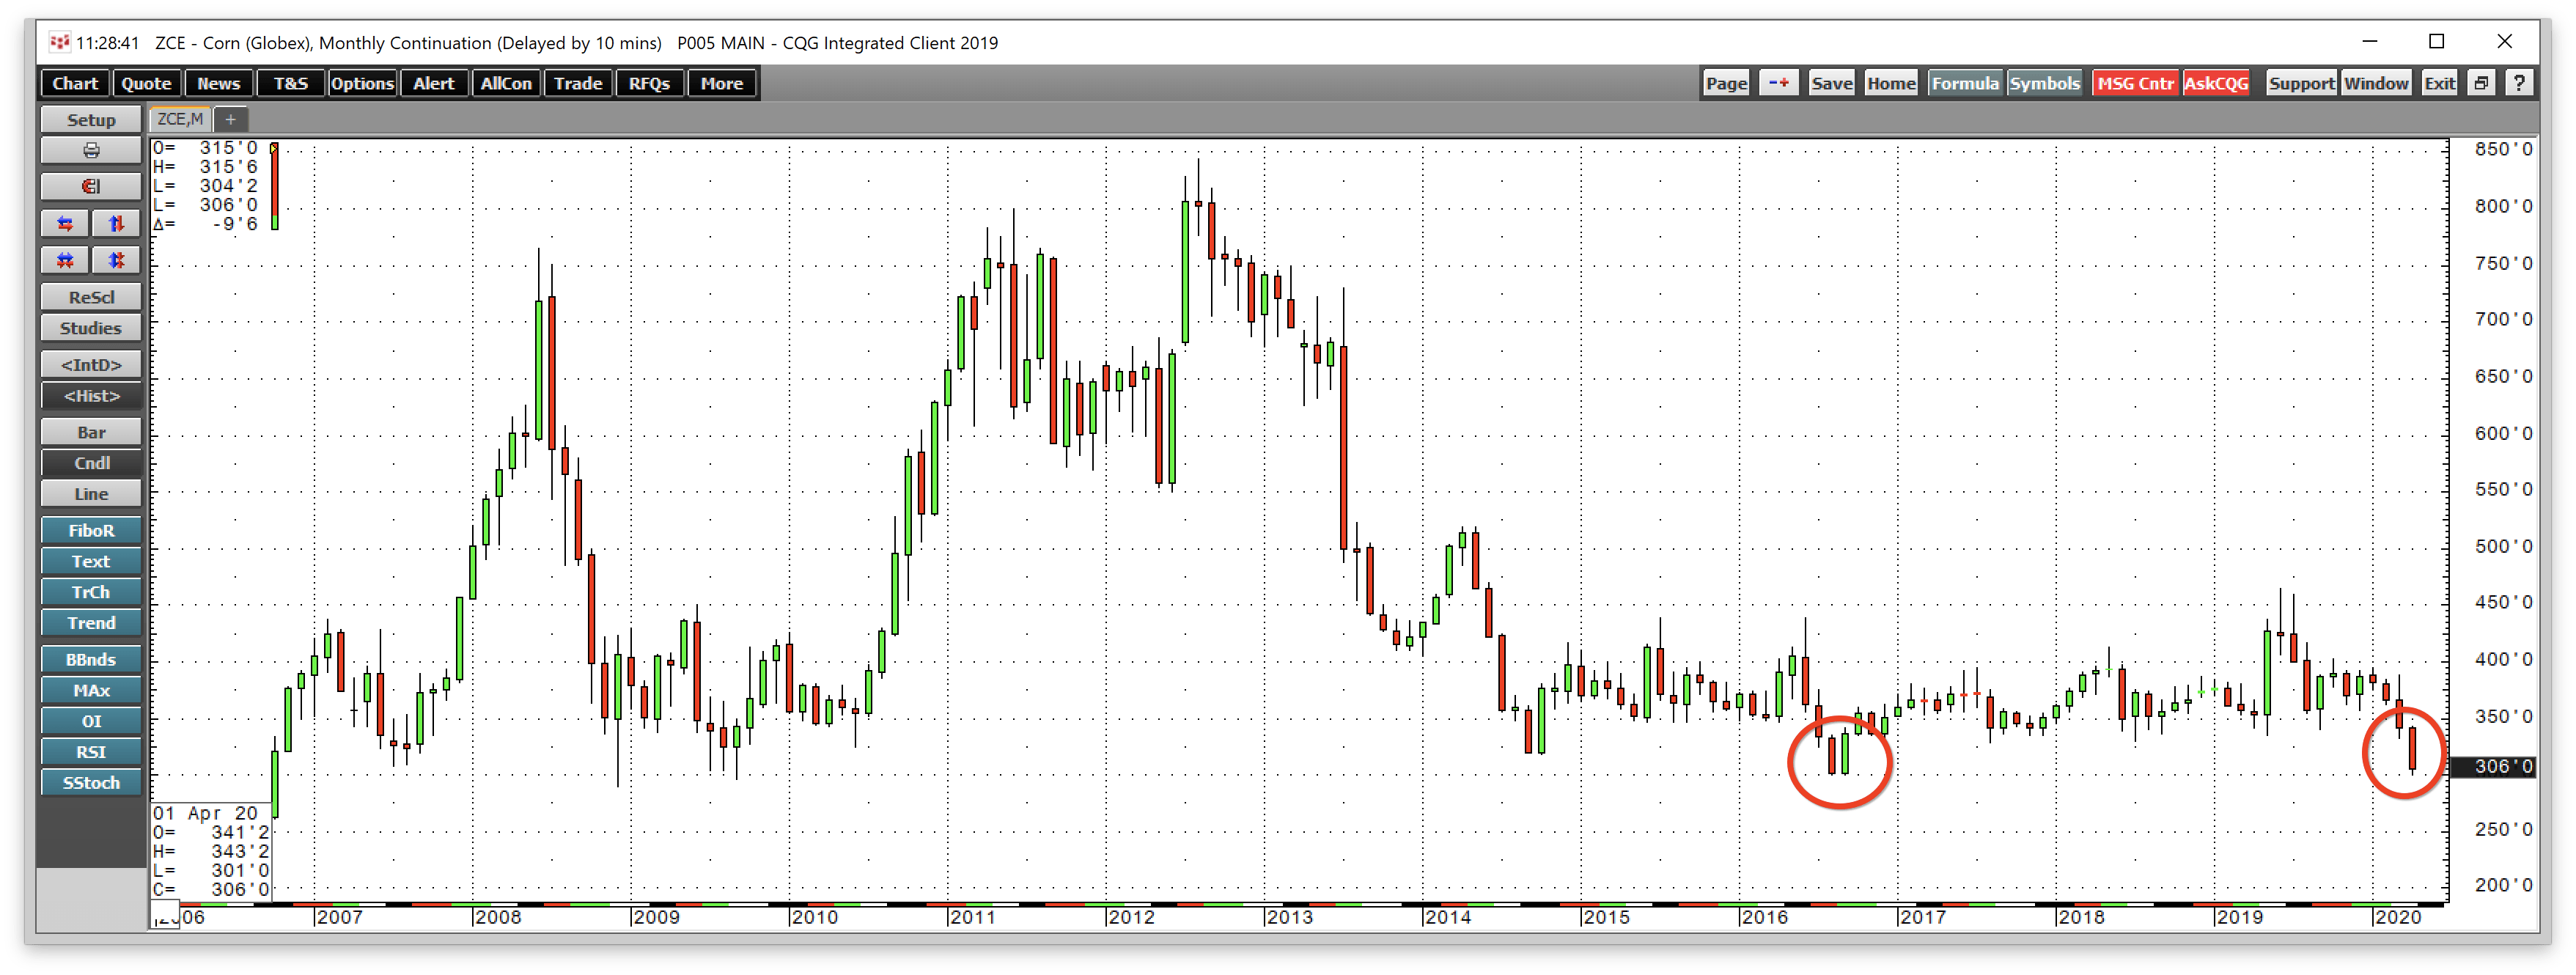
Source: CQG
The monthly chart illustrates that the low in the corn futures market in August 2016 was at $3.01 per bushel. Last week, the price fell to exactly that level and turned a bit higher, forming a double bottom pattern. The $3.01 level now stands as a critical line in the sand for the corn market on the downside.
From a trading perspective, the robust level of support created by the double bottom creates an area below to work a stop on a long position in corn. If the global pandemic continues to exert deflationary pressures on the market, and the 2020 crop creates another glut in the market, we could see multiyear lows in the corn futures arena. Moreover, if silos and terminals overflow with the coarse grain, a price at zero or lower is not out of the question later this year, as we recently witnessed in the NYMEX crude oil futures market.
The most direct route for a risk position in corn is via the futures and futures options that trade on the CBOT division of the CME. For those looking for another alternative, the Teucrium Corn Fund (CORN) tracks the prices of three of the most liquid corn futures contracts. The fund summary and most recent top holdings for CORN include:
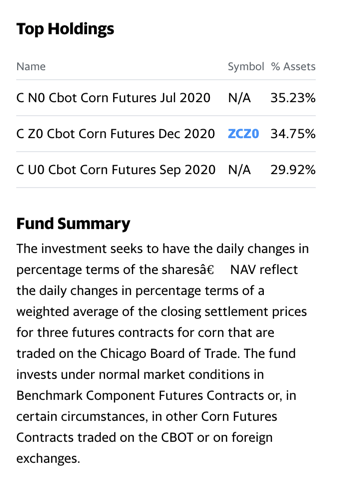
Source: Yahoo Finance
CORN has net assets of $58.58 million, trades an average of 66,120 shares each day, and charges a 1.11% expense ratio. Since the greatest degree of price volatility tends to be in the nearby futures contract, CORN tends to underperform the nearby contract when the price appreciates and outperforms the coarse grain futures contract when the price declines.
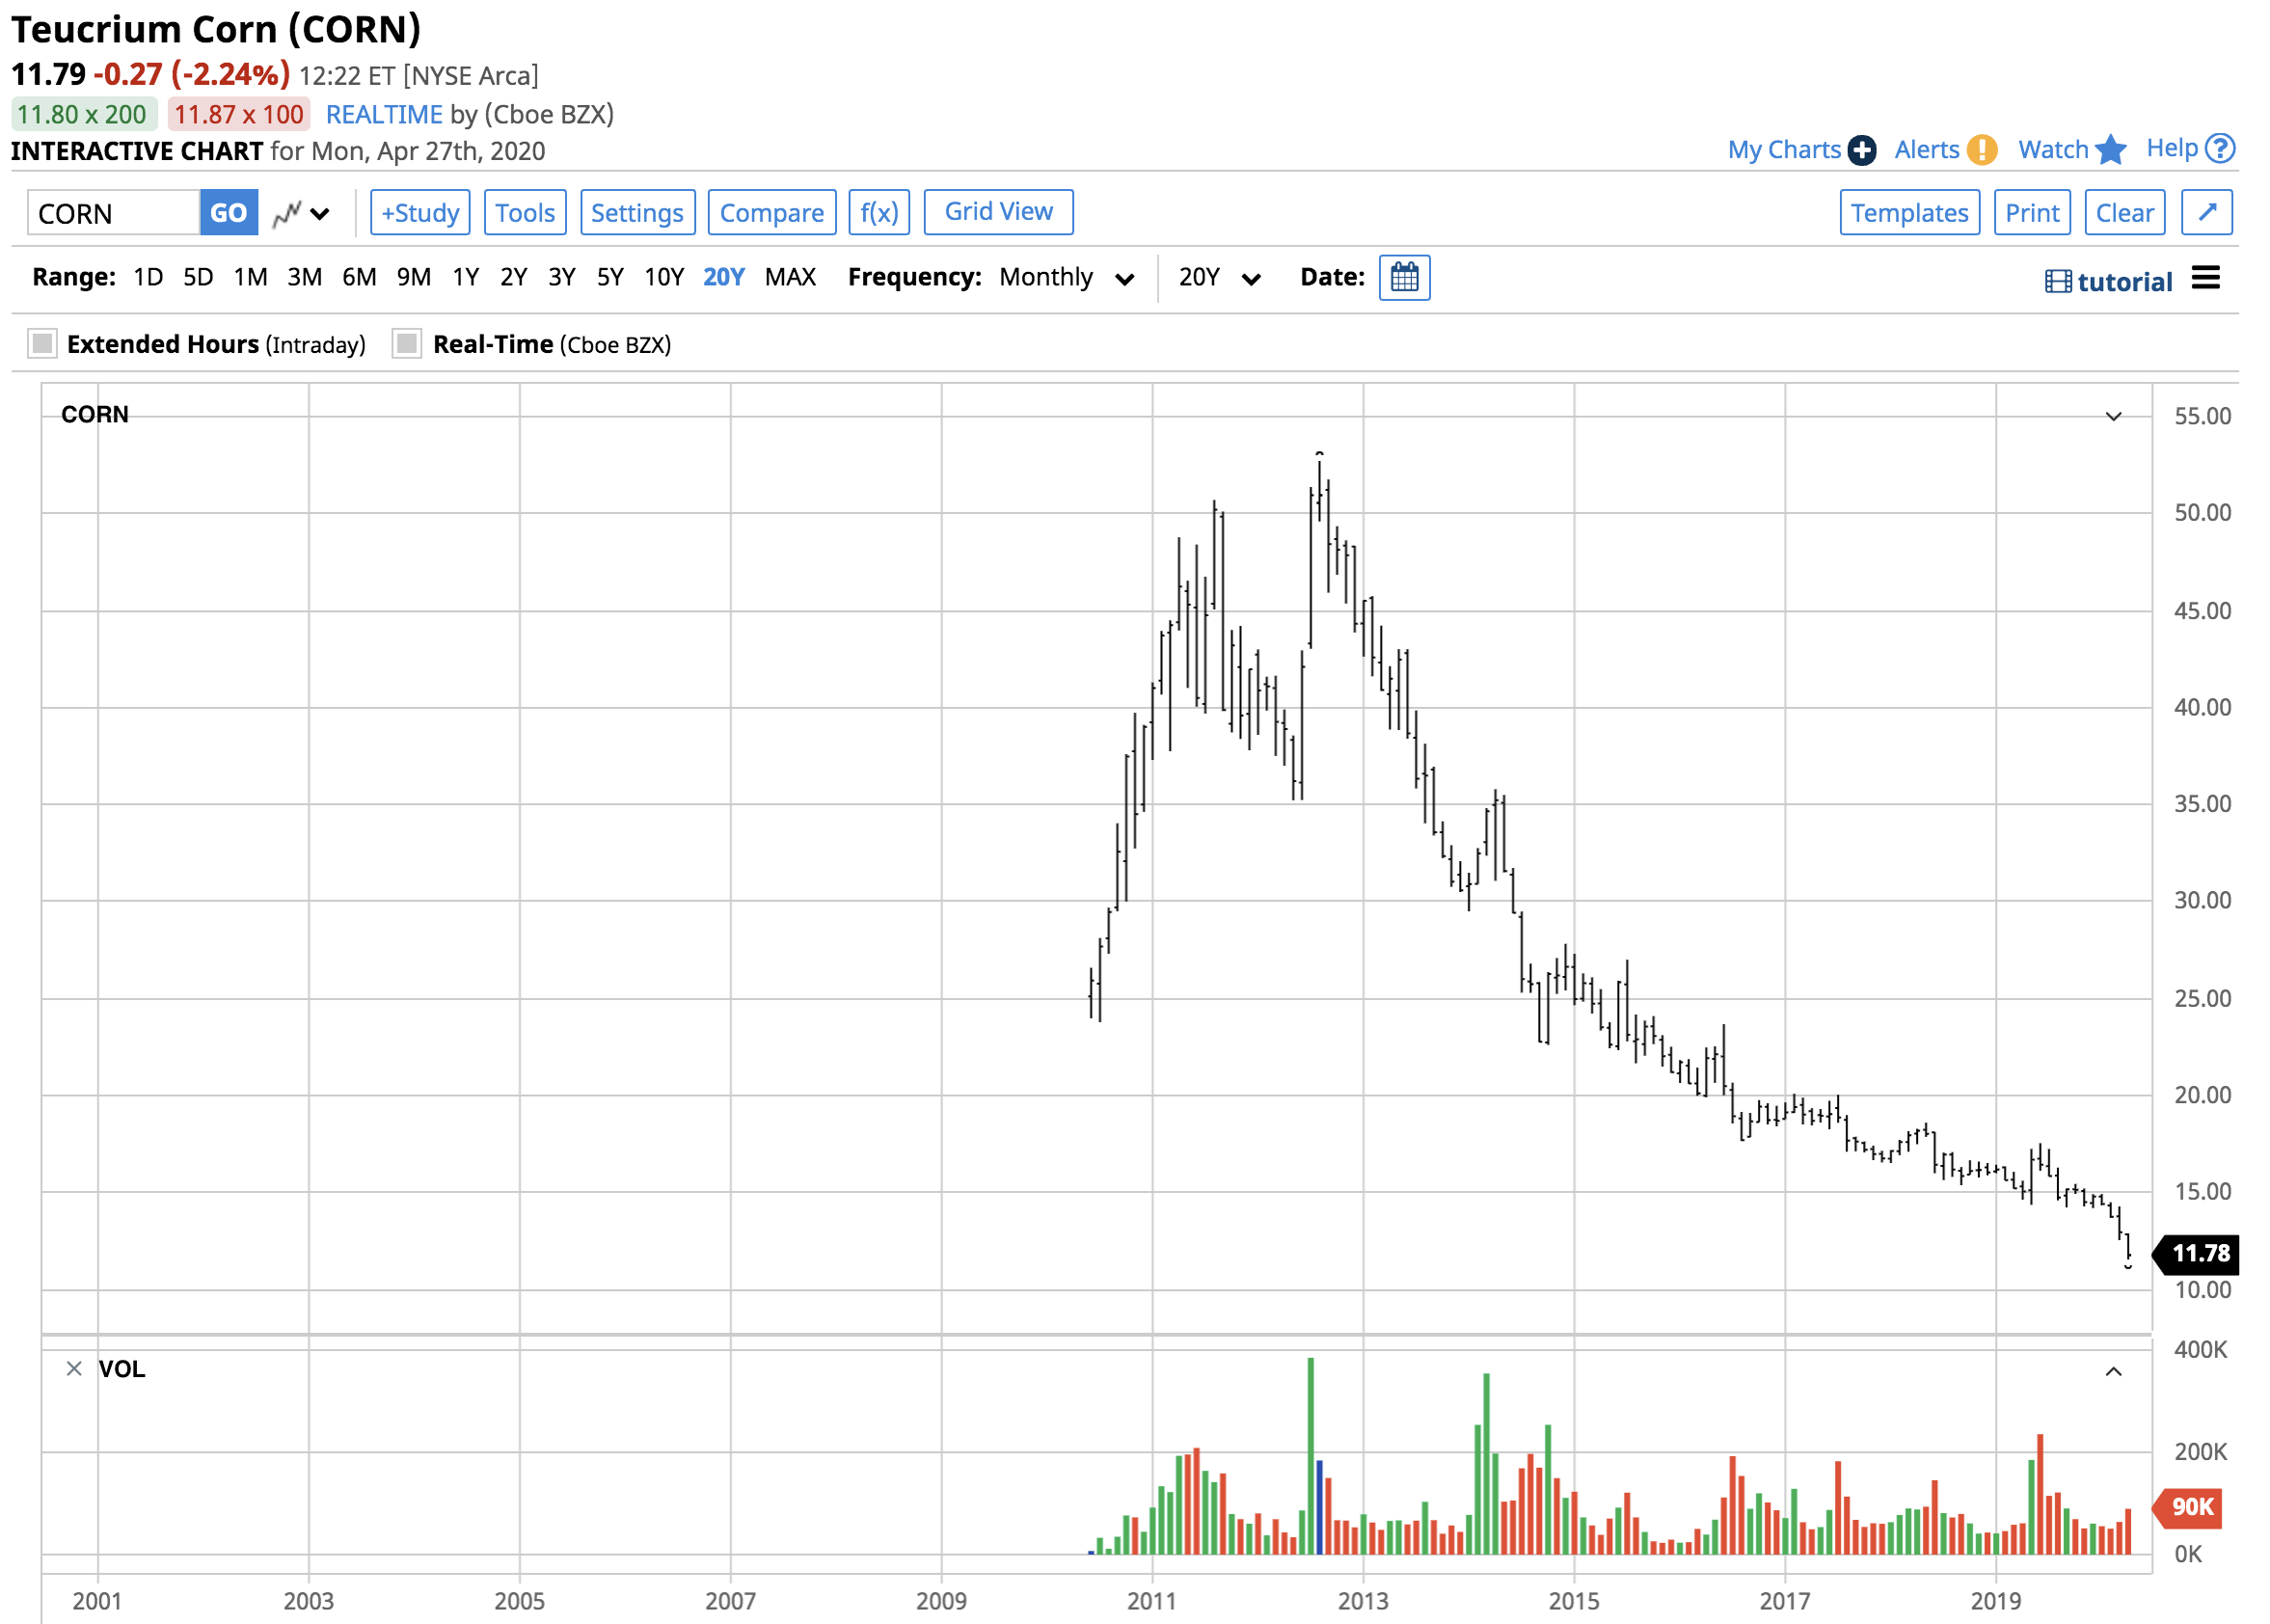
Source: Barchart
The chart of the ETF shows that CORN dropped to its lowest price since the introduction of the product in 2010 in April when it traded to $11.56 per share. CORN was trading at the $11.79 level on April 27.
The double bottom pattern on the long-term corn futures chart could lead to a recovery to higher prices, or it could serve as a gateway to a significant technical breakdown. The future path of the price of the grain is in the hands of Mother Nature. Meanwhile, a long position above the $3 level has a clearly defined risk from a technical perspective as we are now in the time of the year, where uncertainty over the weather creates the most price volatility.
The Hecht Commodity Report is one of the most comprehensive commodities reports available today from the #2 ranked author in both commodities and precious metals. My weekly report covers the market movements of 20 different commodities and provides bullish, bearish and neutral calls; directional trading recommendations, and actionable ideas for traders. I just reworked the report to make it very actionable!
Disclosure: I/we have no positions in any stocks mentioned, and no plans to initiate any positions within the next 72 hours. I wrote this article myself, and it expresses my own opinions. I am not receiving compensation for it (other than from Seeking Alpha). I have no business relationship with any company whose stock is mentioned in this article.
Additional disclosure: The author always has positions in commodities markets in futures, options, ETF/ETN products, and commodity equities. These long and short positions tend to change on an intraday basis.
Be the first to comment