

BernardaSv/iStock via Getty Images
Market breadth has been impressively strong in the last few weeks of the current market rebound. Since the June low just 6 weeks ago, the percentage of stocks trading above their respective 50-day moving averages (DMAs), what I like to call AT50 (or above the 50DMA), soared from 12.6% to 66.6% today. This bounce from oversold conditions carried along major price accomplishments for major indices like the S&P 500 (SPY) and the NASDAQ (COMPQ). The S&P 500, for example, overcame the quagmire of trading in bear market territory. However, AT50 is now staring down the threshold of overbought conditions at 70%. This test marks a critical juncture dividing trading between a resumption of the bullish rebound or a bearish reversal. The stock market failed the last three similar tests in May and November of 2021 and March, 2022.
AT50 is stalling at the threshold of overbought trading conditions. (TradingView.com)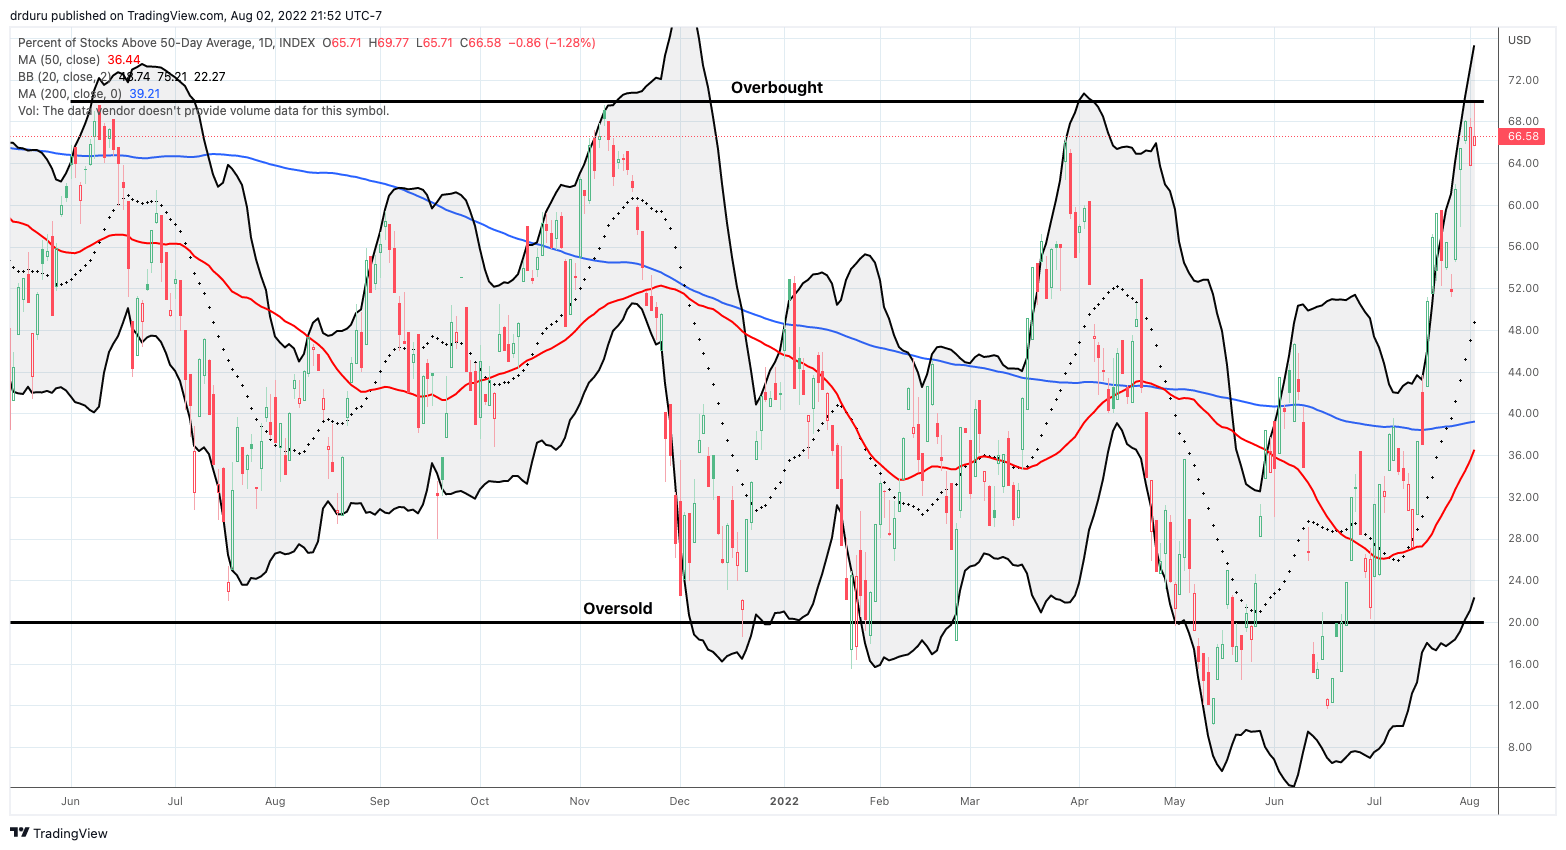
According to what I call the AT50 trading rules, overbought conditions are not bearish. The market gets bearish AFTER market breadth fails to break through the overbought threshold, which is the current test with three consecutive failures. The market also gets bearish after AT50 closes below 70% after an overbought period. Maintaining overbought conditions validates the bullish trading that launched the market to such lofty levels. Buying power must be strong to reach and sustain overbought trading.
The Message from the Currency Market
Adding to the looming weight of a critical juncture is the Australian dollar (FXA) versus the Japanese yen (FXY) or AUD/JPY. The currency pair is flashing a classic topping pattern, often called a head and shoulders. The head of AUD/JPY was bullish given the breakout above the previous high represented by the left shoulder. The subsequent rally failed to create a new high and provided the first sign of waning momentum. The top is more or less confirmed after price drops below the neckline, drawn here to align with the last firm support in late April and early May. AUD/JPY just happened to bounce perfectly from that line earlier in the trading day.
AUD/JPY is churning its way through a major topping pattern. (TradingView.com)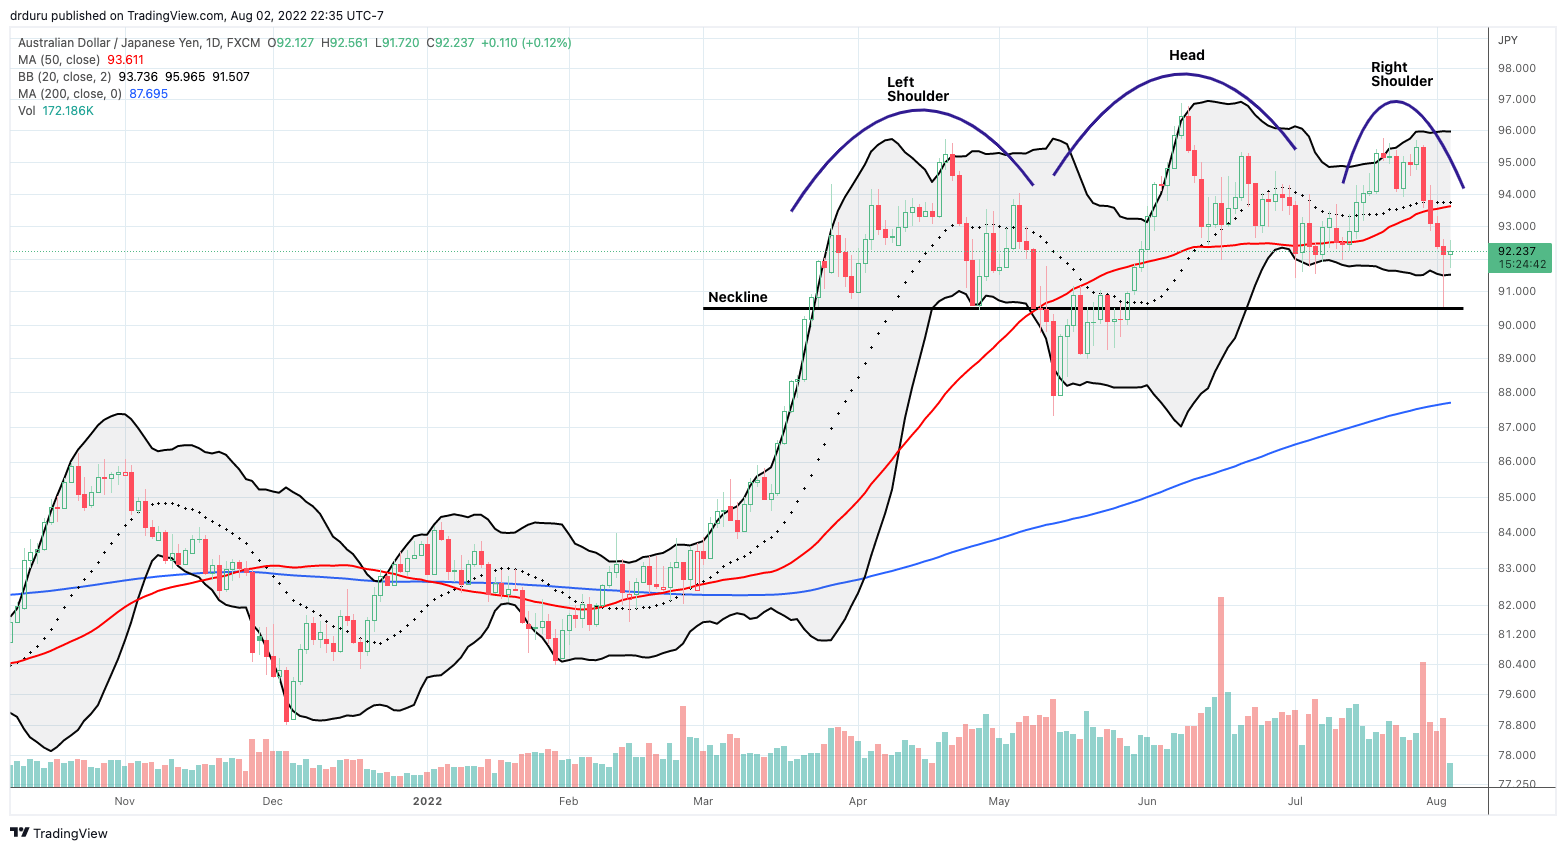
AUD/JPY serves as one proxy for risk appetite in financial markets. The typical rate differential between the Australian dollar and the Japanese yen translates into strength for AUD/JPY as traders reach for yield and/or sell the yen short to fund other trades. On the flip side, a strong yen often indicates risk aversion, particularly as a part of a “safety trade” running for the perceived stalwart strength of the Japanese economy.
The Bank of Japan’s insistence on easy money policies even as its peers are rushing to tighten policy has further underlined the yen’s role in risk appetites. The widening rate differential generated a rush to short the yen against the U.S. dollar in particular. That rush came to an abrupt end last week after the market (wrongly) interpreted a pivot in the Fed’s hawkishness last week. The rush out of the U.S. dollar seemed to translate into renewed interest in the yen across all major yen pairs. Now the question is whether this renewed interest further transforms into market risk aversion as the Fed’s monetary tightening weighs on market minds all over again.
Putting it Together
With the bulk of the earnings season in the rear view mirror, one catalyst for a rally came to an end: the relief that business conditions are not as bad as feared. Now, the market has to look forward to hawkish reminders from the Fed from here until the September meeting (or at least Jackson Hole later this month). For example, San Francisco Fed President Mary Daly remained consistent with earlier comments in an interview with John Fortt from CNBC. In response to Fortt’s characterization of the market’s relief that the Fed is nearly done tightening, Daly insisted that the Fed’s work is “nowhere near almost done…let’s just remember that the last numbers on inflation…are far too high.” Daly went on to admire the signs of slowing in the economy: “The housing market slowing is very good early signs…I’m seeing signs of broader slowing…people are starting to think the economy is downshifting.” Finally, Daly said she is puzzled at why the market expects a rate cut next year (see the Fed Fund Futures at the CME FedWatch Tool).
Financial markets expect the Fed to cut rates June, 2023 after hitting a peak at the end of this year. (CME FedWatch Tool)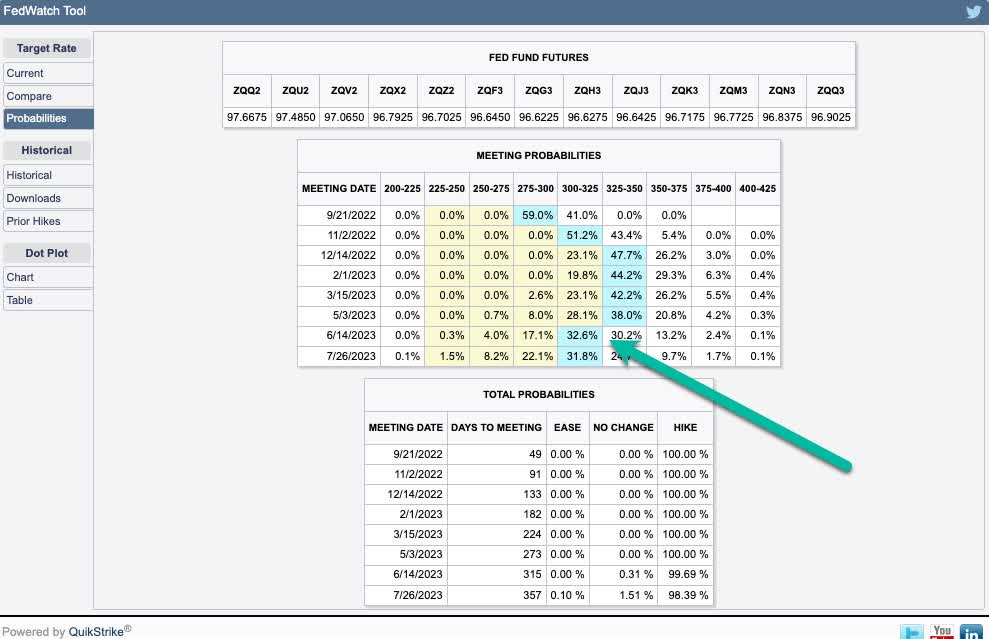
So putting it all together, there is every reason for the rally to stall at this critical juncture and even reverse some chunk of its recent gains. A confirmation is the last part of the puzzle. The first confirmation comes from AT50 making a lower close from current levels. The bearish sign gets invalidated with a close in overbought territory (over 70%). At THAT point, overbought conditions could last quite some time given the likely accompanying clearance of major technical levels for the S&P 500 (SP500) and the NASDAQ (COMP.IND) as shown below.
The S&P 500 achieved an impressive 50DMA breakout last month. The index is now stalling under the June highs and just above the key May, 2021 low. (TradingView.com)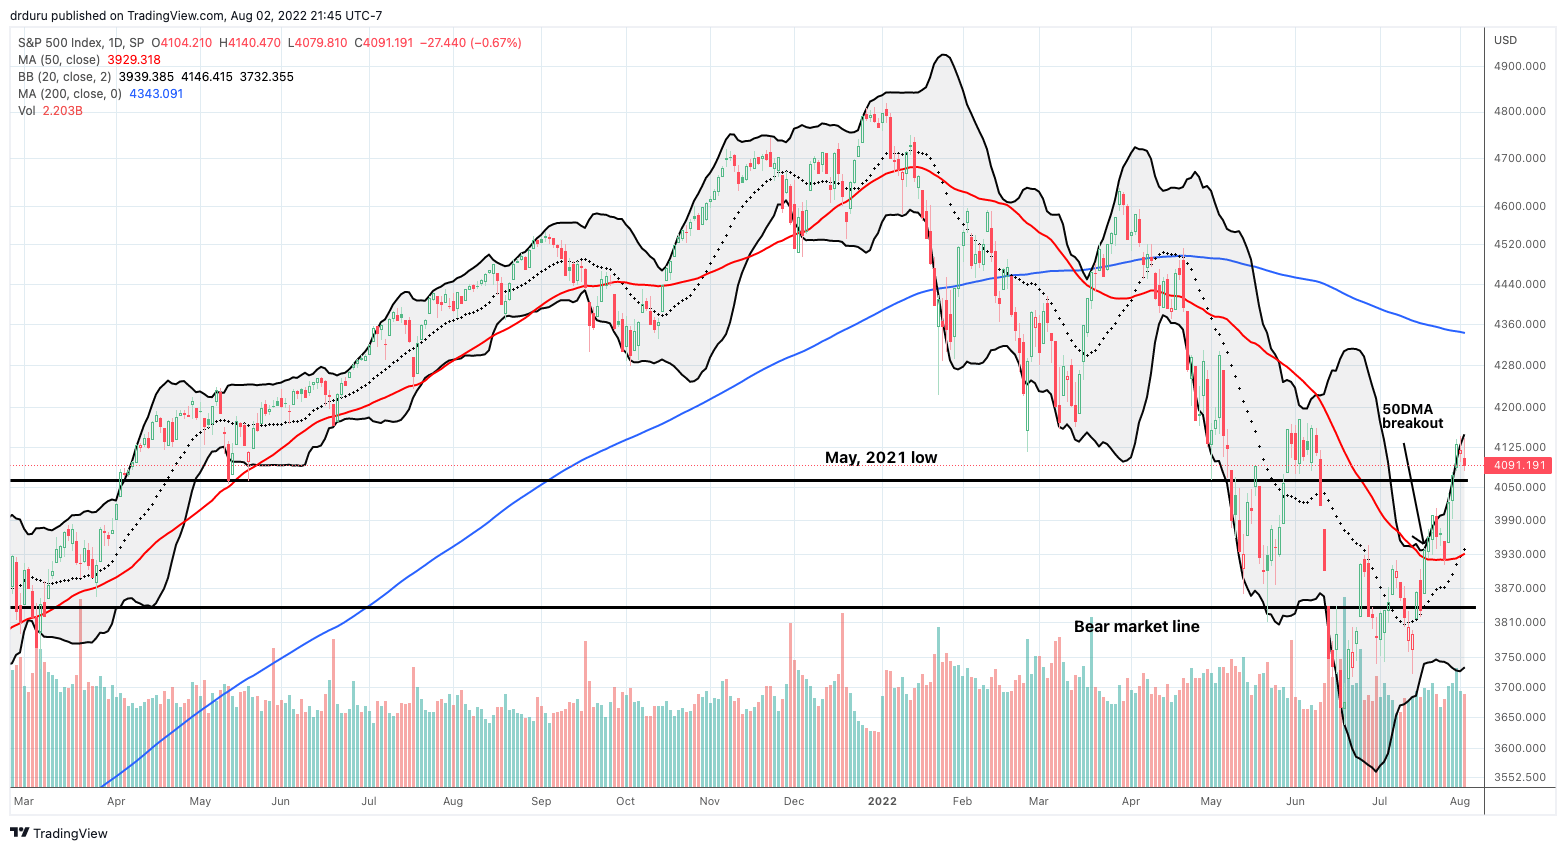
The NASDAQ is trying to hold on to a bullish breakout above its June high. (TradingView.com)
Be careful out there!
Be the first to comment