

Martina Simonazzi/iStock via Getty Images
Fear of impending recession coming out of the Fed’s announced tightening cycle and the inversion of some rate differentials (see Inversion Panic is a False Flag) has prompted us to take a look at the state of the US economy by assessing the tightness of the “screws” that hold the economy together.
The Screws Holding the Economy Together
The first chart below is the BaR grid (from econpi.com) for March 4, 2022, and the second chart is the most recent chart dated April 8, 2022.
BaR chart (econpi.com)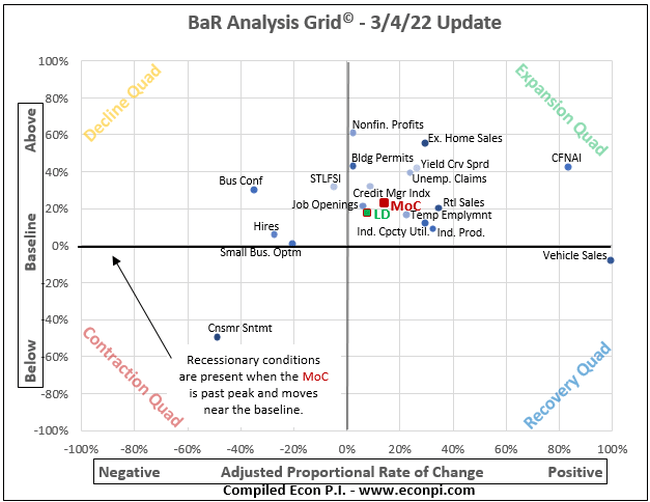
BaR chart (econpi.com)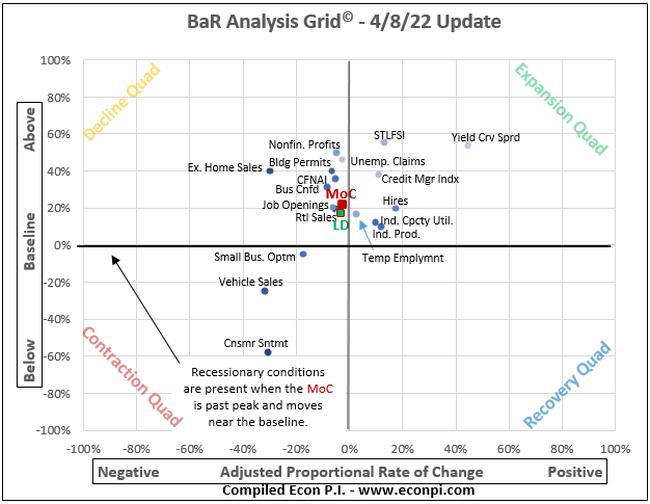
Notice that the LD (leading indicators) and MoC (mean of coordinates) have both moved into the decline quadrant over the past month. This, however, does not mean that a recession is necessarily imminent–fund-flows and bank credit are increasing, and history shows that the economy and the stock market continue to grow during a tightening cycle. This can be considered a ‘loosening’ screw, but it is not completely loose yet.
Building permits fell 1.6% from the earlier month’s historic high level. This screw is good and tight (chart below).
Building permits (tradingeconomics.com)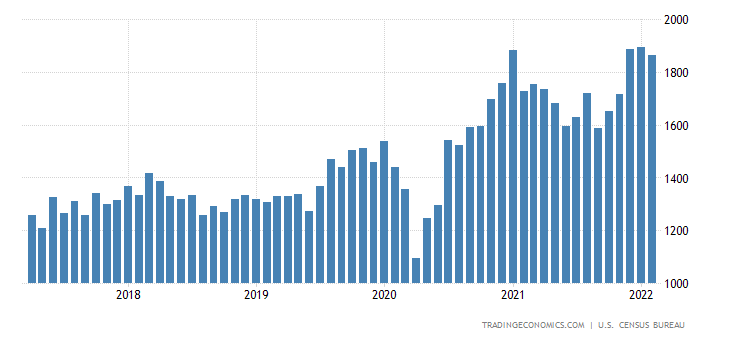
The Aruoba-Diebold-Scotti business conditions index is designed to track real business conditions at high frequency. The average value of the ADS index is zero. Bigger positive values indicate progressively better-than-average conditions, and bigger negative values indicate progressively worse than average conditions. The index shows that business conditions are above average which qualifies it as a tight economic screw (chart below).
Aruoba-Diebold-Scotti business conditions ( www.philadelphiafed.org )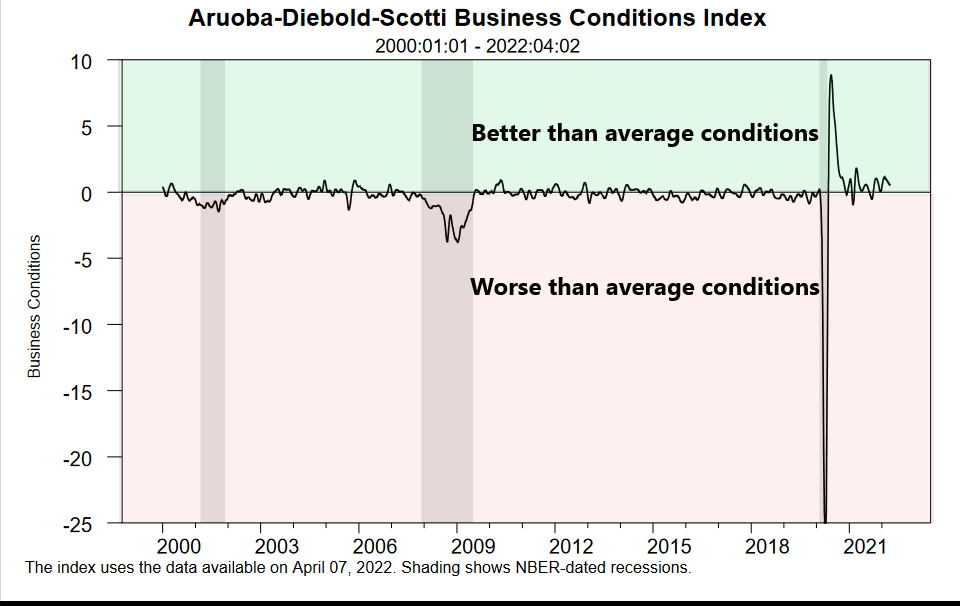
US Manufacturing PMI for March came in at 58.5, pointing to the strongest growth in factory activity in six months. This is a tightening screw (chart below).
Manufacturing PMI (tradingeconomics.com)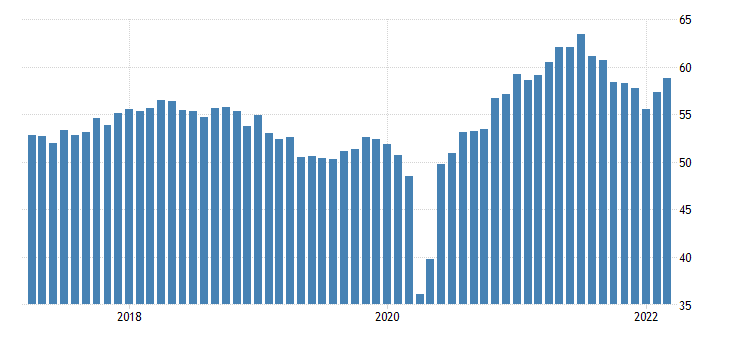
Industrial production in the United States increased 7.5% y/y in February, the biggest annual gain since June last year. This is another screw that is tightening up (chart below).
Industrial production (tradingeconomics.com)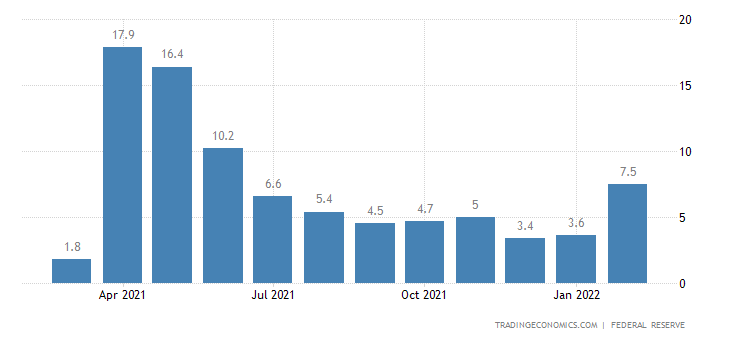
Recessions are always preceded by at least one-year of falling housing starts. Housing starts continue to increase.
Housing starts (FRED)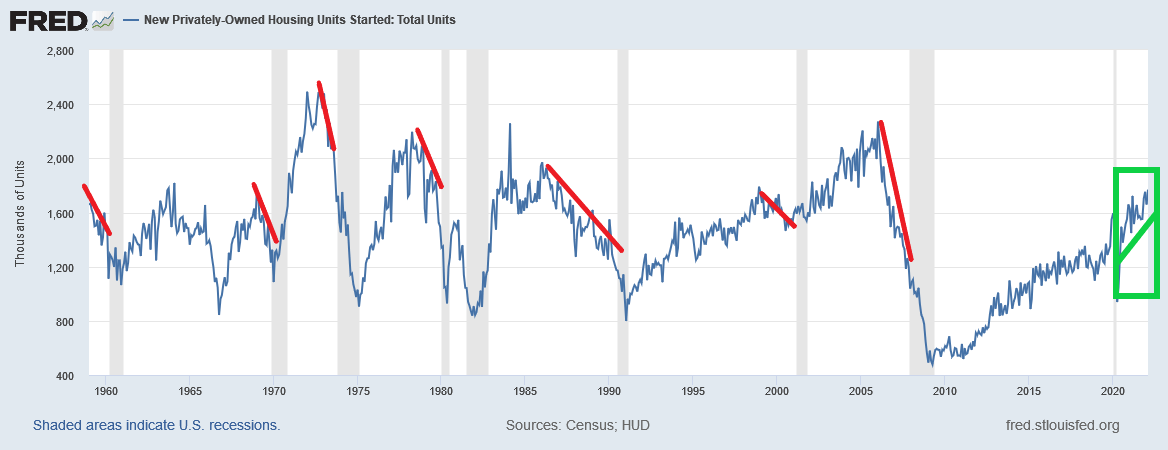
…and housing starts are at a historical high. This is a tight economic screw (chart below).
Housing starts (tradingeconomics.com)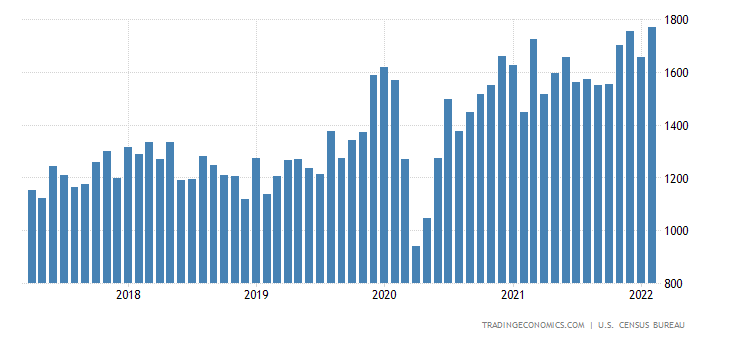
Private non-farm employment has surpassed pre-COVID levels, and continues to climb. The employment screw is tight (chart below).
Private employment (tradingeconomics.com)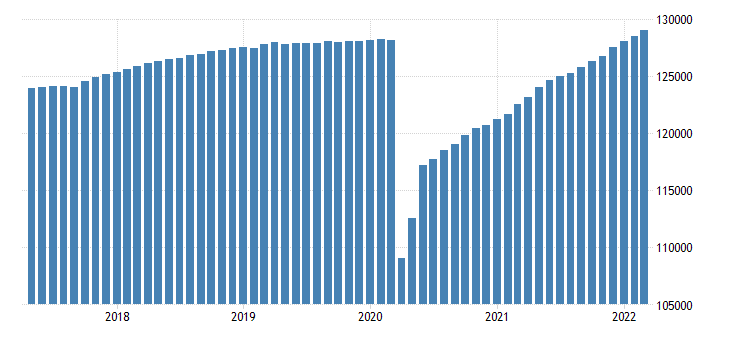
Truck transport employment stops growing or declines for more than a year ahead of recessions. Truck employment is growing and is a tight economic screw (chart below).
Truck transport employment (FRED)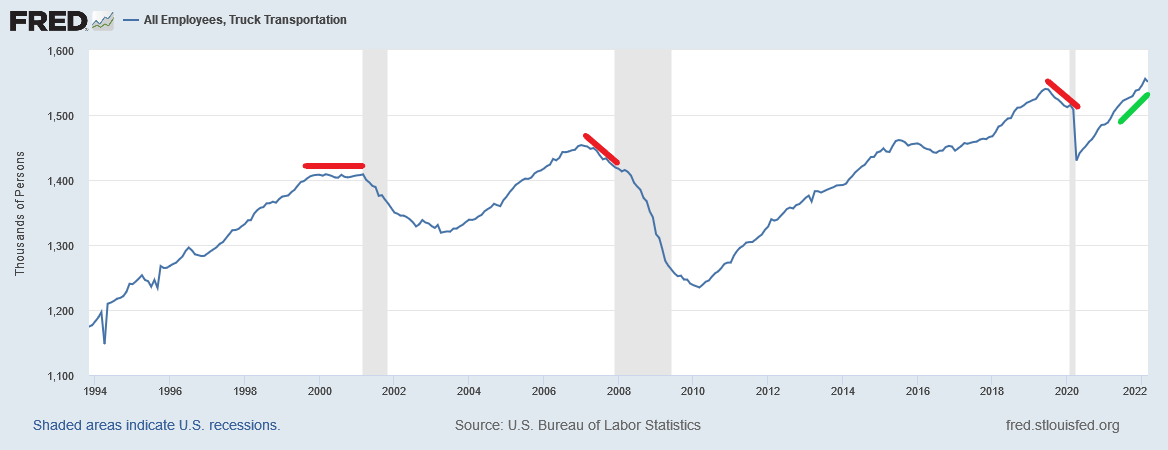
Federal government taxation removes money from the private sector, and federal government spending on goods and services adds money to the private sector. Reductions in deficit-spending always precede recessions; Clinton reduced the deficit so much that the Treasury account went into surplus, and the deficit reduction that took place between 2010 and 2015 would have caused a recession in 2015 had the deficit not been increased in time (chart below).
Budget deficit/surplus (FRED)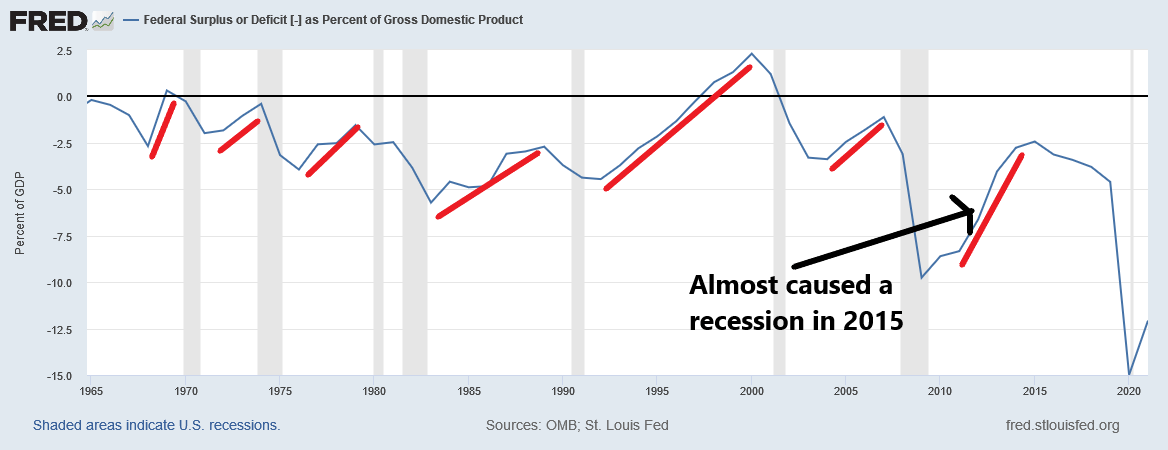
The fiscal response to COVID produced a post-WWII record deficit which prevented a depression. The net-transfer to the private sector is now back to pre-COVID levels–it is less than half of what it was a year ago–but like the Clinton era, the bank credit is increasing and making up some of the difference. The fund-flow “economic-screw” remains substantial and tight enough to prevent near-term recession.
Despite the slowing growth rate of the economy, the majority of the important “economic screws” remain tight enough to prevent a recession and to keep the stock market from falling into a bear market.
The market is in a trading-range that is likely to last through the summer; we don’t expect new highs before Q4, but we don’t expect a bear market either.
Be the first to comment