

Ivan Bajic/iStock via Getty Images
Starting today, the US Fed has pledged to run off its balance sheet (reduce liquidity in the banking system via ‘Quantitative Tapering’) by $95 billion a month – double the amount they were supposed to have been withdrawing (QT) since the start of June and about 5.5x the $17 billion per month they actually have withdrawn. We will soon discover whether they retain the resolve to execute amid plunging markets.
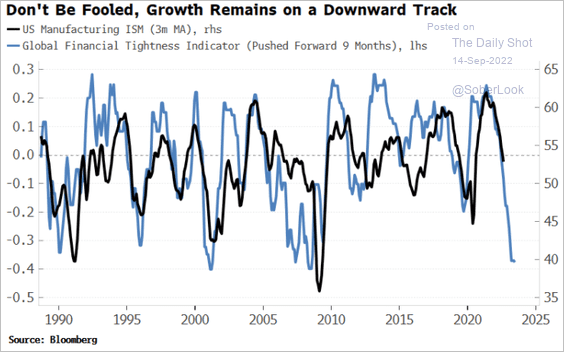
Historically, reducing liquidity is a negative for financial markets. Moreover (shown in blue below since 1987, courtesy of The Daily Shot), it has also led economic downturns (US manufacturing ISM in black) by about nine months.
On top of QT, global central banks are following the US Fed in a rate hiking cycle that’s moving about three times faster than the ‘measured’ .25% increments typical since 1980.
Fed fund futures predict that US policy rates will move to 3%-3.25% next week and 4.25%-4.5% by early 2023 (up from 0%-.25% in March 2022!). By then, it’s feasible that the US will have reported its third and possibly fourth consecutive quarter of negative GDP growth.
Will confirmation of a US recession cause the Powell-led central bank to blink and pause its too-much-too-late tightening efforts? As today’s mounting layoffs turn into rising unemployment claims, which of the dual mandate – stable prices and full employment – will the Fed prioritize when push comes to shove?
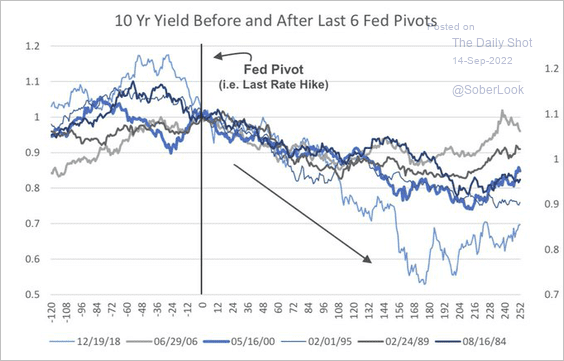
Bond yields and interest rates should be topping out if a Fed pause comes within the next six months. During the last six Fed tightening cycles (as shown below since 1984), the bond market has moved ahead of the Fed, with 10-year Treasury yields peaking before the Fed’s last hike and tumbling in the months after that as investment-grade bonds rose.
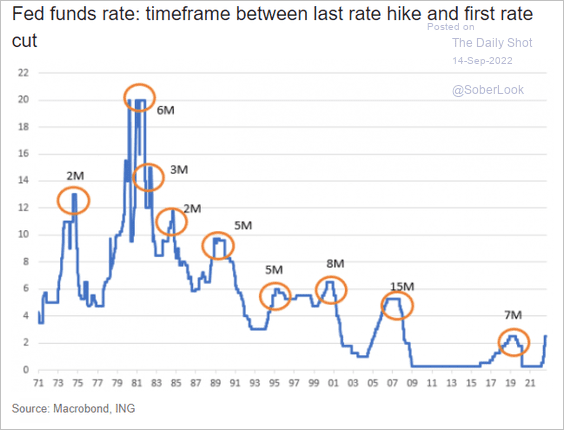
Fed rate cuts on the short end, meanwhile, have historically not started until two to fifteen months after the last policy hike (as shown below since 1971).
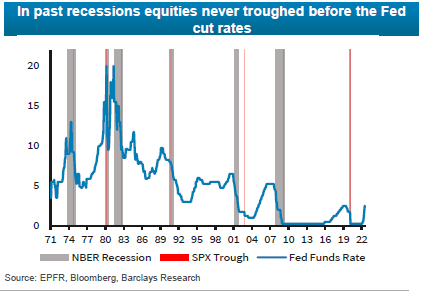
It’s worth noting that equity markets have historically not bottomed (S&P price troughs in red below since 1971) until months after the Fed has started loosening again (blue line), near the end of recessions (grey bars), when growth momentum is finally turning positive once more. #notthereyet.
Disclosure: No positions
Editor’s Note: The summary bullets for this article were chosen by Seeking Alpha editors.
Be the first to comment