

Darren415
Companies that grow dividends over time have been shown to beat the broader market. Management’s dividend increases are an important signal that the business is performing well and the company can and wants to reward shareholders. I track upcoming dividend increases from companies with a history of increasing them. The lists below contain different data points for the stocks increasing their dividends next week. This is especially important during these inflationary times.
This list is a trimmed-down version, only covering dividend increases. A full upcoming dividend calendar is always available here.
How I Created The Lists
I created the information below by combining the “U.S. Dividend Champions” spreadsheet hosted here with upcoming dividend information from NASDAQ. This meshes metrics about companies with dividend growth history with upcoming dividend payments. These companies all have a minimum five-year dividend growth history.
Companies are required to have higher total dividends paid out each year. Therefore, a company may not raise its dividend each calendar year, but the total annual dividend can still increase.
What Is The Ex-Dividend Date?
The “ex-dividend” date is when you are no longer entitled to the dividend or distribution. You need to have made your purchase by the preceding business day. For example, if the date is a Tuesday, you need to have purchased (or already owned) shares by the market close on Monday. Be aware that for any stock going ex-dividend on a Monday (or Tuesday if Monday is a holiday), you must own it by the prior Friday.
Dividend Streak Categories
Here are the definitions of the streak categories, as I’ll use them throughout the piece.
- King: 50+ years
- Champion/Aristocrat: 25+ years
- Contender: 10-24 years
- Challenger: 5+ years
| Category | Count |
| King | 0 |
| Champion | 4 |
| Contender | 1 |
| Challenger | 3 |
The Dividend Increasers List
Data has been sorted by the ex-dividend day (ascending) and then by the streak (descending):
| Name | Ticker | Streak | Forward Yield | Ex-Div Date | Increase Percent | Streak Category |
| MDU Resources Group, Inc. Common Stock (Holding Com… | (MDU) | 30 | 2.83 | 7-Dec-22 | 2.29% | Champion |
| Triton International Limited Common Shares | (TRTN) | 5 | 4.15 | 7-Dec-22 | 7.69% | Challenger |
| Becton, Dickinson and Company | (BDX) | 49 | 1.46 | 8-Dec-22 | 4.60% | Champion |
| Automatic Data Processing, Inc. | (ADP) | 46 | 1.89 | 8-Dec-22 | 20.19% | Champion |
| WesBanco, Inc. | (WSBC) | 11 | 3.46 | 8-Dec-22 | 2.94% | Contender |
| United Bancorp, Inc. | (UBCP) | 8 | 4.45 | 8-Dec-22 | 1.27% | Challenger |
| Farmers National Banc Corp. | (FMNB) | 5 | 4.47 | 8-Dec-22 | 6.25% | Challenger |
| UMB Financial Corporation | (UMBF) | 29 | 1.78 | 9-Dec-22 | 2.70% | Champion |
Field Definitions
Streak: Years of dividend growth history are sourced from the U.S. Dividend Champions spreadsheet.
Forward Yield: The new payout rate is divided by the current share price.
Ex-Dividend Date: This is the date you need to own the stock.
Increase Percent: The percent increase.
Streak Category: This is the overall dividend history classification of the company.
Show Me The Money
Here’s a table mapping the new rates versus the old rates. It also reiterates the percentage increase. This table is sorted the same way as the first table (ex-dividend day ascending, dividend streak descending).
| Ticker | Old Rate | New Rate | Increase Percent |
| MDU | 0.218 | 0.223 | 2.29% |
| TRTN | 0.65 | 0.7 | 7.69% |
| BDX | 0.87 | 0.91 | 4.60% |
| ADP | 1.04 | 1.25 | 20.19% |
| WSBC | 0.34 | 0.35 | 2.94% |
| UBCP | 0.158 | 0.16 | 1.27% |
| FMNB | 0.16 | 0.17 | 6.25% |
| UMBF | 0.37 | 0.38 | 2.70% |
Additional Metrics
Some different metrics related to these companies include yearly pricing action and the P/E ratio. The table is sorted the same way as the table above. A value investor may find stock ideas with those companies near their 52-week lows, as they could provide more margin of safety and inflated yield.
| Ticker | Current Price | 52 Week Low | 52 Week High | PE Ratio | % Off Low | % Off High |
| MDU | 31.5 | 24.54 | 31.95 | 13.39 | 28% Off Low | 1% Off High |
| TRTN | 67.51 | 48.11 | 70.84 | 13.28 | 40% Off Low | 5% Off High |
| BDX | 249.38 | 215.9 | 275.43 | 87.06 | 16% Off Low | 9% Off High |
| ADP | 264.22 | 189.58 | 264.94 | 30.3 | 39% Off Low | 0% Off High |
| WSBC | 40.46 | 29.21 | 41.37 | 18.57 | 39% Off Low | 2% Off High |
| UBCP | 14.38 | 14.35 | 20.33 | 9.96 | 0% Off Low | 29% Off High |
| FMNB | 15.22 | 12.41 | 19.39 | 9.52 | 23% Off Low | 22% Off High |
| UMBF | 85.52 | 77.48 | 110.9 | 17.04 | 10% Off Low | 23% Off High |
Tickers By Yield And Growth Rates
Some investors are more interested in the current yield, so I sorted this table descending by yield. The table also includes some historical dividend growth rates as a bonus. Additionally, the “Chowder Rule” has been included, the current yield + five-year dividend growth rate.
| Ticker | Yield | 1 Yr DG | 3 Yr DG | 5 Yr DG | 10 Yr DG | Chowder Rule |
| FMNB | 4.47 | 4.8 | 19.2 | 25.7 | 13.9 | 30.2 |
| UBCP | 4.45 | 1.8 | 4.6 | 8 | 0.2 | 12.5 |
| TRTN | 4.15 | 7.2 | 6.1 | |||
| WSBC | 3.46 | 3.2 | 5.7 | 6.7 | 8.4 | 10.2 |
| MDU | 2.83 | 2.4 | 2.5 | 2.6 | 2.7 | 5.4 |
| ADP | 1.89 | 5.1 | 13.7 | 12.2 | 10.1 | 14.1 |
| UMBF | 1.78 | 3.3 | 4.6 | 5.5 | 5.1 | 7.3 |
| BDX | 1.46 | 4.5 | 3.3 | 4.9 | 7.5 | 6.4 |
Historical Returns
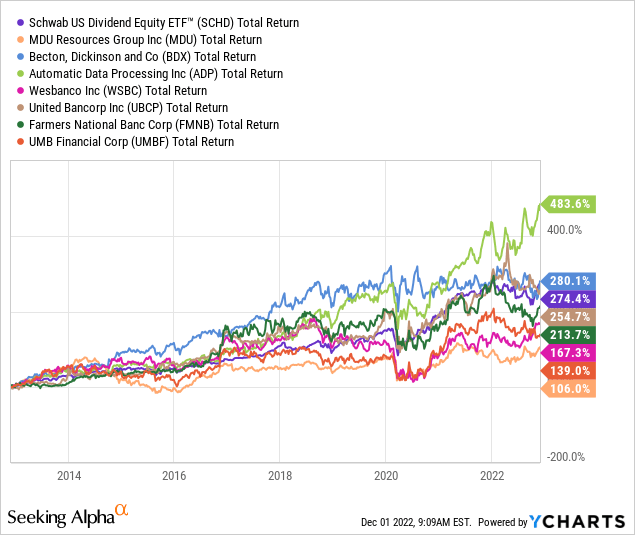
I’m always searching for dividend-growth stocks with a history of beating a market benchmark. I use the Schwab U.S. Dividend Equity ETF (SCHD) as my benchmark. The short version is that the ETF has a long history of outstanding performance, higher yield than the S&P, and growing dividends.
Here’s the 10-year total return chart for SCHD versus the listed companies. I am especially interested in the companies that have handily beaten SCHD as a starting point for more research. While BDX has very slightly beaten SCHD, I am more interested in ADP’s growth.
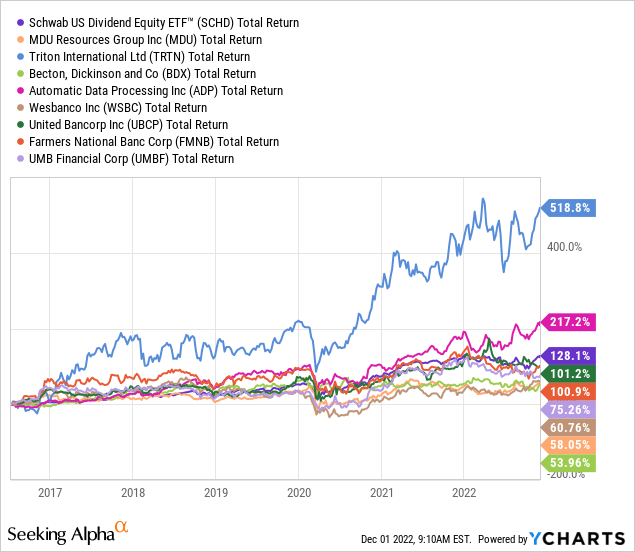
I have to include a second variation of the chart as well. Triton International only has five years of stock history, so the results are skewed, but they also tell an exciting story. The intermodal container leasing company has excellent 5-year returns, but again, use this as just a starting point.
Please do your due diligence before investing, and thanks for reading.
Be the first to comment