

Deagreez
This article was originally published on Dividend Kings on Tuesday, December 6th.
Did you know that 45% of Americans say “it will take a miracle” for them to be able to retire? And guess what? Millionaires are almost as scared.
CNBC
Why? Because the gold standard retirement portfolio, the trusty 60/40, has failed this year spectacularly. The worst year for the 60/40 since 1937 during the Great Depression.
But it’s not just one year of terrible returns that have millions of people worried about retirement. Consider this shocking fact.
In 1980, the S&P 500 yielded a staggering 6.2%, and bonds yielded almost 16%.
- A 60/40 was yielding 10.1%
In other words, the gold standard retirement portfolio, on yield alone, could be expected to beat the market’s historical 10% return.
Moreover, the 4% annual withdrawal rule could be expected to be paid for out of a fraction of the portfolio’s income and ensure that your nest egg kept growing exponentially no matter how long you lived.
Today? The 60/40 yields 2.1%, even after the worst bond bear market in US history (and the 5th worst in human history).
According to the FactSet consensus, the 4% rule has become the 2.8% rule. At least that’s the safe withdrawal rate if you want to end retirement with the same inflation-adjusted wealth as you started with.
But don’t despair friends! It doesn’t take a miracle to retire in safety and splendor; it just takes math and sound risk-management.
Let me show you how eight high-yield blue-chips can help you potentially triple your retirement income today and possibly earn 116% more inflation-adjusted wealth compared to a 60/40 over a 30-year retirement.
In fact, I’ll show you how these eight blue-chips create the ultimate ultra-yield retirement portfolio that:
- yields a potentially safe 6%, 3X more than a 60/40
- has market-matching 10% long-term return potential (and historical returns of 10%)
- is 33% less volatile than the S&P 500
- falls 50% or less than the market during even the most extreme market crashes
- fell just 19% during the Great Recession
- fell just 15% during the Pandemic
- is down 9% in 2022’s bear market
- is 86% likely to beat a 60/40 over the next 50 years
- 2.2X more inflation-adjusted wealth than a 60/40 over the next 30 years
- has a 4% chance of experiencing a 20+% bear market in the next 75 years
- can be expected to experience a bear market once every 1,875 years
- 469X less likely than the S&P 500 to suffer a bear market in any given year
In other words, let me show you how to enjoy a safe, rich yield today while rolling over even the harshest market potholes in a Rolls Royce portfolio.
Step 1: Finding The Highest Safe Yield On Wall Street
Let me show you how to screen the Dividend Kings Zen Research Terminal, which runs off the DK 500 Master List, to find the highest-yielding blue-chips on Wall Street easily.
The Dividend Kings 500 Master List includes some of the world’s best companies, including:
- every dividend champion (25+ year dividend growth streaks, including foreign aristocrats)
- every dividend aristocrat
- every dividend king (50+ year dividend growth streaks)
- every Ultra SWAN (as close to perfect quality companies as exist)
- the 20% highest quality REITs according to iREIT
- 40 of the world’s best growth blue-chips
| Step | Screening Criteria | Companies Remaining | % Of Master List |
| 1 | Reasonable Buy, Good Buy, Strong Buy, Very Strong Buy, Ultra Value Buy (Never Overpay For Stocks) | 329 | 65.80% |
| 2 | 10+ Quality (Blue-Chip Or Better) | 291 | 58.20% |
| 3 | 8+% long-term return potential | 267 | 53.40% |
| 4 | Sort By Yield | NA | NA |
| 5 | Select The Top 5 non-speculative blue-chips | 5 | 1.00% |
| 6 | Use the “Build Your Watchlist” Tool to select just those five Ultra-Yield Blue-Chips | 5 | 1.00% |
| Total Time | 2 Minutes |
We’ve found the best safe yield on Wall Street in just two minutes. How high? How about 8%? How safe? Just let me show you.
The 5 Highest Yielding Blue-Chips On Wall Street
(Source: Dividend Kings Zen Research Terminal)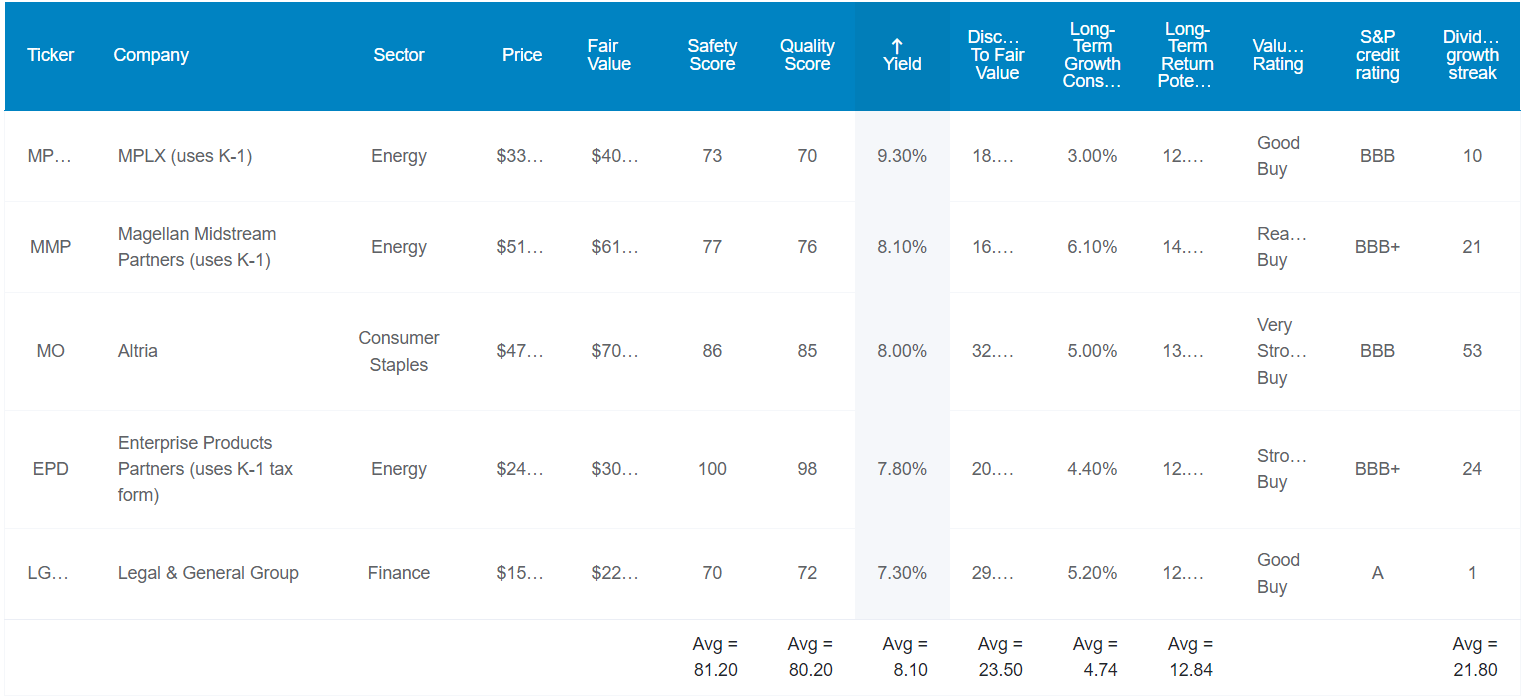
I’ve linked to articles providing a detailed and comprehensive review of each company’s investment thesis, growth potential, and risk profile.
This is just step 1 in building a diversified and prudently-risk-managed portfolio. This isn’t the complete portfolio.
Here they are in order of highest to lowest safe yield.
- MPLX (MPLX) – uses K1 tax form
- Magellan Midstream (MMP) – uses K1 tax form
- Altria (MO)
- Enterprise Products Partners (EPD) – uses K1 tax form
- Legal & General (OTCPK:LGGNY)
Tax Implications
A deep dive into the tax complexity of MLPs.
- some tax proposals call for taxing LPs as corporations
- analysts think these have a small chance of actually passing
- and if they did high depreciation for MLPs would likely result in very modest tax bills that would not threaten the safety of very well-covered blue-chip distributions
- Foreign withholding tax rate of 37% and whether or not you can recoup it via tax credits depends on your country’s tax treaty with the US
FAST Graphs Up Front
MPLX 2024 Consensus Total Return Potential
(Source: FAST Graphs, FactSet)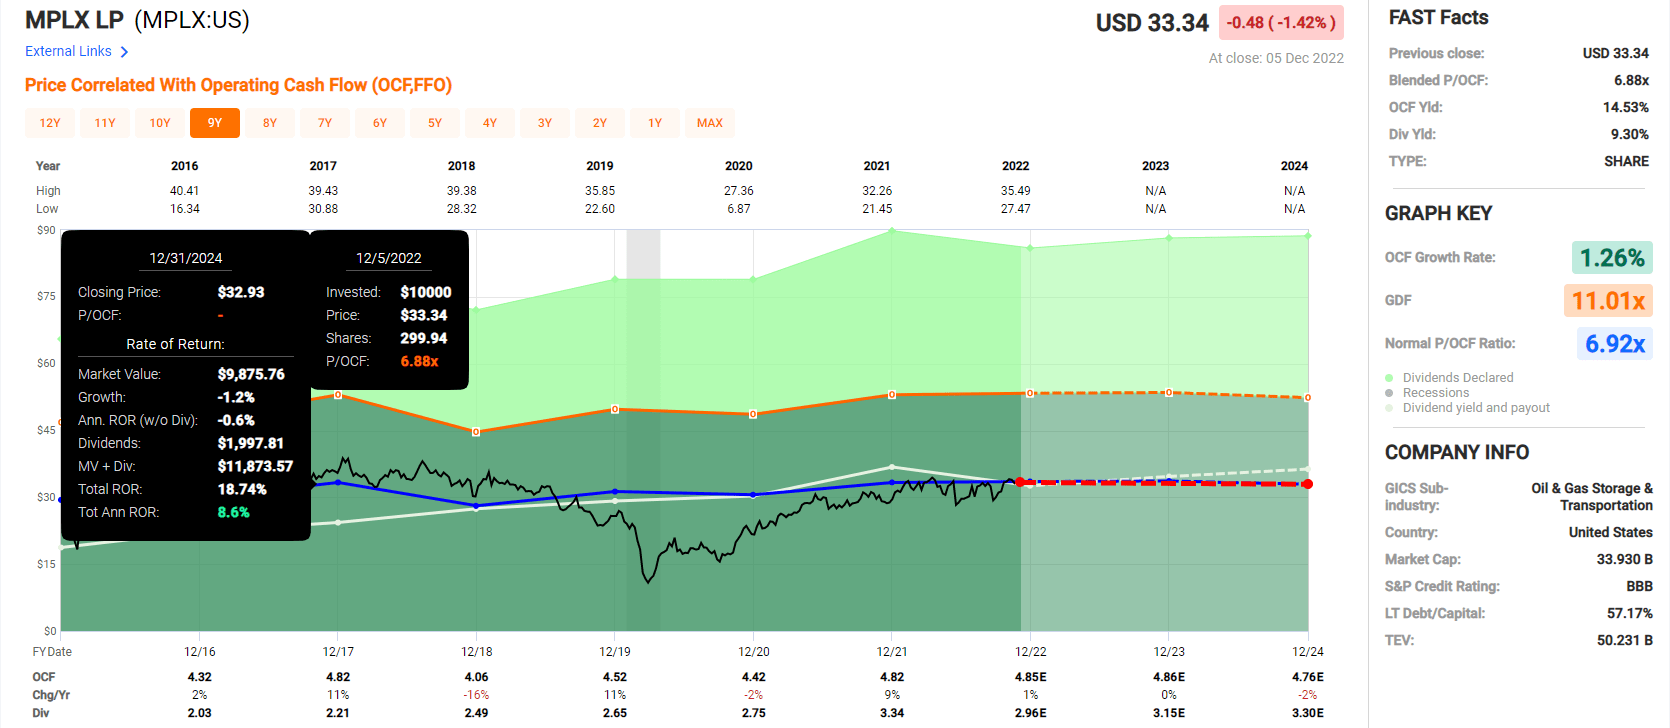
Magellan Midstream 2024 Consensus Total Return Potential
(Source: FAST Graphs, FactSet)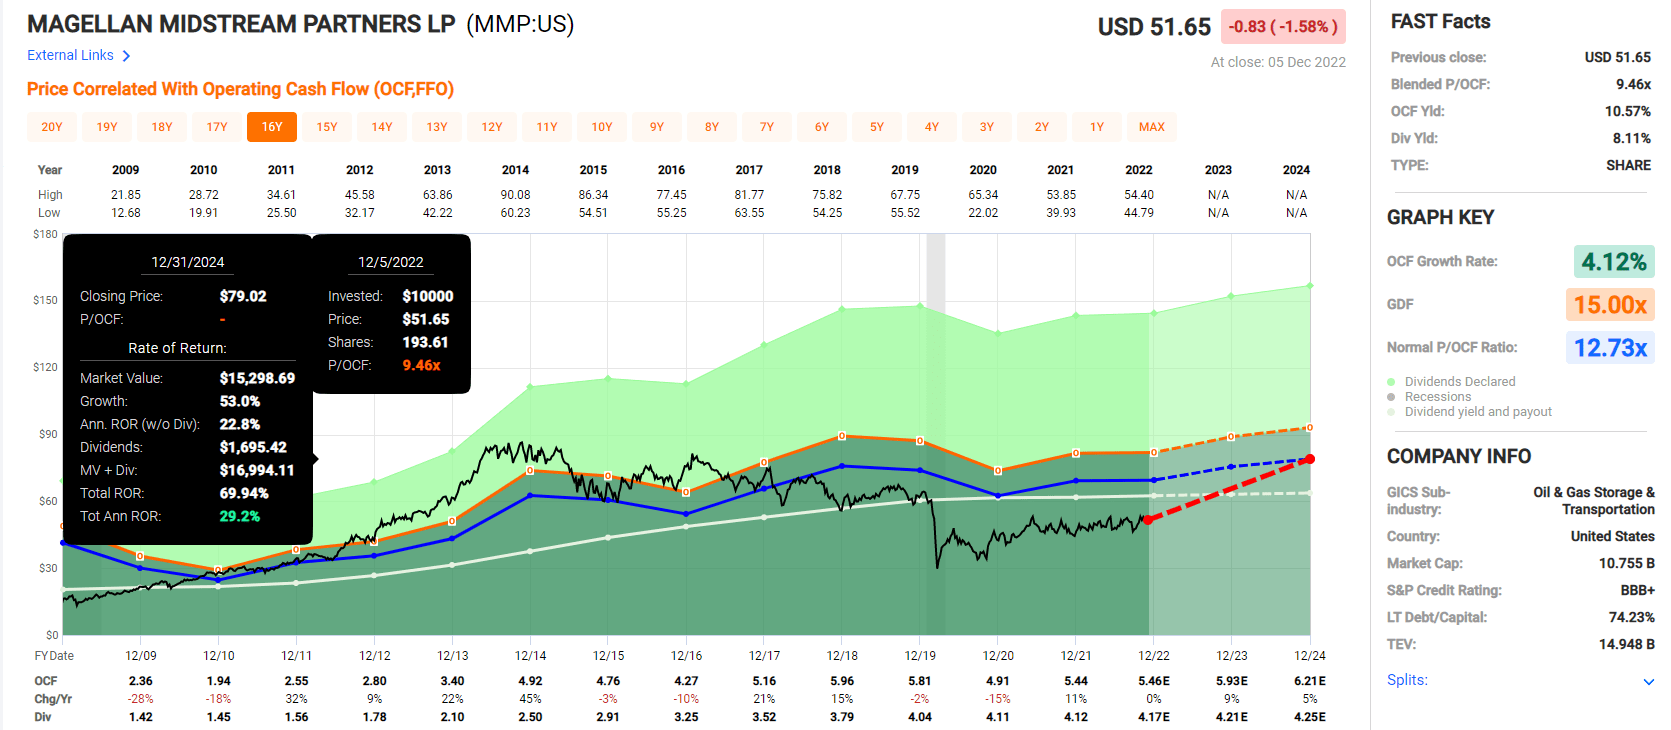
Enterprise Products Partners 2024 Consensus Total Return Potential
(Source: FAST Graphs, FactSet)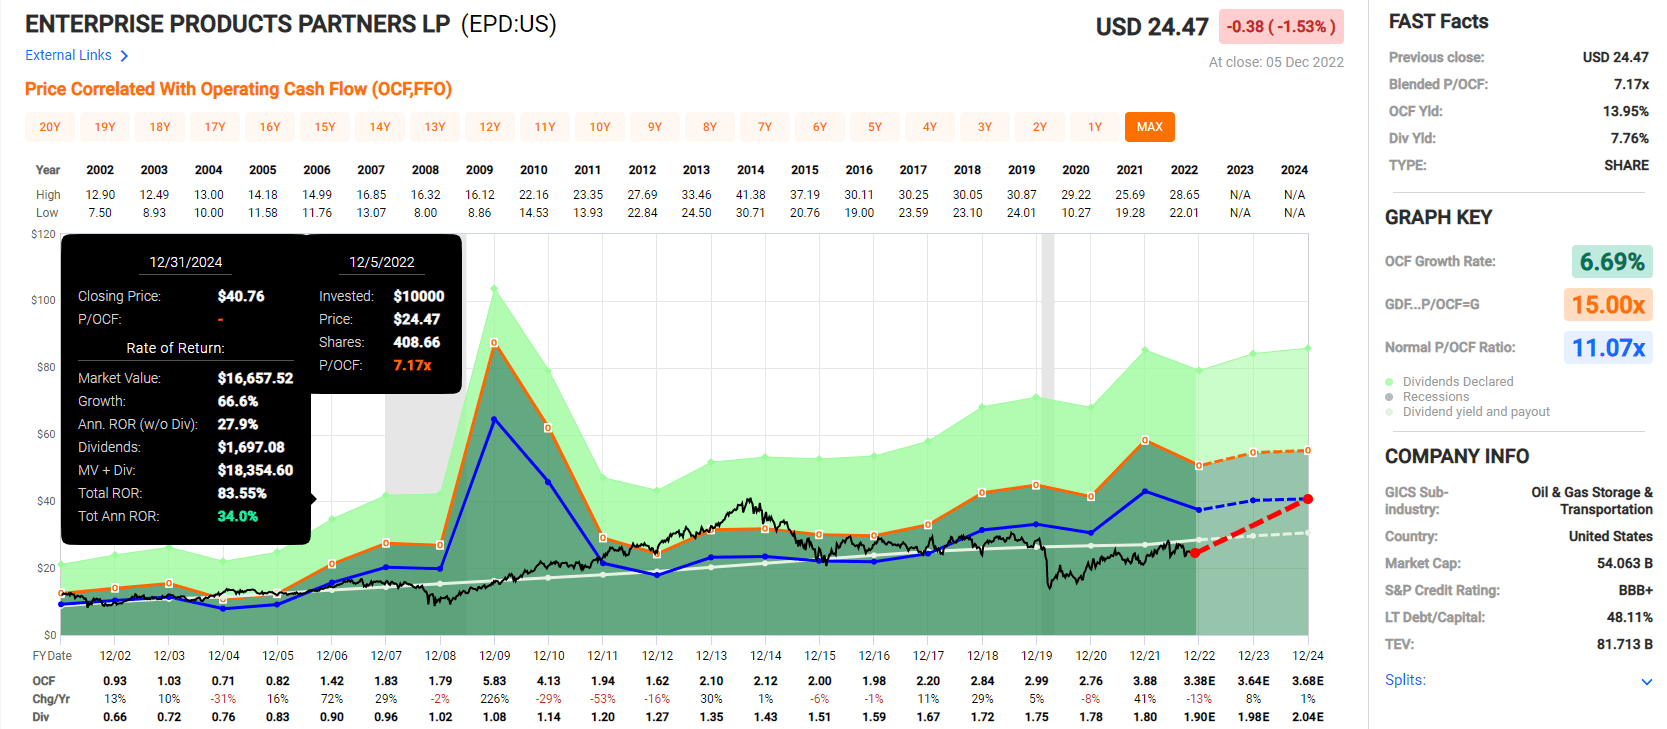
Altria 2024 Consensus Total Return Potential
(Source: FAST Graphs, FactSet)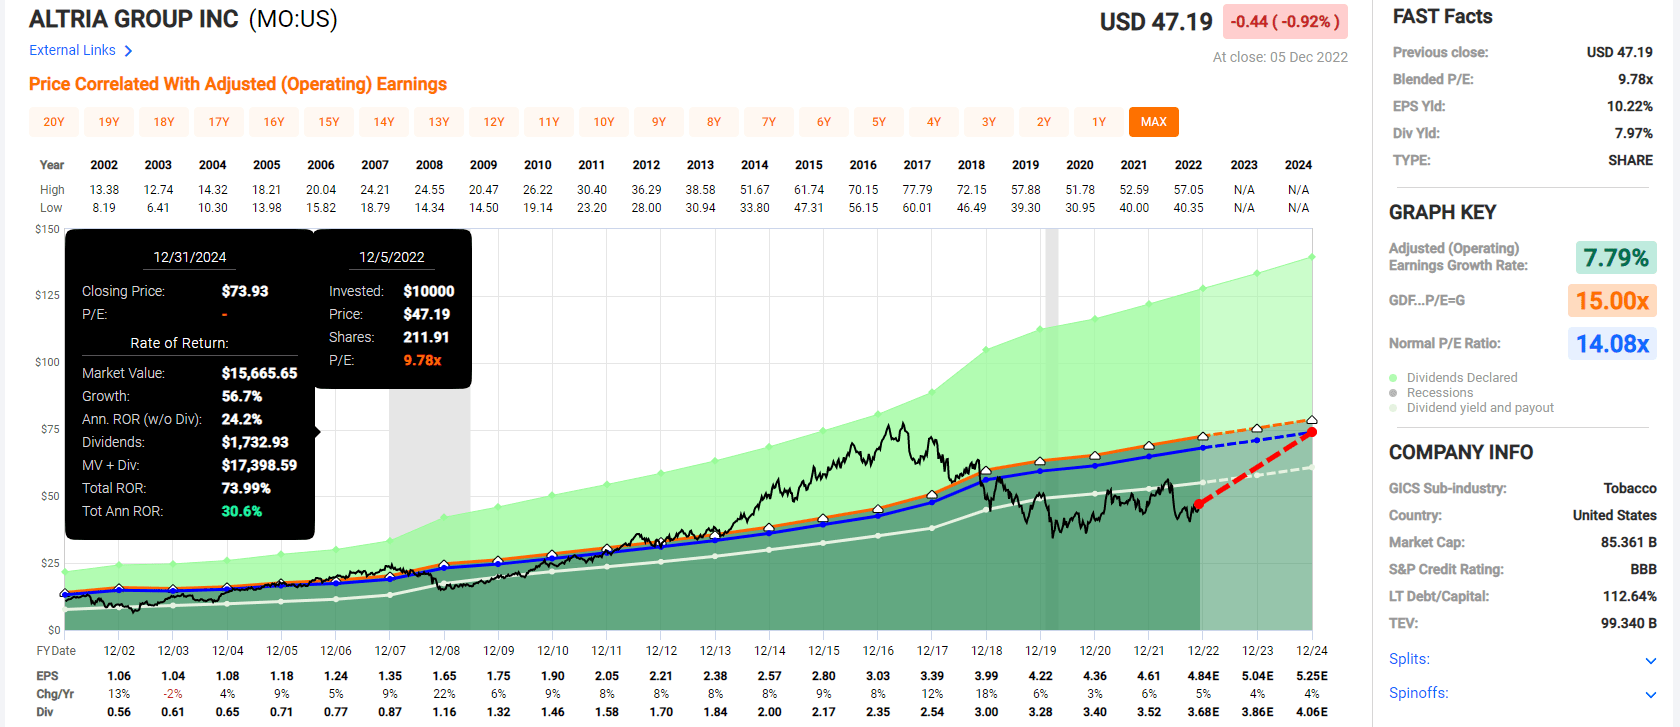
Legal & General 2024 Consensus Total Return Potential
(Source: FAST Graphs, FactSet)
Now compare that to the S&P 500.
S&P 500 2024 Consensus Return Potential
(Source: FAST Graphs, FactSet)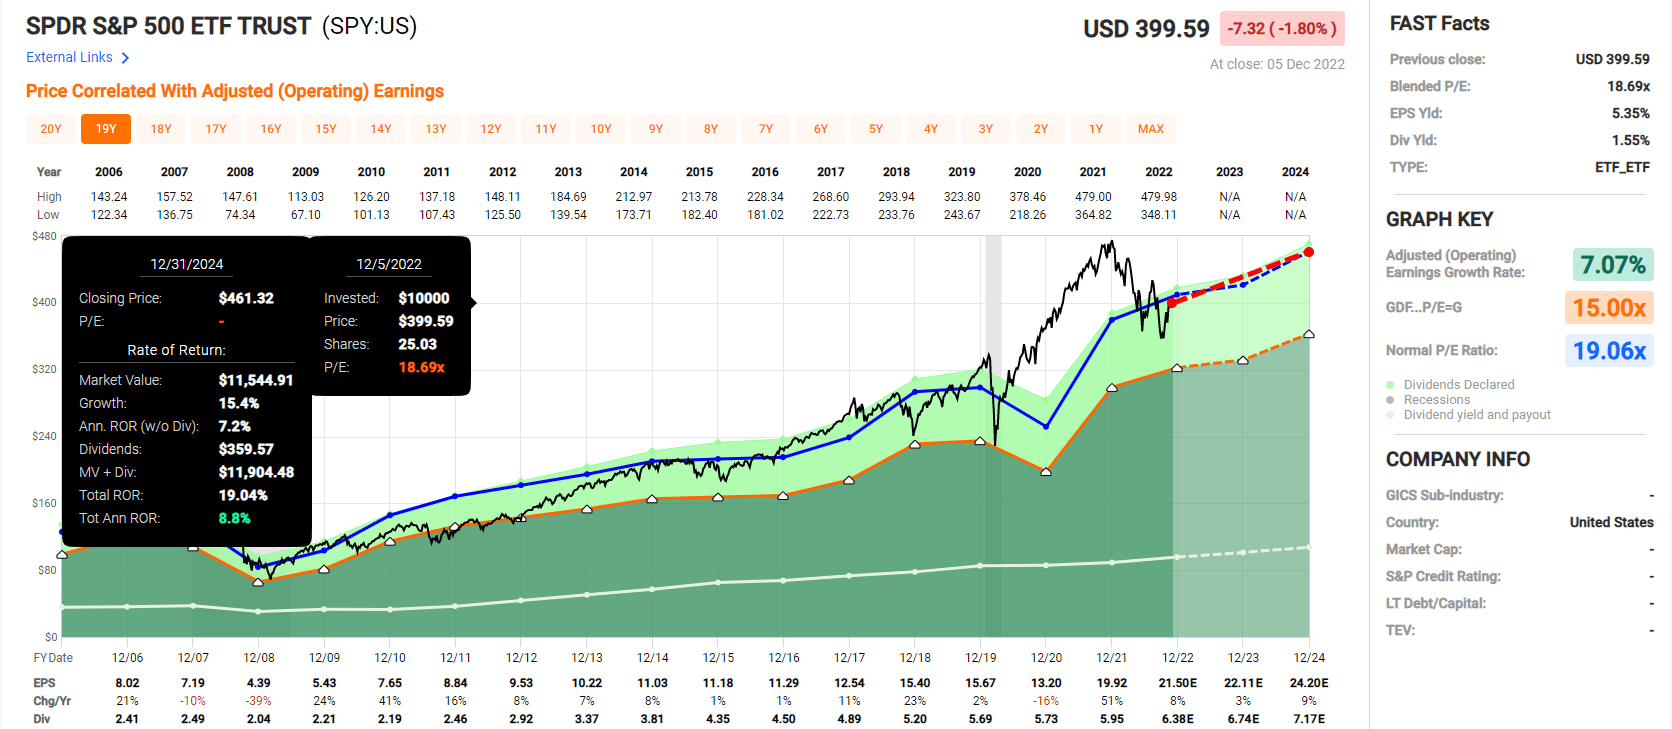
Analysts expect the market to deliver a 19% return over the next two years.
- 5 Ultra-Yield blue-chips: 27% annual returns over the next two years
- 61% consensus two-year total return potential: = 3X more than the S&P 500
- with almost 5X the very safe yield
But my goal isn’t to help you potentially earn 61% returns in two years, I’m trying to help you retire in safety and splendor.
Here’s how these five ultra-yield blue-chips can do that.
Five Of The Highest Quality Ultra-Yield Blue-Chips On Wall Street
(Source: Dividend Kings Zen Research Terminal)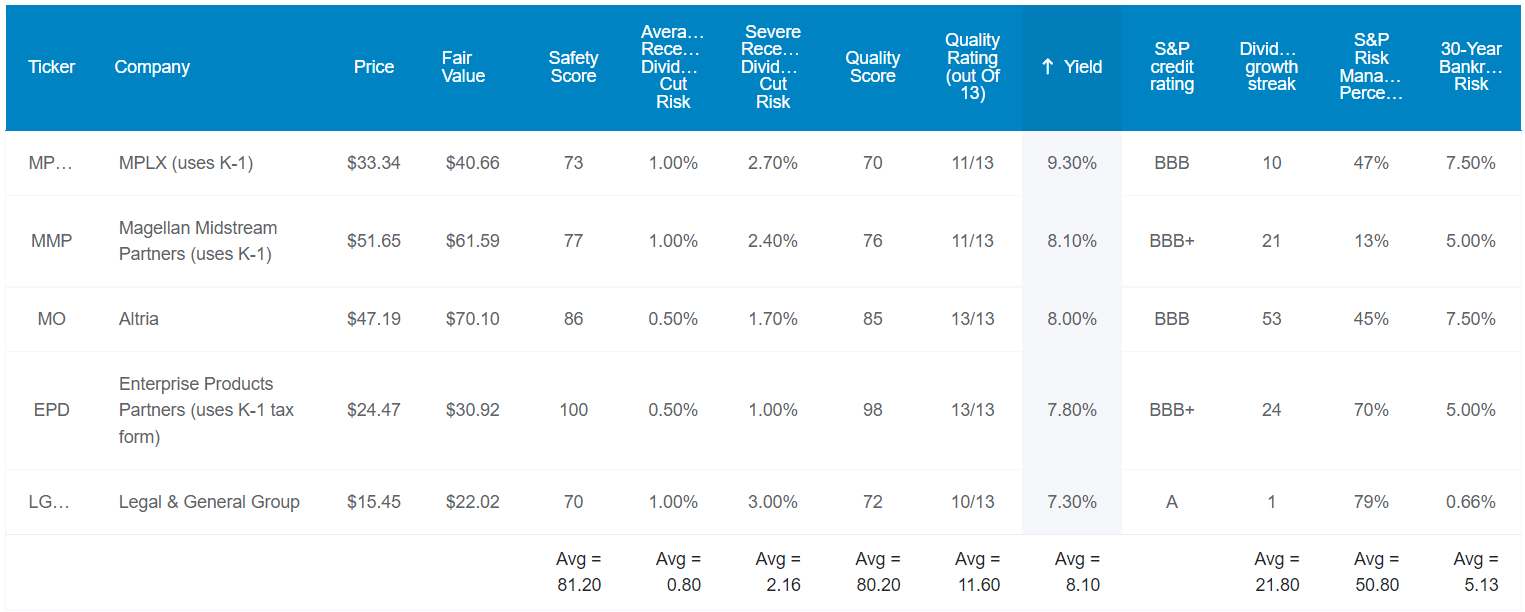
These aren’t just ultra-yield blue-chips; they are 11.6/13 Super SWANs (sleep well at night). What does that mean?
- 0.8% risk of a dividend cut during a historically average recession since WWII
- 2.2% risk of a dividend cut in a Pandemic or Great Recession level economic downturn
Ben Graham considered a 20+ year streak without a dividend cut an important sign of quality. A 20+ year dividend growth streak is a sign of excellence.
These ultra-yield Super SWANs have a 22-year average dividend growth streak.
What’s more, their average credit rating is BBB+ stable, with a 5.1% 30-year bankruptcy risk, according to S&P.
- BBB-rated bonds yield 5.6% right now
- with no income growth
What about long-term risk?
DK uses S&P Global’s global long-term risk-management ratings for our risk rating.
- S&P has spent over 20 years perfecting their risk model
- which is based on over 30 major risk categories, over 130 subcategories, and 1,000 individual metrics
- 50% of metrics are industry specific
- this risk rating has been included in every credit rating for decades
The DK risk rating is based on the global percentile of how a company’s risk management compares to 8,000 S&P-rated companies covering 90% of the world’s market cap.
5 Ultra-Yield Super SWANs score 51st Percentile On Global Long-Term Risk Management
S&P’s risk management scores factor in things like:
- supply chain management
- crisis management
- cyber-security
- privacy protection
- efficiency
- R&D efficiency
- innovation management
- labor relations
- talent retention
- worker training/skills improvement
- occupational health & safety
- customer relationship management
- business ethics
- climate strategy adaptation
- sustainable agricultural practices
- corporate governance
- brand management
If you can think of anything that could go wrong with these businesses, S&P has already thought of it and included it in their model.
5 Ultra-Yield Super SWANs’ Long-Term Risk Management Is The 318th Best In The Master List 36th Percentile In The Master List
| Classification | S&P LT Risk-Management Global Percentile |
Risk-Management Interpretation |
Risk-Management Rating |
| BTI, ILMN, SIEGY, SPGI, WM, CI, CSCO, WMB, SAP, CL | 100 | Exceptional (Top 80 companies in the world) | Very Low Risk |
| Strong ESG Stocks | 86 |
Very Good |
Very Low Risk |
| Foreign Dividend Stocks | 77 |
Good, Bordering On Very Good |
Low Risk |
| Ultra SWANs | 74 | Good | Low Risk |
| Enterprise Products Partners | 70 | Good | Low Risk |
| Dividend Aristocrats | 67 | Above-Average (Bordering On Good) | Low Risk |
| Low Volatility Stocks | 65 | Above-Average | Low Risk |
| Master List average | 61 | Above-Average | Low Risk |
| Dividend Kings | 60 | Above-Average | Low Risk |
| Hyper-Growth stocks | 59 | Average, Bordering On Above-Average | Medium Risk |
| Dividend Champions | 55 | Average | Medium Risk |
| 5 Ultra-Yield Super SWANs | 51 | Average | Medium Risk |
| Monthly Dividend Stocks | 41 | Average | Medium Risk |
(Source: DK Research Terminal)
Their risk-management consensus is in the bottom 36% of the world’s best blue-chips, and is similar to:
- Honeywell (HON): Ultra SWAN
- Costco (COST): Super SWAN
- General Dynamics (GD): Super SWAN dividend aristocrat
- NextEra Energy (NEE): Super SWAN dividend aristocrat
- Essex Property Trust (ESS): Ultra SWAN dividend aristocrat
The bottom line is that all companies have risks, and these Ultra-Yield Super SWANs are average at managing theirs, according to S&P.
Ok, so now that you know why these five blue-chips offer the safest 8% yield on Wall Street, here is why you might want to buy them today.
Wonderful Companies At Wonderful Prices
(Source: Dividend Kings Zen Research Terminal)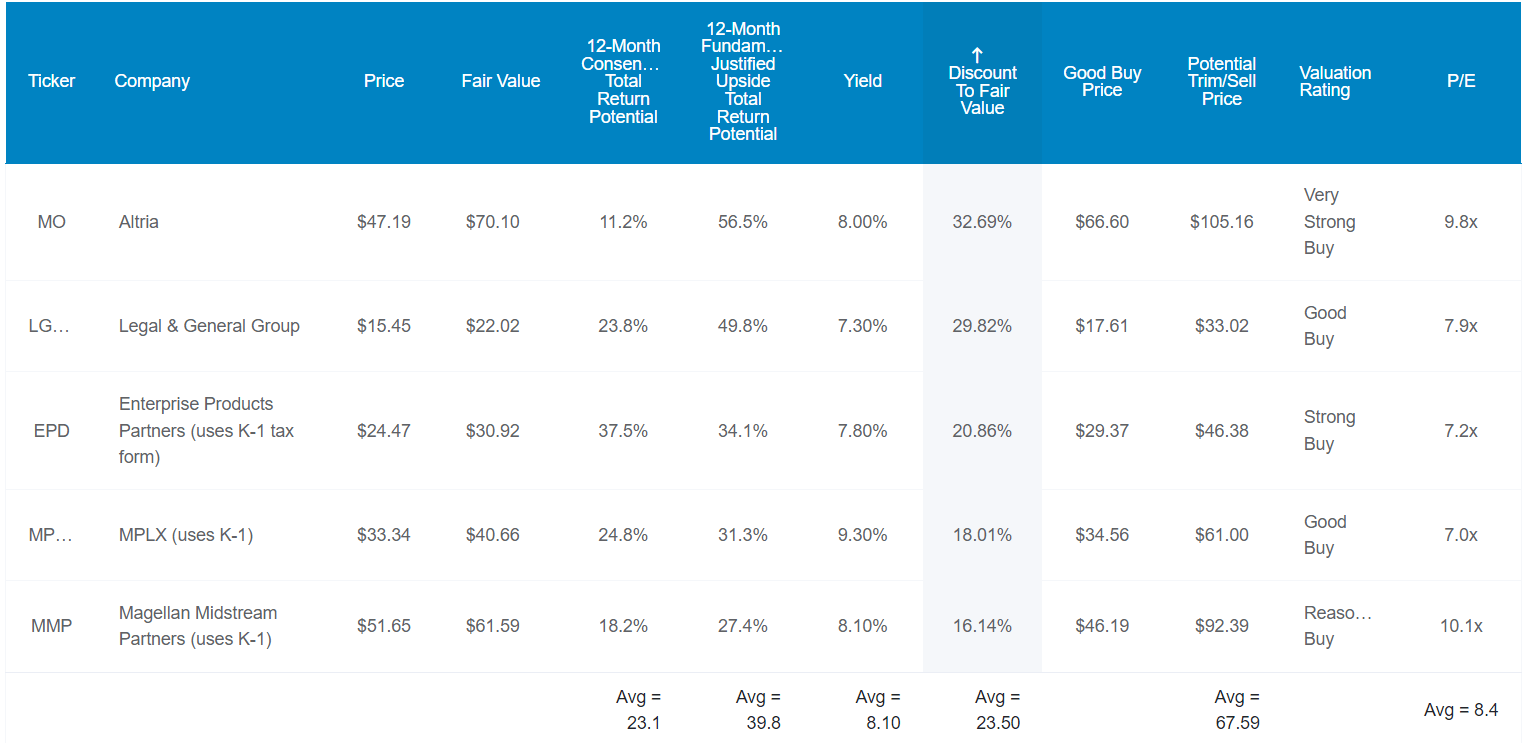
For context, the S&P trades at 17.4X forward earnings, a 3% historical premium.
These ultra-yield Super SWANs? Just 8.4X earnings or cash flow.
How cheap is that?
- during the Great Recession, the S&P bottomed at 11.7X earnings
- the last time the S&P traded at 8.4X earnings was in 1980
- these ultra-yield Super SWANs are trading at valuations the S&P hasn’t seen in 42 years and likely never will again
That’s why analysts expect 23% total returns in the next year alone. But their 12-month fundamentally justified total return potential is 40%.
If they all grow as expected and return to historical mid-range market-determined fair value within 12 months, you’ll earn 40%
But my goal isn’t to help you earn 23% in one year, or even 40% or even 61% over two years.
I want to show you how these five ultra-yield Super SWANs can potentially earn you 37X returns over the next 30 years.
Ultra-Yield Today And A Potentially Rich Retirement Tomorrow
(Source: Dividend Kings Zen Research Terminal)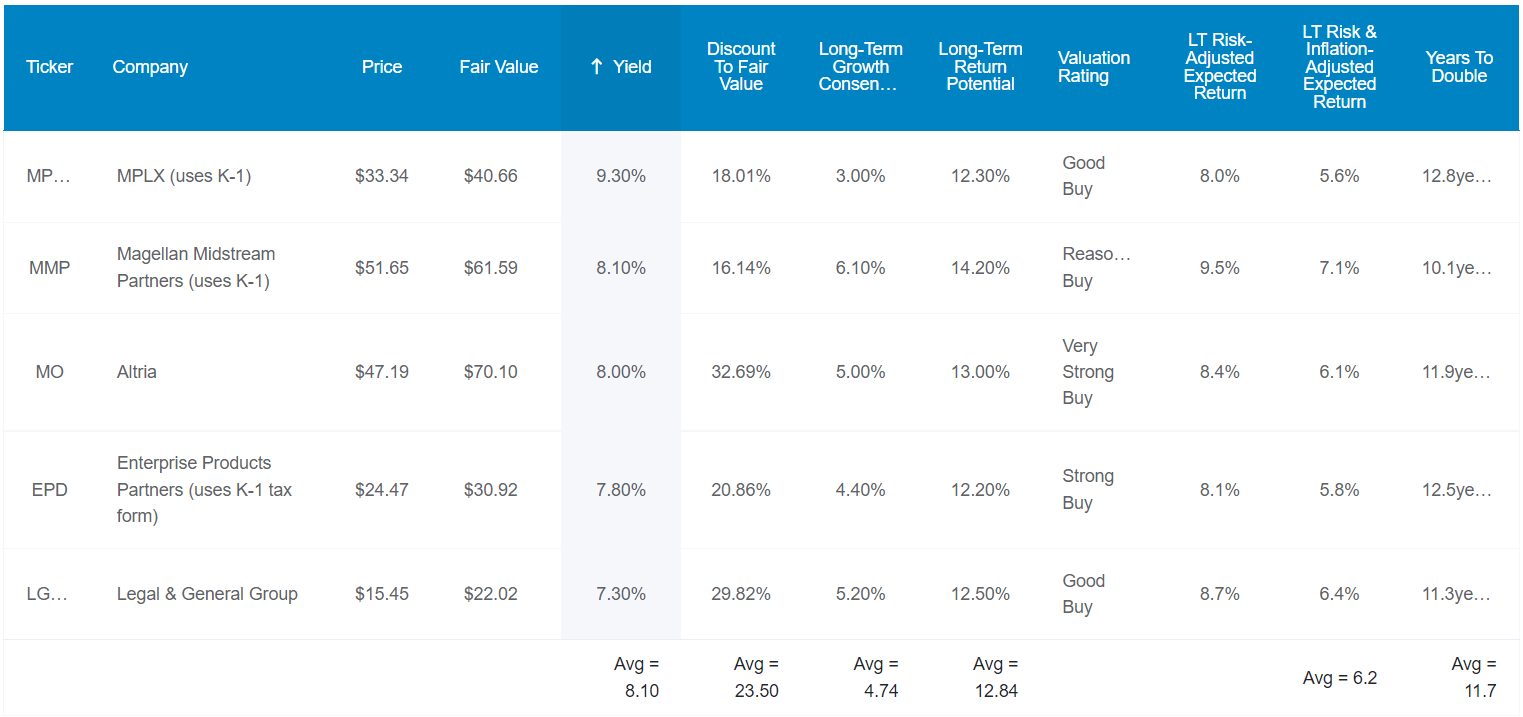
These Ultra-Yield Super SWANs offer the safest 8.1% yield on Wall Street AND are also growing at almost 5%.
That means a 12.8% annual long-term return potential. How impressive is that?
Consensus Long-Term Return Potential (Ignoring Valuation)
| Investment Strategy | Yield | LT Consensus Growth | LT Consensus Total Return Potential | Long-Term Risk-Adjusted Expected Return | Long-Term Inflation And Risk-Adjusted Expected Returns | Years To Double Your Inflation & Risk-Adjusted Wealth |
10-Year Inflation And Risk-Adjusted Expected Return |
| 5 Ultra-Yield Super SWANs | 8.1% | 4.7% | 12.8% | 9.0% | 6.6% | 10.9 | 1.90 |
| Safe Midstream | 5.9% | 6.4% | 12.3% | 8.6% | 6.3% | 11.5 | 1.84 |
| REITs | 3.9% | 6.1% | 10.0% | 7.0% | 4.7% | 15.4 | 1.58 |
| Schwab US Dividend Equity ETF | 3.5% | 8.5% | 12.0% | 8.4% | 6.0% | 11.9 | 1.80 |
| Dividend Aristocrats | 2.6% | 8.5% | 11.1% | 7.8% | 5.4% | 13.2 | 1.70 |
| 60/40 Retirement Portfolio | 2.1% | 5.1% | 7.2% | 5.0% | 2.7% | 26.6 | 1.31 |
| Nasdaq | 0.8% | 11.8% | 12.6% | 8.8% | 6.5% | 11.0 | 1.88 |
(Sources: DK Research Terminal, FactSet)
Their yield alone is more than the 60/40 is expected to deliver long-term.
- 60/40’s long-term historical return is 7.4% annually
In fact, a 12.8% long-term return potential is better than almost any popular investment strategy, including the Nasdaq.
What might that potentially mean for you?
Inflation-Adjusted Consensus Total Return Potential Per $1,000 Investment
| Time Frame (Years) | 7.8% CAGR Inflation-Adjusted S&P 500 Consensus | 8.8% Inflation-Adjusted Aristocrat Consensus | 10.5% CAGR Inflation-Adjusted 5 Ultra-Yield Super SWAN Consensus | Difference Between Inflation-Adjusted 5 Ultra-Yield Super SWAN Consensus And S&P Consensus |
| 5 | $1,453.75 | $1,526.66 | $1,645.21 | $191.46 |
| 10 | $2,113.39 | $2,330.70 | $2,706.72 | $593.34 |
| 15 | $3,072.33 | $3,558.19 | $4,453.13 | $1,380.80 |
| 20 | $4,466.40 | $5,432.16 | $7,326.34 | $2,859.94 |
| 25 | $6,493.02 | $8,293.08 | $12,053.38 | $5,560.36 |
| 30 (retirement time frame) | $9,439.23 | $12,660.73 | $19,830.36 | $10,391.13 |
| 35 | $13,722.27 | $19,328.67 | $32,625.14 | $18,902.87 |
| 40 | $19,948.73 | $29,508.37 | $53,675.26 | $33,726.53 |
| 45 | $29,000.45 | $45,049.33 | $88,307.16 | $59,306.71 |
| 50 | $42,159.37 | $68,775.14 | $145,283.97 | $103,124.60 |
| 55 | $61,289.14 | $104,996.45 | $239,022.88 | $177,733.73 |
| 60 (investing lifetime) | $89,099.03 | $160,294.18 | $393,243.22 | $304,144.19 |
| 100 (charitable trust, institutional time frame, multi-generational wealth) | $1,777,412.73 | $4,730,019.35 | $21,107,432.10 | $19,330,019.37 |
(Source: DK Research Terminal, FactSet)
Over the next 30 years, these ultra-yield Super SWANs could deliver 20X inflation-adjusted returns and 37X not-adjusting for inflation.
Over an investing lifetime, they have the potential for almost 400X real returns.
| Time Frame (Years) | Ratio Inflation-Adjusted 5 Ultra-Yield Super SWAN Consensus/Aristocrat Consensus | Ratio Inflation-Adjusted 5 Ultra-Yield Super SWAN Consensus vs. S&P consensus |
| 5 | 1.08 | 1.13 |
| 10 | 1.16 | 1.28 |
| 15 | 1.25 | 1.45 |
| 20 | 1.35 | 1.64 |
| 25 | 1.45 | 1.86 |
| 30 | 1.57 | 2.10 |
| 35 | 1.69 | 2.38 |
| 40 | 1.82 | 2.69 |
| 45 | 1.96 | 3.05 |
| 50 | 2.11 | 3.45 |
| 55 | 2.28 | 3.90 |
| 60 | 2.45 | 4.41 |
| 100 | 4.46 | 11.88 |
(Source: DK Research Terminal, FactSet)
That means the potential to double the market over the next 30 years and more than quadruple it over an investing lifetime.
OK, that sounds pretty amazing, but what evidence is there that these ultra-yield blue-chips can deliver anything close to 13% long-term returns, much less beat the Nasdaq?
Historical Returns Since 2001
The future doesn’t repeat, but it often rhymes. – Mark Twain
Remember, “past performance is no guarantee of future results.”
But studies show that blue chips with relatively stable fundamentals offer predictable returns based on yield, growth and valuation mean reversion over time.
Bank of America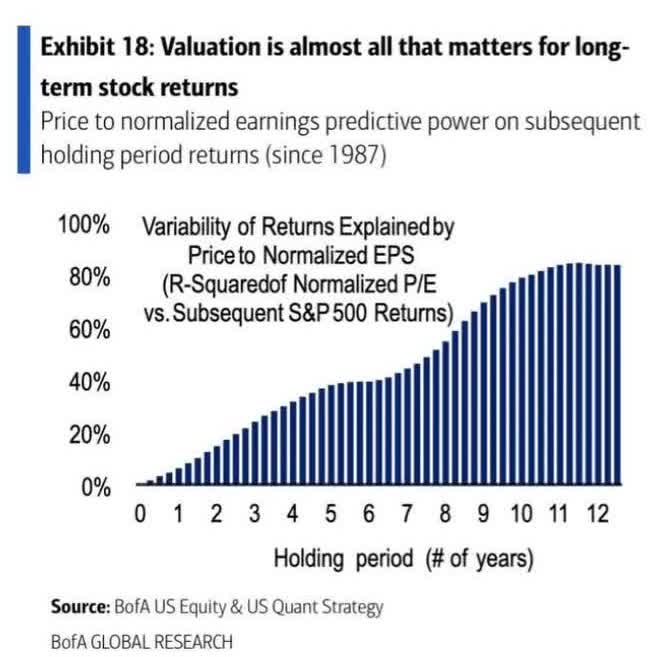
21 years is a time period when 90% of returns are a result of fundamentals, not luck.
(Source: Portfolio Visualizer Premium)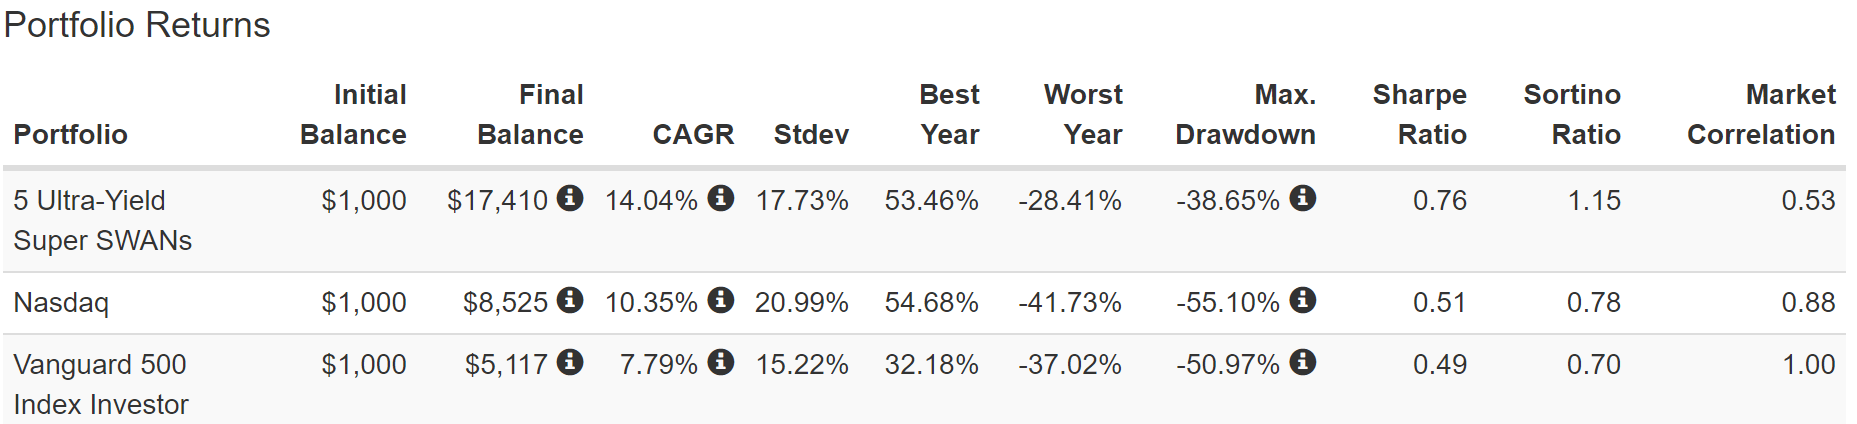
Close to 13% long-term returns? 14%.
Market-beating returns? Try 2X the market’s annual return.
Beating the Nasdaq? 40% better annual returns and with a lot less volatility.
(Source: Portfolio Visualizer Premium)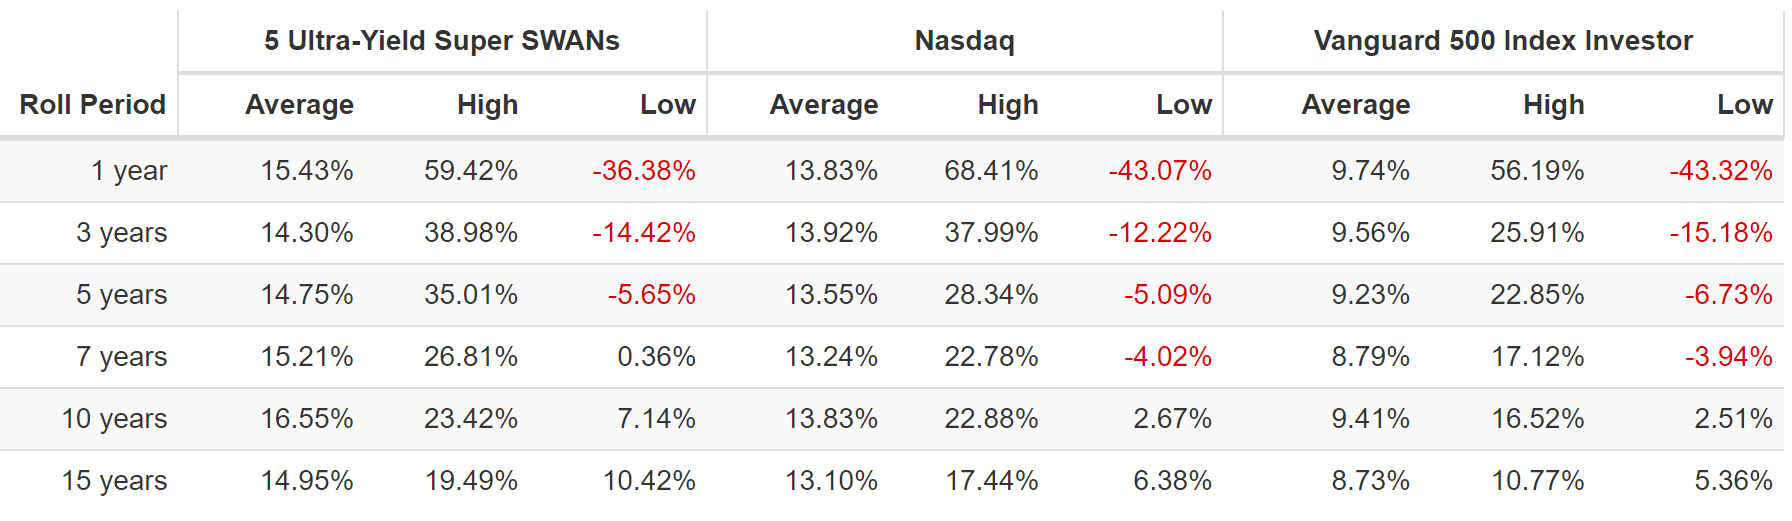
Very consistent market and Nasdaq-beating returns.
And let’s not forget about the main benefit of ultra-yield blue-chips, the income!
Income That Rich Retirements Are Made Of
2007 and 2008 were 3 MO spin-offs ((Source: Portfolio Visualizer Premium))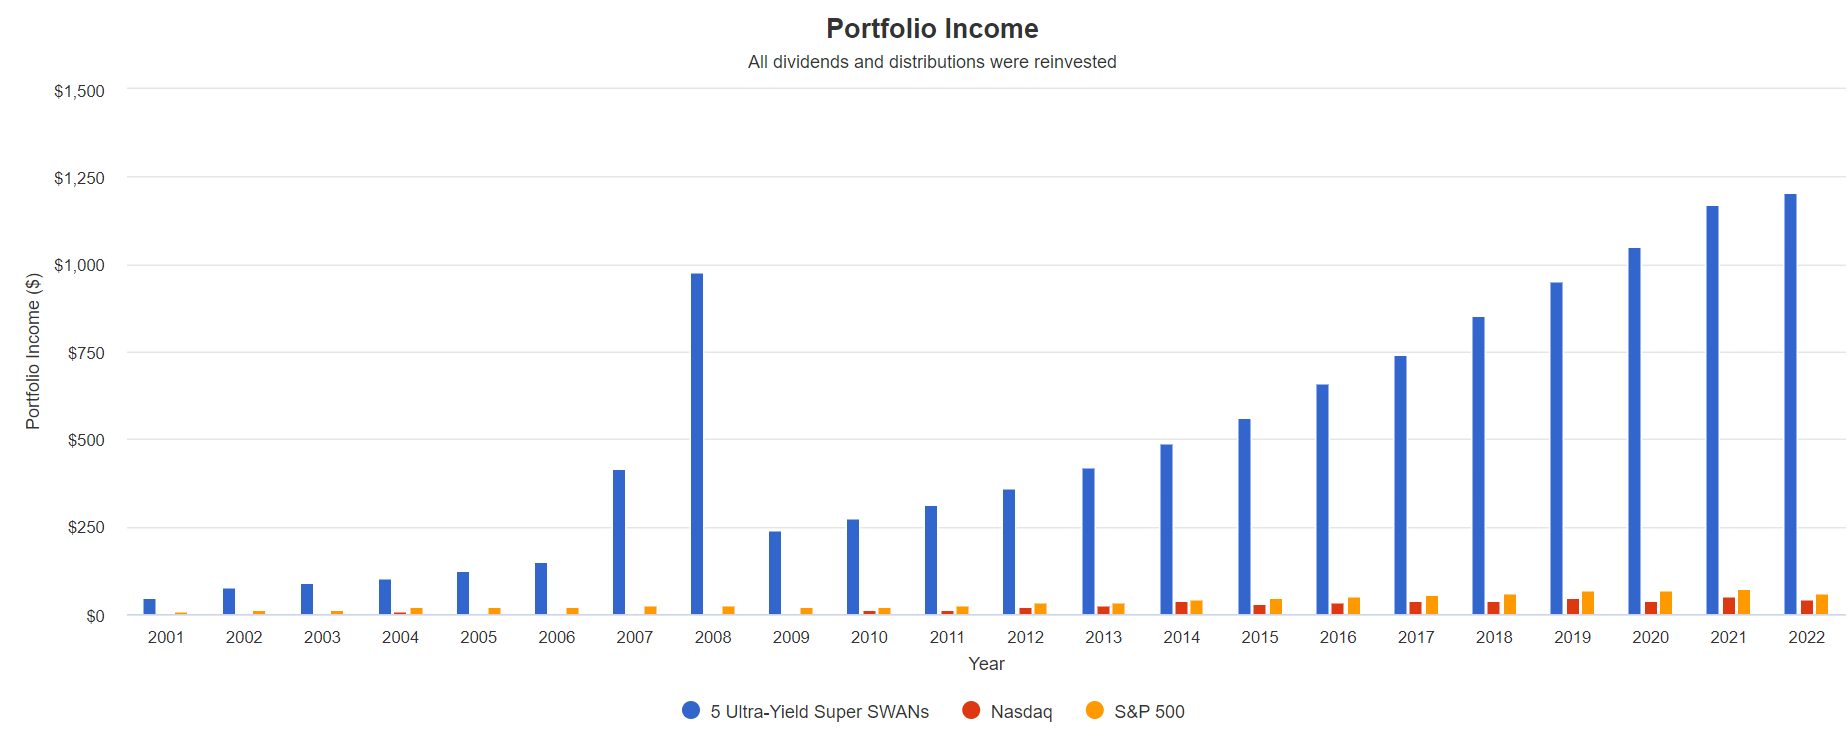
Doesn’t that chart look impressive? Well, then, this table will knock your socks off!
Cumulative Dividends Since 2001 Per $1,000 Initial Investment
| Metric | S&P 500 | Nasdaq | 5 Ultra-Yield Super SWANs |
| Total Dividends | $823 | $464 | $11,272 |
| Total Inflation-Adjusted Dividends | $484.12 | $272.94 | $6,630.59 |
| Annualized Income Growth Rate | 7.4% | 15.1% | 15.4% |
| Total Income/Initial Investment % | 0.82 | 0.46 | 11.27 |
| Inflation-Adjusted Income/Initial Investment % | 0.48 | 0.27 | 6.63 |
| More Inflation-Adjusted Income Than S&P 500 | NA | 0.56 | 13.70 |
| Starting Yield | 1.3% | 0.4% | 6.0% |
| Today’s Annual Dividend Return On Your Starting Investment (Yield On Cost) | 5.8% | 4.4% | 120.4% |
| 2022 Inflation-Adjusted Annual Dividend Return On Your Starting Investment (Inflation-Adjusted Yield On Cost) | 3.4% | 2.6% | 70.8% |
(Source: Portfolio Visualizer Premium)
These ultra-yield Super SWANs grew their dividends faster than the Nasdaq for 20 years.
They paid out 14X more inflation-adjusted dividends than the S&P 500 and 28X more than the Nasdaq.
They’ve repaid your initial investment almost 7X over in inflation-adjusted dividends.
And their inflation-adjusted yield on cost is now 71%.
- For every $1 invested in 2001, you’re now getting $0.71 in inflation-adjusted dividends
Step 2: Building A Complete Retirement Portfolio
This video explains in detail how we built the DK ZEUS recession-optimized retirement portfolio system.
- ZEUS = Zen Extraordinary Ultra SWAN
The easiest way to build a Rolls Royce retirement portfolio that can achieve:
- 2X to 3X better yield than a 60/40
- much higher 30% to 100% better long-term returns than a 60/40
- S&P matching or beating returns
- 33% less annual volatility than the market
- 33% to 66% peak declines than the S&P in even the most extreme market crashes
This is the king of sleep-well-at-night retirement portfolio strategies, and it looks like this.
- 33% blue-chip ETFs
- 33% hedging ETFs
- 33% individual blue-chips (to boost yield and returns)
So here is how the ZEUS Ultra-Yield portfolio looks.
Now take a look at the fundamentals.
ZEUS Ultra-Yield Vs. 60/40
| Metric | 60/40 | ZEUS Ultra-Yield Portfolio | X Better Than 60/40 |
| Yield | 2.1% | 5.9% | 2.81 |
| Growth Consensus | 5.1% | 4.1% | 0.80 |
| LT Consensus Total Return Potential | 7.2% | 10.0% | 1.39 |
| Risk-Adjusted Expected Return | 5.0% | 7.0% | 1.39 |
| Safe Withdrawal Rate (Risk And Inflation-Adjusted Expected Returns) | 2.8% | 4.7% | 1.71 |
| Conservative Time To Double (Years) | 26.0 | 15.2 | 1.71 |
(Source: DK Research Terminal, FactSet)
3X the yield of a 60/40. We just potentially tripled your retirement income in 30 minutes.
- how long it takes to build a portfolio using our tools
40% better long-term return potential and a 4.7% perpetual withdrawal rate almost 2X better than a 60/40.
But wait, it gets better. ZEUS Ultra-Yield isn’t just for retirees. It’s also a fine alternative for young investors looking for great yield today and market-matching returns with super-low volatility.
ZEUS Ultra-Yield Vs. S&P 500
| Metric | S&P 500 | ZEUS Ultra-Yield Portfolio | X Better Than S&P 500 |
| Yield | 1.70% | 5.9% | 3.47 |
| Growth Consensus | 8.5% | 4.1% | 0.48 |
| LT Consensus Total Return Potential | 10.2% | 10.0% | 0.98 |
| Risk-Adjusted Expected Return | 7.1% | 7.0% | 0.98 |
| Safe Withdrawal Rate (Risk And Inflation-Adjusted Expected Returns) | 4.9% | 4.7% | 0.97 |
| Conservative Time To Double (Years) | 14.8 | 15.2 | 0.97 |
(Source: DK Research Terminal, FactSet)
What does this potentially mean for retirees?
Inflation-Adjusted Consensus Total Return Potential: $510,000 Average Retired Couples Savings
| Time Frame (Years) | 4.9% CAGR Inflation-Adjusted 60/40 | 7.7% Inflation-Adjusted ZEUS Income Growth Portfolio | Difference Between ZEUS Income Growth Portfolio Consensus and 60/40 Consensus |
| 5 | $646,884.16 | $737,978.55 | $91,094.40 |
| 10 | $820,508.07 | $1,067,867.35 | $247,359.28 |
| 15 | $1,040,732.69 | $1,545,221.96 | $504,489.27 |
| 20 | $1,320,065.67 | $2,235,962.10 | $915,896.43 |
| 25 | $1,674,371.70 | $3,235,474.66 | $1,561,102.95 |
| 30 (retirement time frame) | $2,123,773.59 | $4,681,786.10 | $2,558,012.51 |
| 35 | $2,693,795.09 | $6,774,623.01 | $4,080,827.93 |
| 40 | $3,416,810.53 | $9,802,993.13 | $6,386,182.60 |
| 45 | $4,333,883.54 | $14,185,095.48 | $9,851,211.95 |
| 50 | $5,497,099.23 | $20,526,071.09 | $15,028,971.87 |
| 55 | $6,972,522.37 | $29,701,569.15 | $22,729,046.78 |
| 60 (investing lifetime) | $8,843,949.55 | $42,978,668.75 | $34,134,719.21 |
| 100 (charitable trust, institutional, multi-generational wealth timeframe) | $59,251,176.27 | $826,116,851.89 | $766,865,675.61 |
(Source: DK Research Terminal, FactSet)
ZEUS Ultra-Yield could potentially deliver the average retired couple an extra $2.6 million in inflation-adjusted wealth over a 30-year retirement.
For young investors, it could possibly generate life-changing 84X returns over an investing lifetime.
For those looking to give money to charity via a perpetual charitable trust, that’s a potential $767 million in additional inflation-adjusted donations.
| Time Frame (Years) |
Ratio ZEUS Income Growth Portfolio Vs. 60/40 Consensus |
| 5 | 1.14 |
| 10 | 1.30 |
| 15 | 1.48 |
| 20 | 1.69 |
| 25 | 1.93 |
| 30 | 2.20 |
| 35 | 2.51 |
| 40 | 2.87 |
| 45 | 3.27 |
| 50 | 3.73 |
| 55 | 4.26 |
| 60 | 4.86 |
| 100 | 13.94 |
(Source: DK Research Terminal, FactSet)
OK, this seems amazing, but what evidence is that ZEUS Ultra-Yield can deliver these incredible results?
Historical Returns Since December 2007 (Start of The Great Recession)
(Source: Portfolio Visualizer Premium)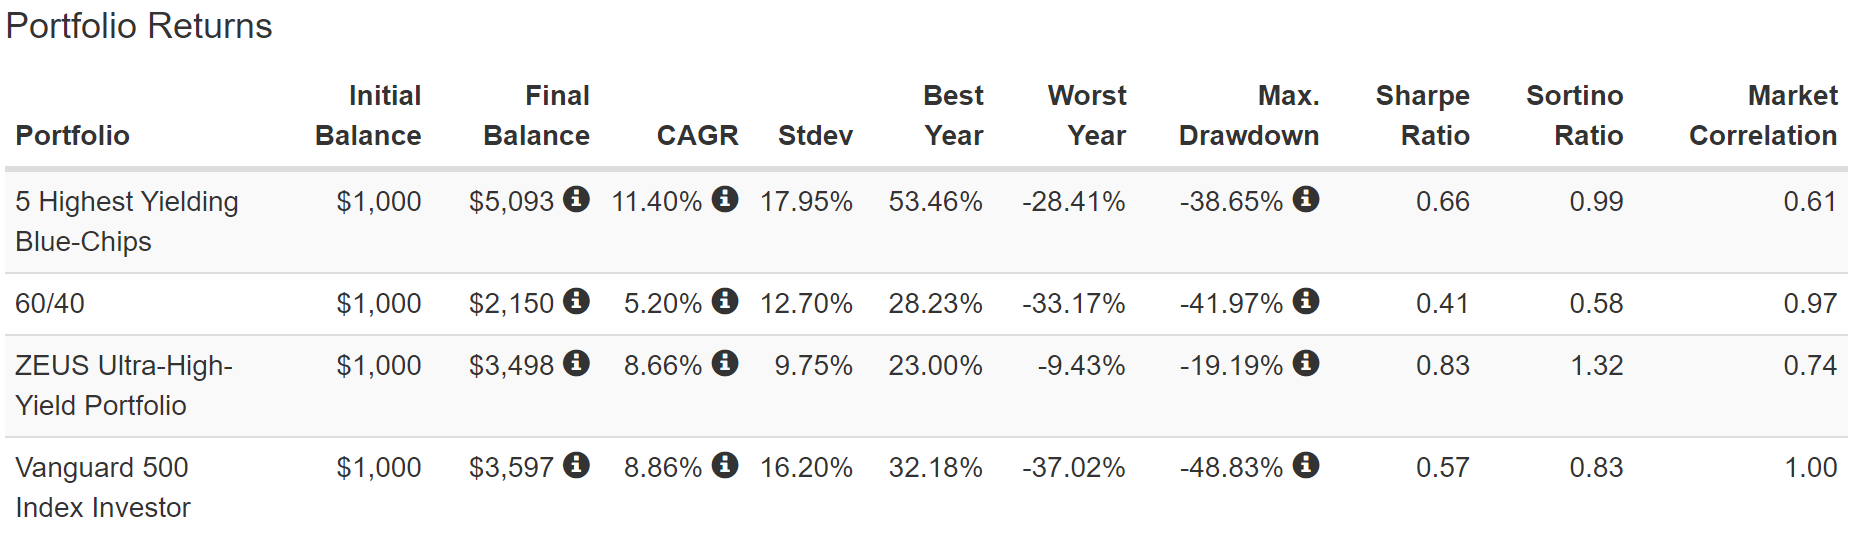
3% better returns than the 60/40? Check.
Market-matching returns? Check.
Much lower annual volatility than either a 60/40 or the S&P 500? Check.
Peak decline of 50% or less of the market in even the most extreme market crashes? ZEUS didn’t even fall 20% in the 2nd worst market crash in US history.
(Source: Portfolio Visualizer Premium)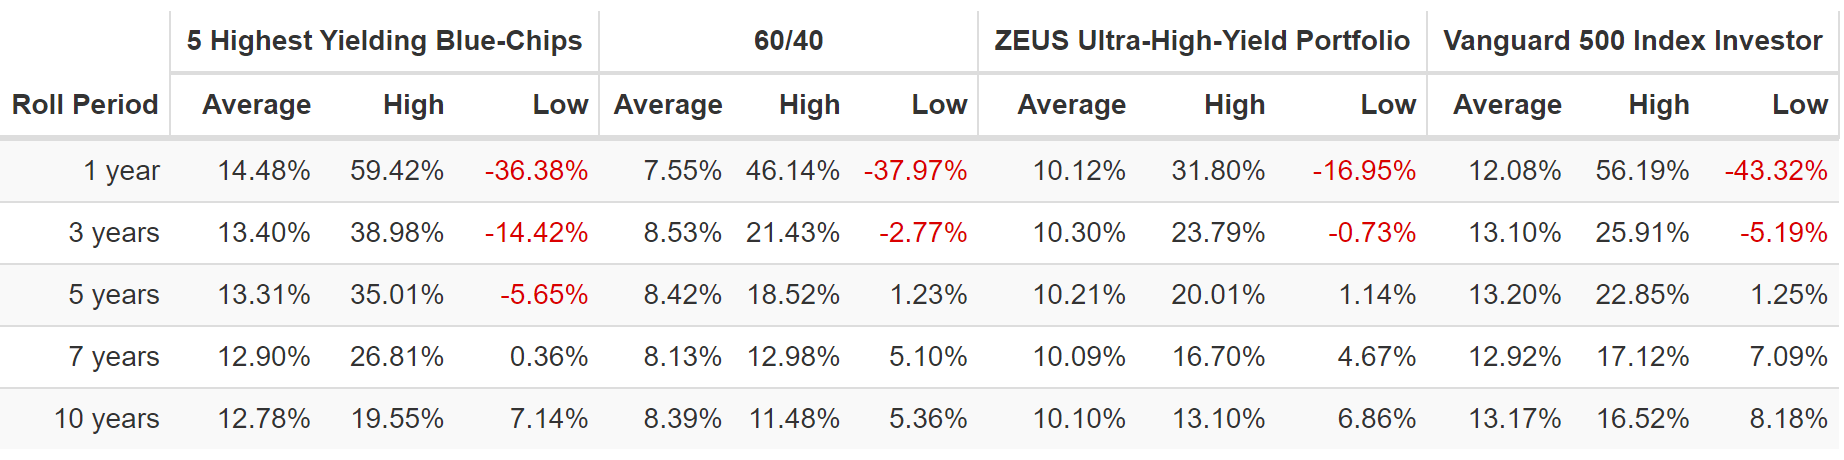
10% annual returns, just as we expected in the future, but those returns were smooth as silk.
(Source: Portfolio Visualizer Premium)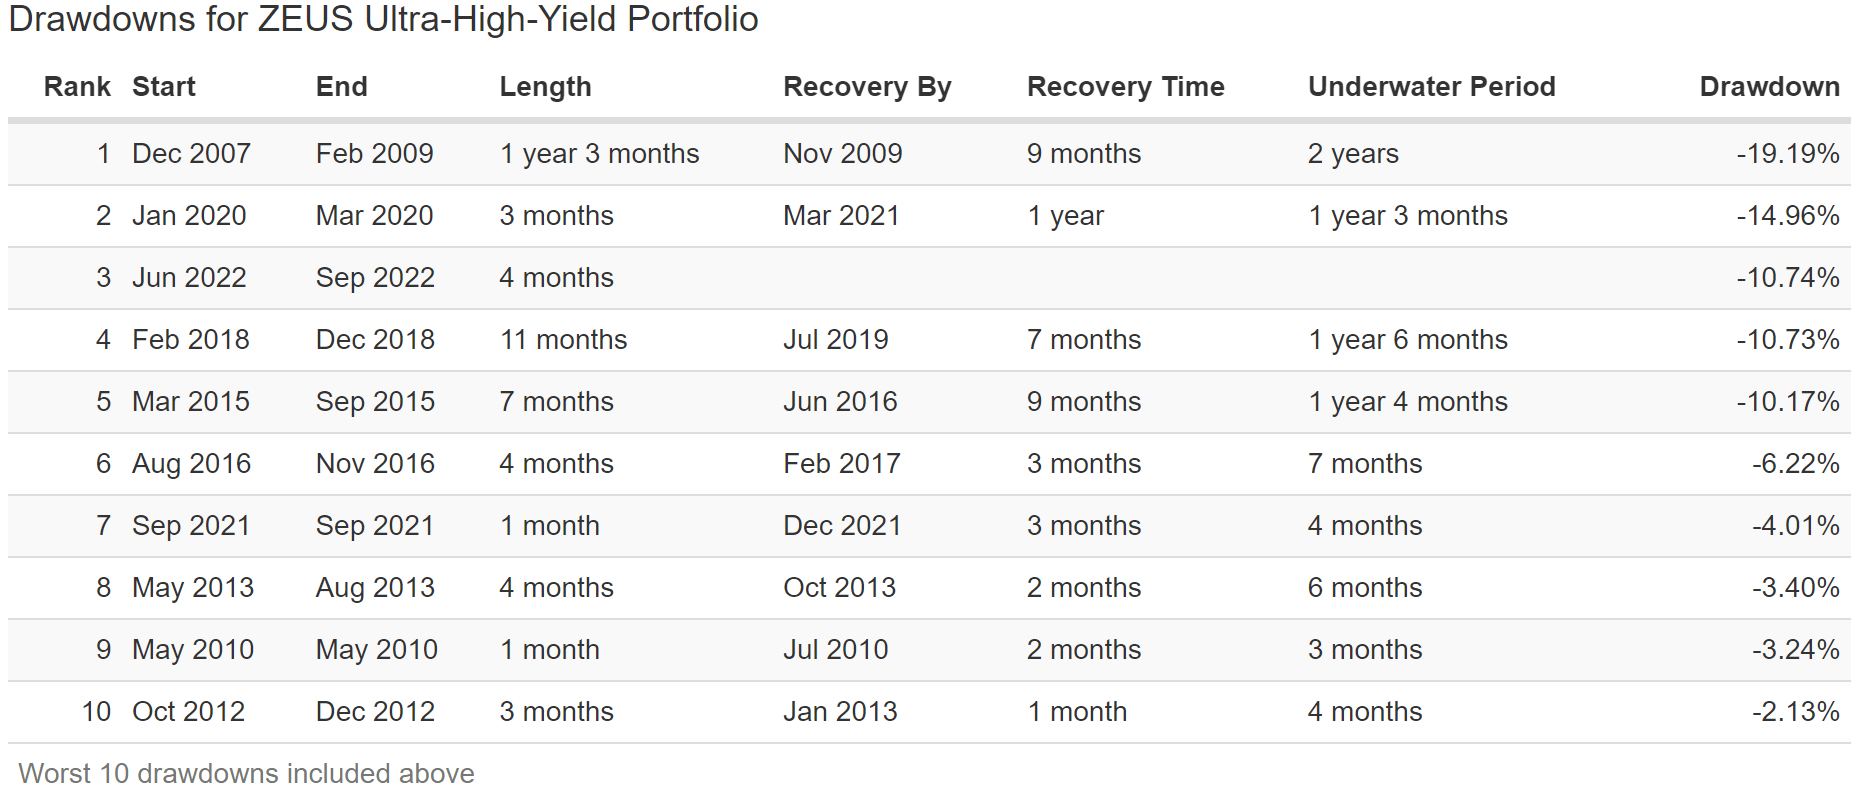
The 60/40 has had two bear markets in the last 15 years and the S&P four.
ZEUS? None, not even in the Great Recession.
ZEUS Ultra-Yield During The Great Recession
(Source: Portfolio Visualizer Premium)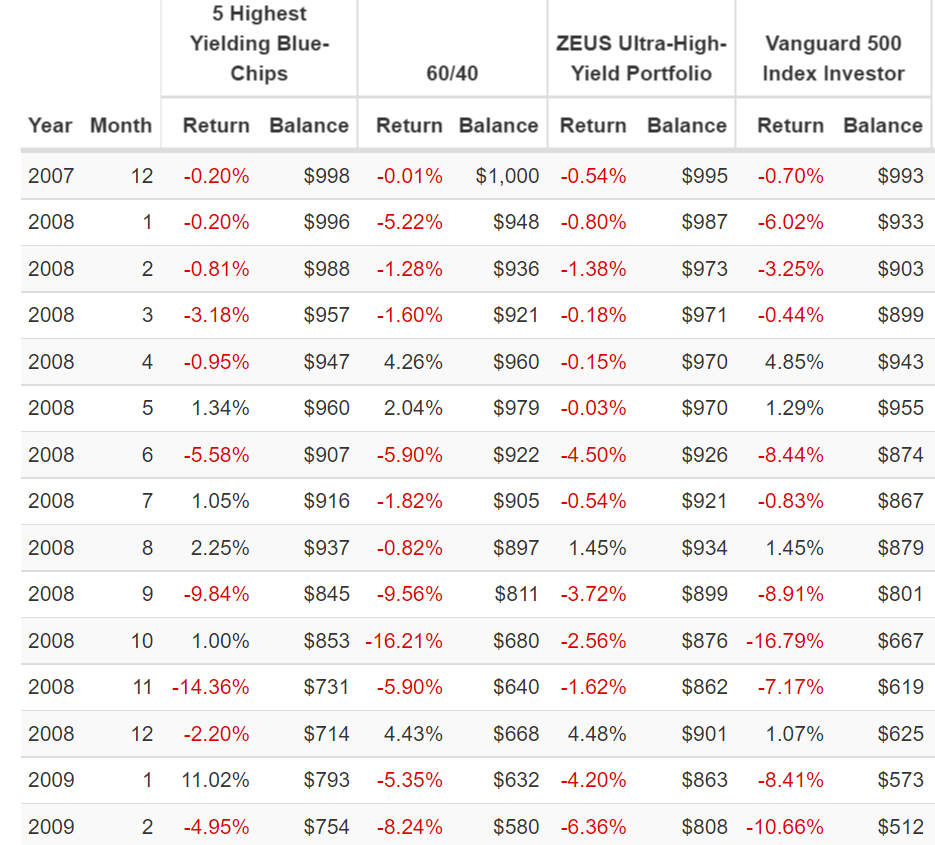
When the S&P fell 17% in October 2008, the 60/40 fell 16%, but ZEUS Ultra-Yield fell just 2.6%.
When the market fell 9% in September 2008, and the 60/40 fell 10%, ZEUS fell just 4%.
ZEUS passed the ultimate market stress test with flying colors.
ZEUS Ultra-Yield During The 2011 Bear Market
(Source: Portfolio Visualizer Premium)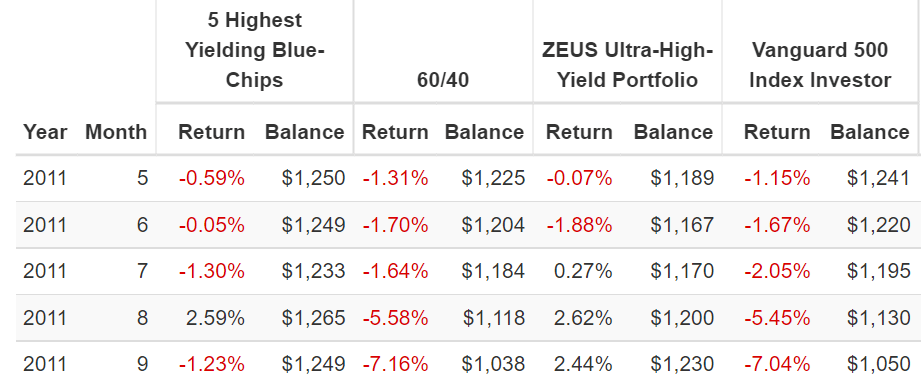
During the 2011 bear market, the S&P fell 22%, and ZEUS went up 3.3%.
- Like riding over market potholes in a hovercraft
When the market fell 7% in September 2011, and so did the 60/40, ZEUS went up 2.4%.
ZEUS Ultra-Yield During The 2018 Bear Market
(Source: Portfolio Visualizer Premium)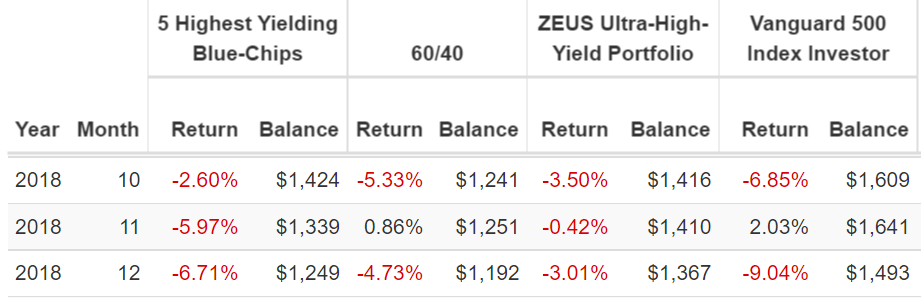
During the 2018 bear market, the S&P hit -21% intraday on December 24th. ZEUS fell just 9%.
That includes falling 3% in December when the market fell 9%.
ZEUS Ultra-Yield During The Pandemic Crash
(Source: Portfolio Visualizer Premium)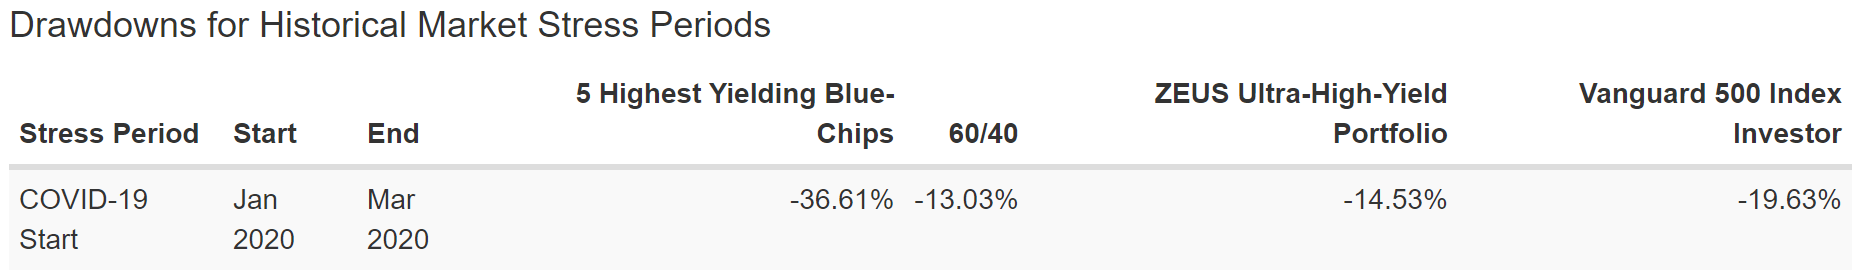
During the Pandemic, oil hit -$38, and energy was crushed. Yet ZEUS fell less than 15%.
ZEUS Ultra-Yield During The 2022 Bear Market
(Source: Portfolio Visualizer Premium)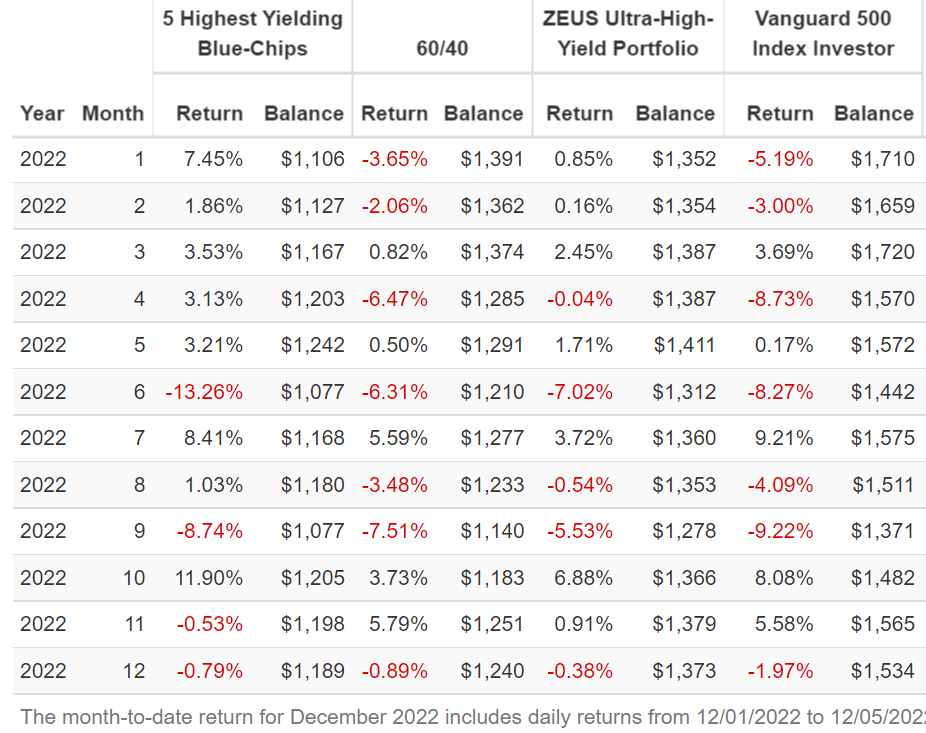
The worst bond bear market in US history crushed 17% of this portfolio in 2022 but still fell just 9% at its peak.
- Nasdaq -35%
- S&P -28%
- 60/40 -21%
- ZEUS Ultra-Yield -9%
OK, so that’s amazing but what about the future?
Stress Testing The Future With 10,000 Monte Carlo Simulations
Every registered investment advisor, including Ritholtz Wealth Management, uses some version of Monte Carlo simulations when doing retirement planning.” – Ben Carlson
Monte Carlo Simulations are how economists also forecast their base-case economic and market forecasts.
- long-term Monte Carlo simulation use statistics and past historical returns, and volatility data to run thousands of simulations about what’s likely to happen in the future
- as long as the future isn’t more extreme than the last 15 years, this is the best way to estimate the probability of likely return ranges, volatility, and the probability of achieving your investment goals.
The last 15 years have seen:
- the 2 worst Recessions since the Great Depression
- the 2nd worst market crash in history
- the fastest bear market in history
- the strongest 12-month rally-month history (70%)
- inflation ranging from -3% to 9%
- 10-year treasury bond yields ranging from 0.5% to 6%
- Fed funds rate from 0% to 4.25%
Unless you think the future will be more extreme than this, a 10,000 75-year Monte Carlo simulation is statistically the best way to forecast the likely future.
- A 75-year time horizon provides more extreme ranges of potential outcomes
- The ultimate stress test for a “forever portfolio.”
(Source: Portfolio Visualizer Premium)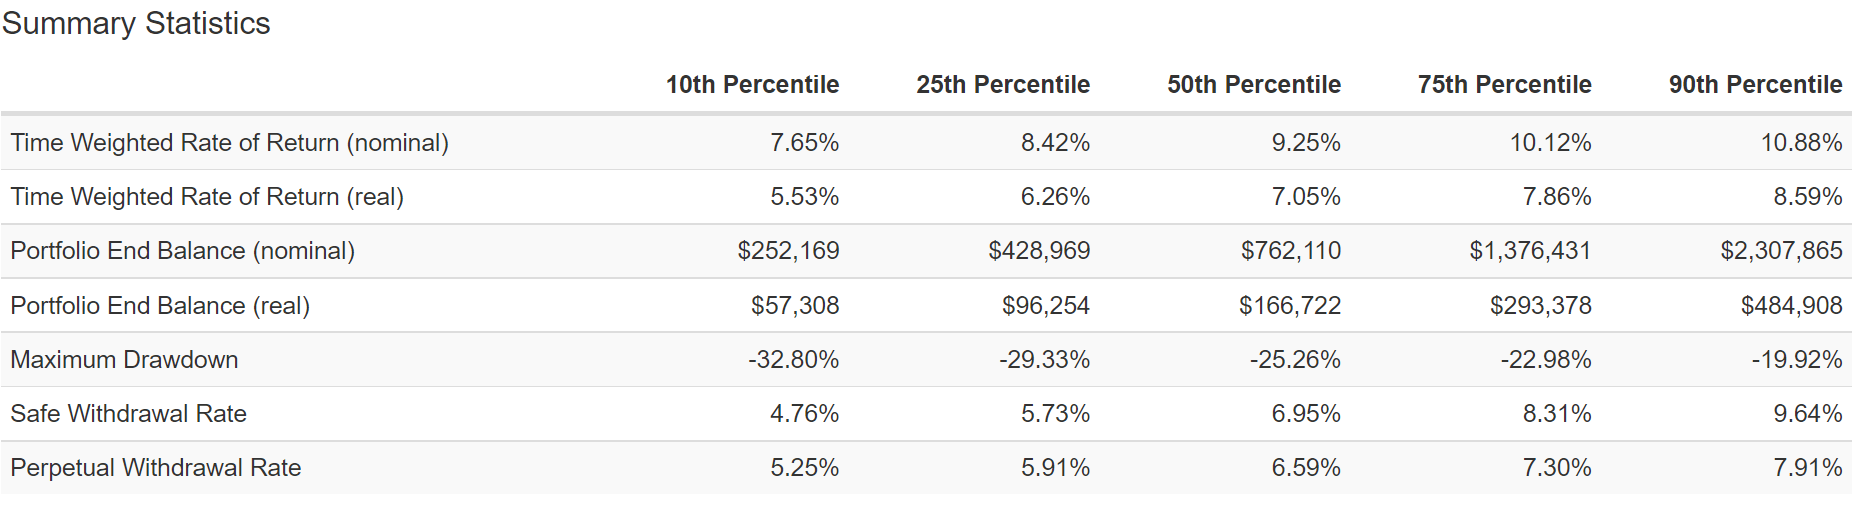
ZEUS Ultra-Yield has a 90% statistical chance of:
- earning 7.7% to 10.9% annual returns (10.0% consensus) vs. 7.2% 60/40
- earning 5.5% to 8.6% inflation-adjusted returns (7.7% consensus) vs. 4.7% 60/40
- a 4.8% to 9.6% safe withdrawal rate (4.7% consensus)
(Source: Portfolio Visualizer Premium)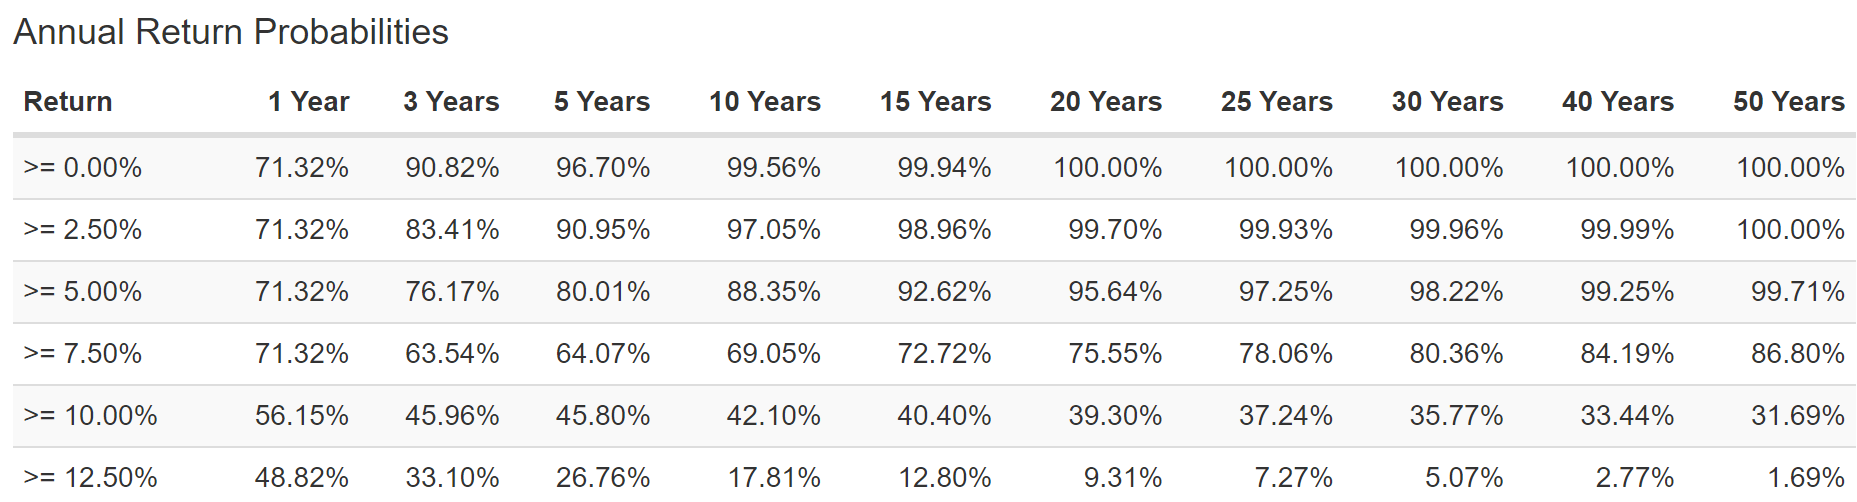
An 86.8% probability of beating the 60/40 over the next 50 years. And with 3X the safe yield.
(Source: Portfolio Visualizer Premium)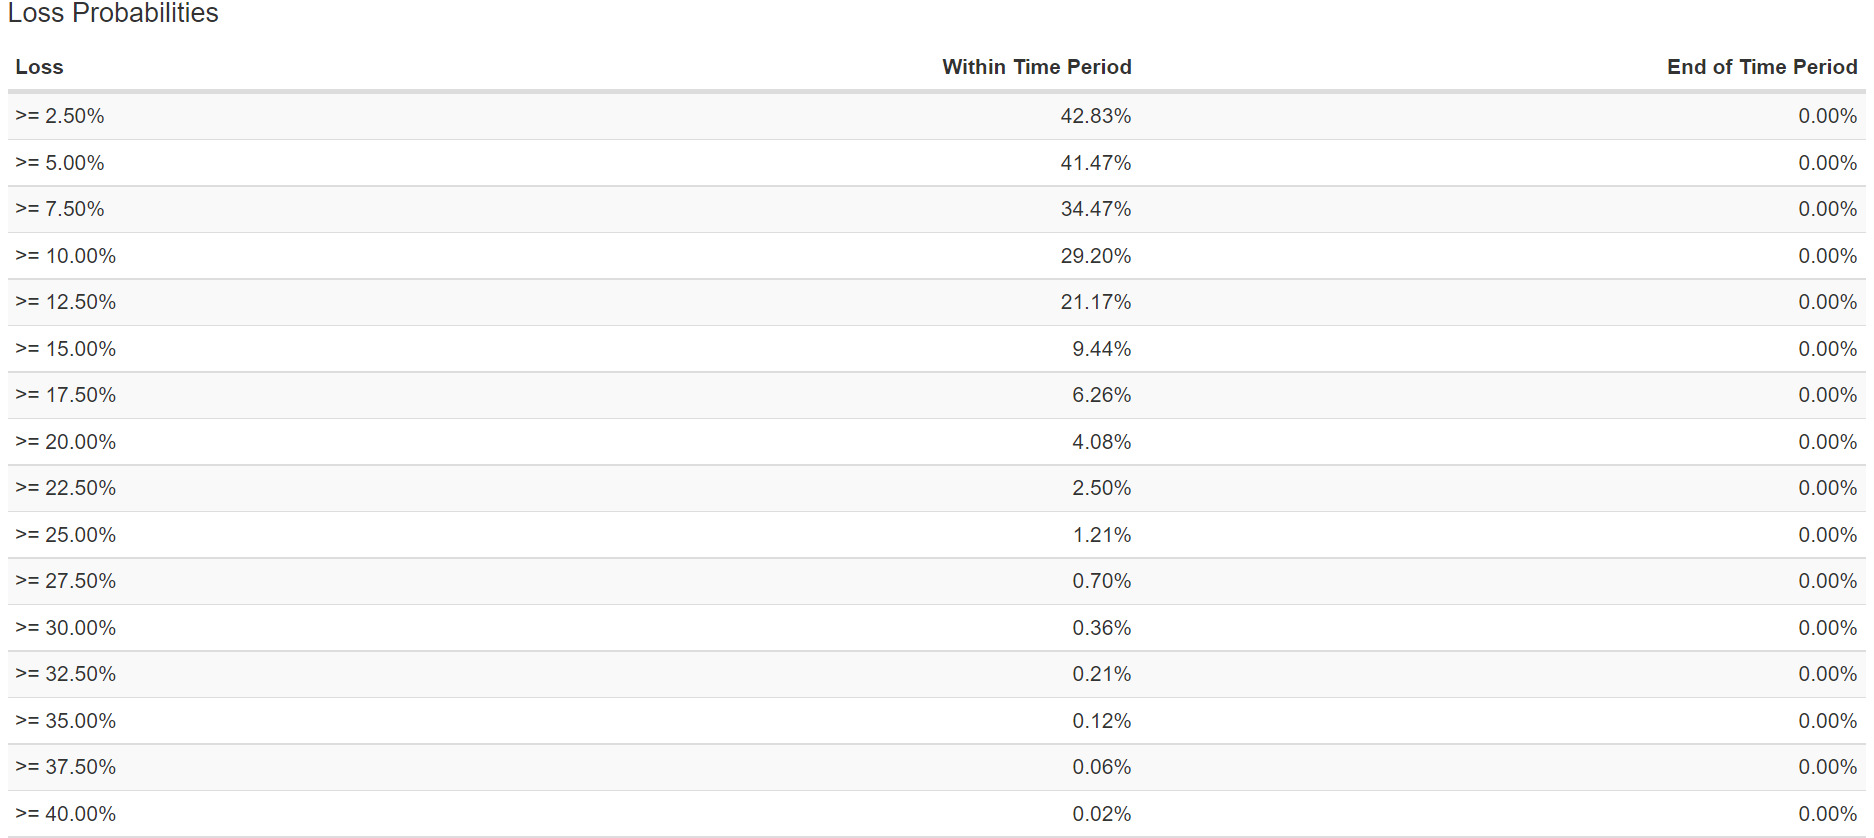
The probability of a 20+% bear market is just 4.1%, or 1 in 25, meaning you should expect a bear market about once every 1,875 years.
- ZEUS Ultra-Yield didn’t even suffer a bear market in the Great Recession
The probability of suffering a 40+% bear market, as the 60/40 did during the Great Recession?
- .02% or 1 in 50,000
- expect a 40+% bear market about once every 3.75 million years
For context, the S&P 500 historically suffers a 20+% bear market every 4 years.
- in any given year, ZEUS Ultra-Yield is 469X less likely than the S&P 500 to suffer a bear market
Bottom Line: These 8 High-Yield Blue-Chips Could Potentially Triple Your Retirement Income
If you want to possibly triple your retirement income safely, there is no better way than through ultra-yield Super SWANs like MPLX, MMP, EPD, MO, and LGGNY.
- 8.1% very safe yield
- 22-year average dividend growth streak
- BBB+ stable credit rating
- 4.7% long-term growth
- 12.8% long-term return potential (similar to the last 21 years)
And then, by combining these with SCHD, DBMF, and EDV, you can create a ZEUS Ultra-Yield portfolio that generates truly astonishing fundamentals.
- 5.9% safe yield = 3X the 60/40
- 10.0% long-term return potential (exactly as it’s done for 15 years)
- 2.2 more inflation-adjusted wealth than a 60/40 over the next 30 years
- 87% likely to beat a 60/40 over the next 50 years.
- single-digit annual volatility (40% less than the S&P 500)
- a peak decline of just 19% during the Great Recession
- 9% peak decline in 2022 bear market
- went up 3% during the 2011 bear market
- 4% chance of a bear market in the next 75 years
- 469X less likely than the S&P 50 to suffer a bear market in any given year
This is how you sleep well at night in all market, economic conditions, and inflationary environments.
This is how you don’t just retire on schedule but retire in safety and splendor.
This is how you make your own luck on Wall Street
Be the first to comment