Looking for something big? You came to the right place.
Henrik Sorensen/DigitalVision via Getty Images
Get ready for charts, images, and tables because they are better than words. The ratings and outlooks we highlight here come after Scott Kennedy’s weekly updates in the REIT Forum. Your continued feedback is greatly appreciated, so please leave a comment with suggestions.
As we look at the high yield stocks today, I want to share one of our recent purchases. Most of the section comes from a recent trade alert. However, the “Portfolio Update” link hits a paywall for non-members, so I’ll share some of the sections from that article also.
Trades Placed
Added $7,000 of cash to our portfolio. This is adjusted for in the returns section of our spreadsheet.
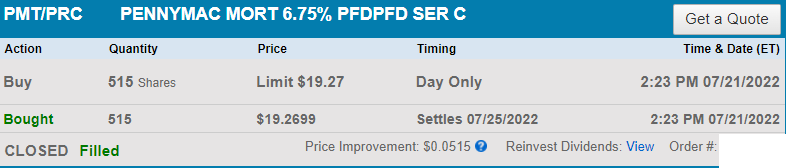
We’ve been highlighting PMT-C for a while. In the Portfolio Update I wrote:
PMT-C is now at the top of my list for preferred shares where I would like to start a position.
There was also the statement in a section on PMT-C:
Currently this is one of my favorite picks for tax-advantaged accounts.
The Portfolio Update included quite a bit of discussion about PMT-C, so I didn’t repeat it in the original trade alert. However, I will include some of it here because I want readers to have access to it.
Section From the Portfolio Update
This section is from the Portfolio Update, so it pertains to prices as of 6/30/2022:
While the preferred shares from PMT fell harder, the preferred shares from NRZ were also down worse than the sector average. Yet we saw the preferred shares from CHMI and TWO beat the sector by a significant margin. What’s going on? Correlation with the common shares shot through the roof. PMT and NRZ got crushed in June while CHMI and TWO outperformed. The relative strength in the common shares spilled over onto the preferred shares. Why is that so important? Because there is a huge gap in the attractiveness of the common shares. NRZ and PMT are vastly more attractive than CHMI and TWO. So why is the market getting this so backwards? I believe ideas that can be summed up in 3 or 4 words have vastly more ability to sway market opinion. Here the story is “Origination is bad”. Interest rates went up, so origination will underperform. NRZ and PMT have origination businesses, so they underperform. So, what makes the market’s idea so stupid?
At current valuations, the owners of PMT and NRZ get the better management team and get the origination business for free. The shareholders get the benefit that it could still be useful again in the future. Is “free” too much to pay? I don’t think so. But the issue goes a bit deeper. When NRZ and PMT are this much cheaper, especially NRZ with their price-to-projected-book ratio around the mid .70s, investors are getting that part of the REIT for less than nothing.
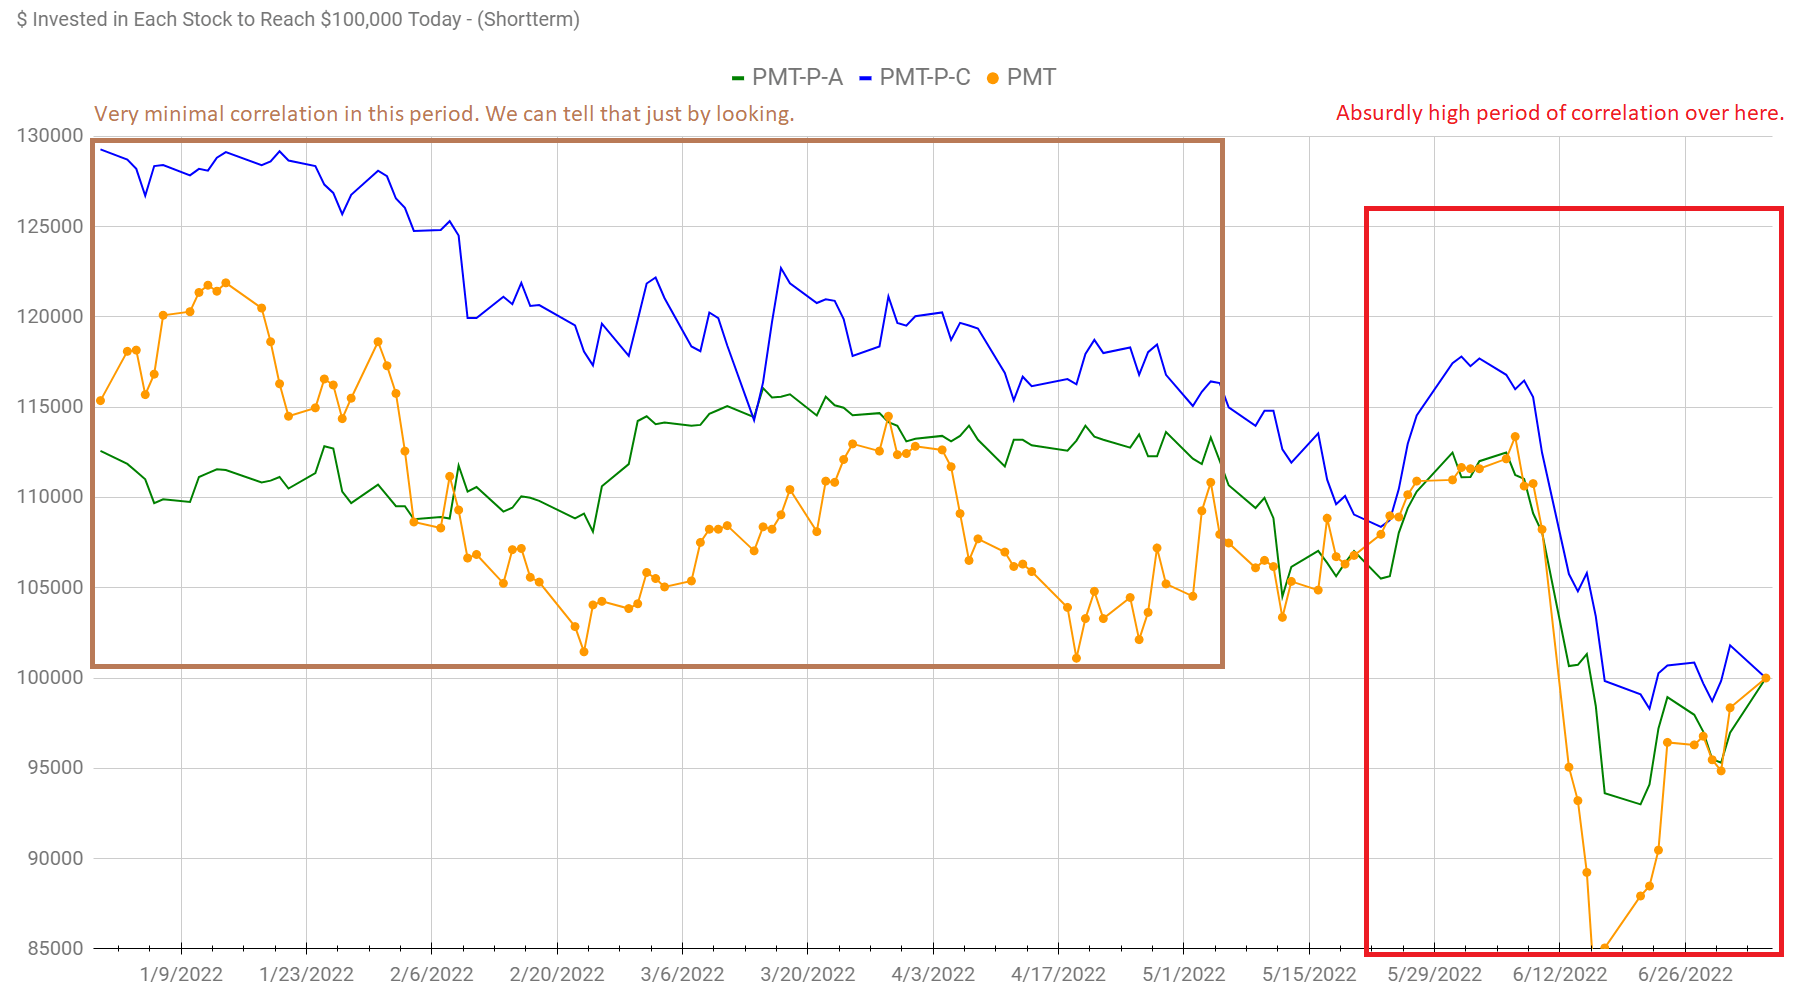
I believe the absurd price action from the common shares is spilling over into the preferred shares. Allow me to demonstrate with the $100k chart for PMT-A, PMT-C, and PMT:
The REIT Forum
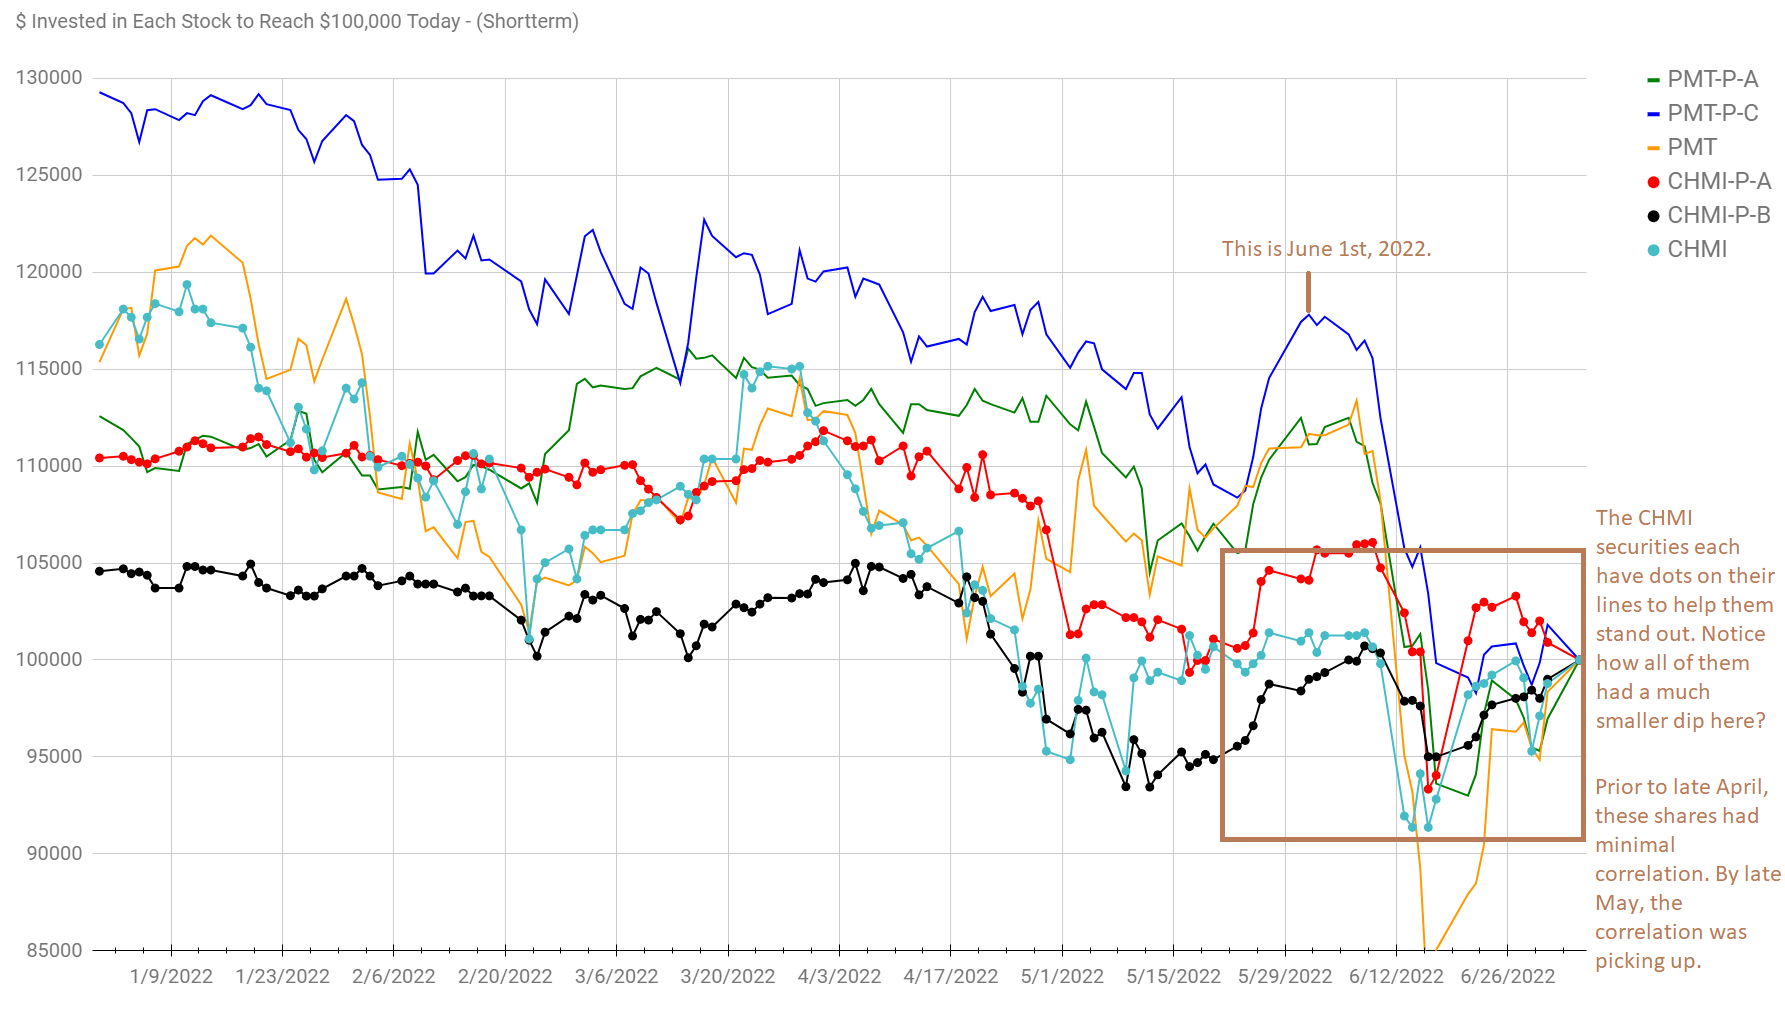
Just looking at that chart, you can feel the difference. Now I’m going to expand the chart to include CHMI, CHMI-A, and CHMI-B. I’ll put dots on the lines for each of those shares to make it easy to tell them apart:
The REIT Forum
Note: You’re going to need to zoom in on that one to get a decent resolution. That is just a consequence of writing on charts.
The change in correlation is absurd, but it is obviously there. The market did not simply change its preference for common shares, it extended that over to the preferred shares. I can’t say that the chart will turn out the same every single REIT, but it’s been a staggering connection here. In my opinion, the market is clearly getting this wrong. PMT-C is now at the top of my list for preferred shares where I would like to start a position. I specifically highlighted June 1st on the chart, and I want to show you why.
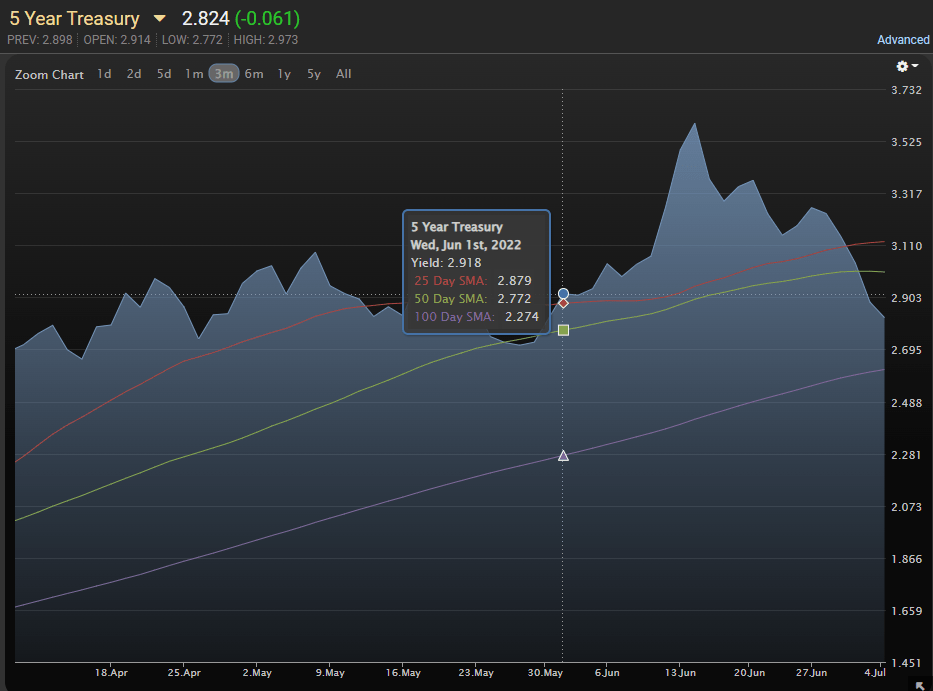
This chart shows the 5-year Treasury yield, along with the moving averages:
MBSLive
You may notice that on June 1st, 2022, the 5-year Treasury yield was 2.918%. That’s higher than the value of 2.824% on July 5th, 2022, and it’s higher than the 2.884% yield for July 1st, 2022. We were expecting to lower targets on fixed-rate shares slightly to reflect higher Treasury rates since they had increased so much, but the increase melted away. As of July 5th, Treasury yields are actually lower than they were on June 1st, 2022. Treasury yields are down. Not much, but a little bit. PMT-C’s price is down about 15%. How does that reconcile with lower interest rates? Investors can argue about credit spreads until they are blue in the face, but the preferred shares with the smallest dips (excluding the baby bonds) carried some of the highest risk ratings. Arguing that PMT-C deserves to fall 15% while Treasury yields decline and higher-risk shares fall less (than 15%) is simply an absurd premise.
Note Treasury yields increased on July 6th and July 7th, bringing yields across the curve to slightly over 3.0% again.
That section was published on July 7th, so logically the charts had to stop by that point. The Portfolio Update takes a few days to prepare since it is so large.
Now we return to the original trade alert.
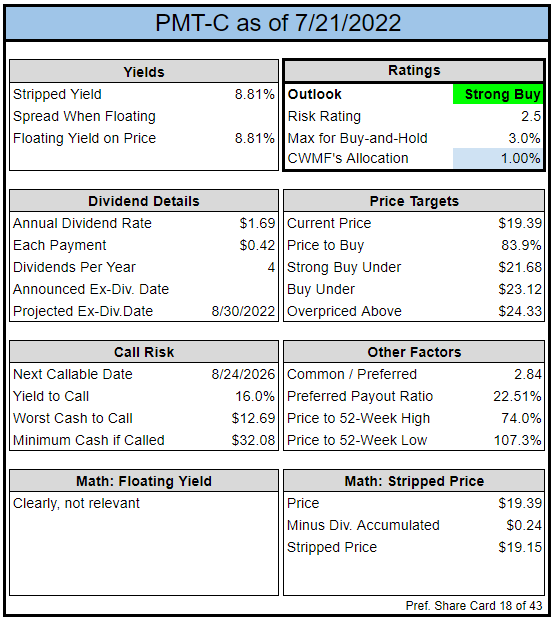
Index Cards
The REIT Forum
Account
This trade is in a tax-advantaged account (solo 401k). Any tax-advantaged account would be appropriate for positions I want to be able to trade actively or positions where I’m looking to collect such a large yield.
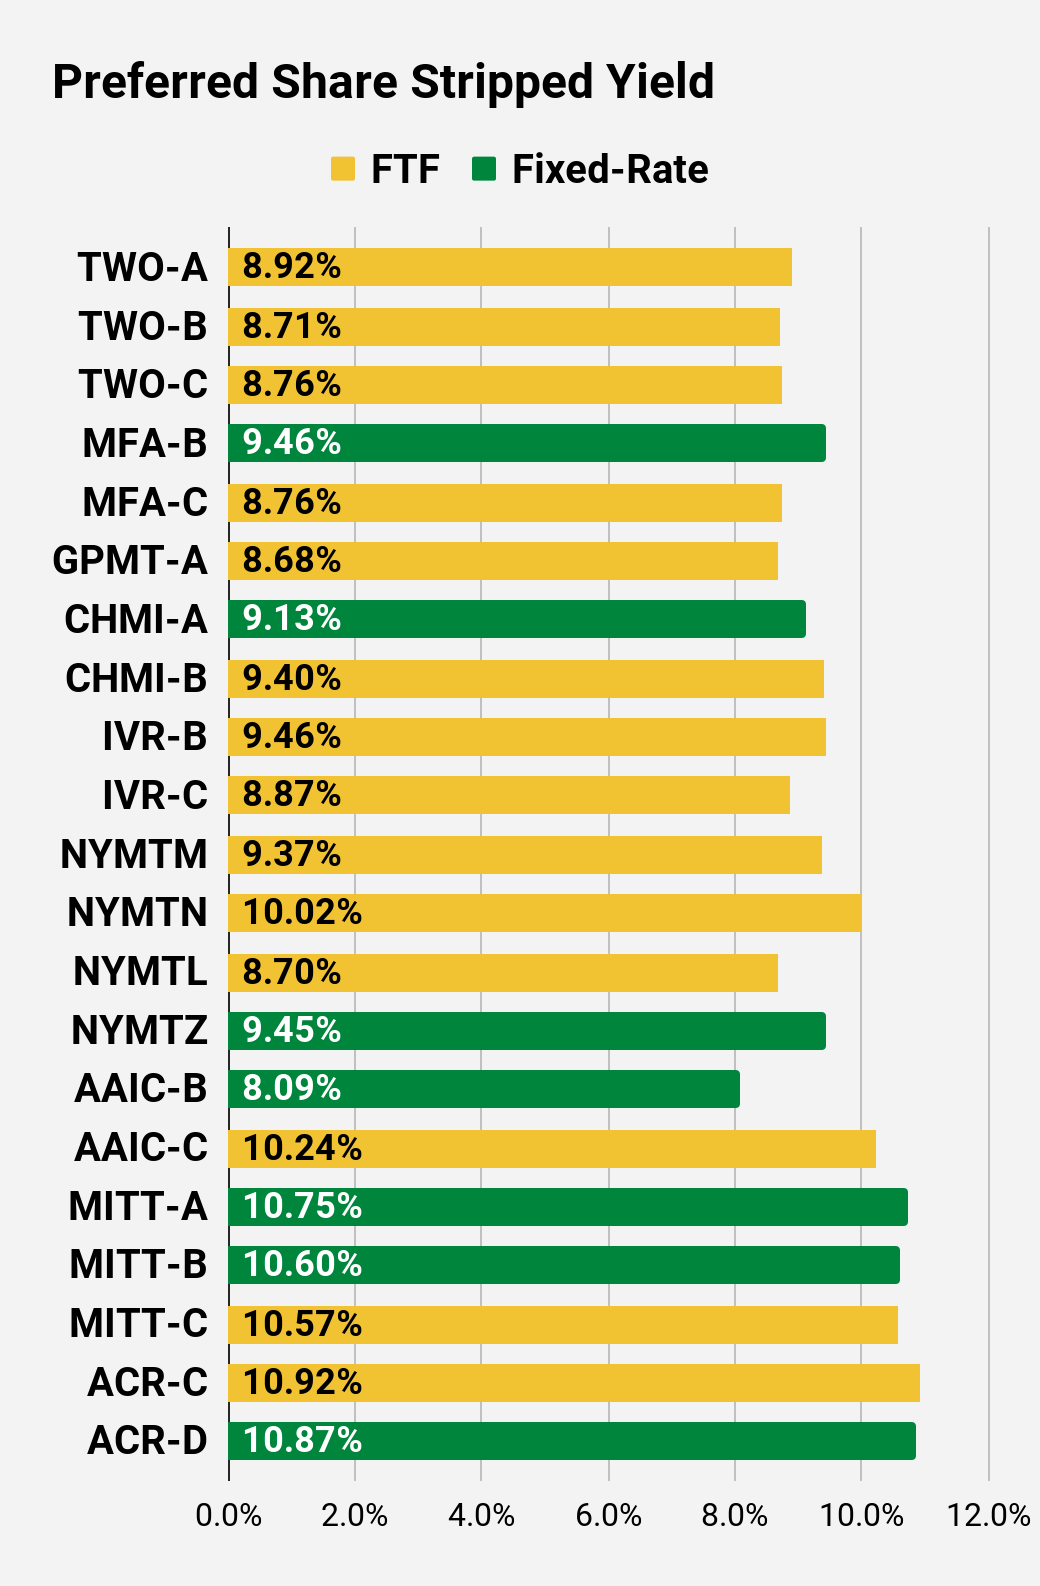
PMT-C has a fixed-rate dividend providing a healthy stripped yield of 8.87%. Without the dividend accrual, it would be 8.76%. That’s a big enough yield to feel comfortable against rising interest rates and the huge discount to call value gives us plenty of room for upside in the future.
It looks like PMT-C simply got pummeled too hard by the market. I was hoping to catch shares a bit earlier as they traded in the high $18s during the Portfolio Update, but decided it was better to pull the trigger now than wait to see what the next month would bring. We’ve recommended these for a bit and it was time to follow up on our recommendation.
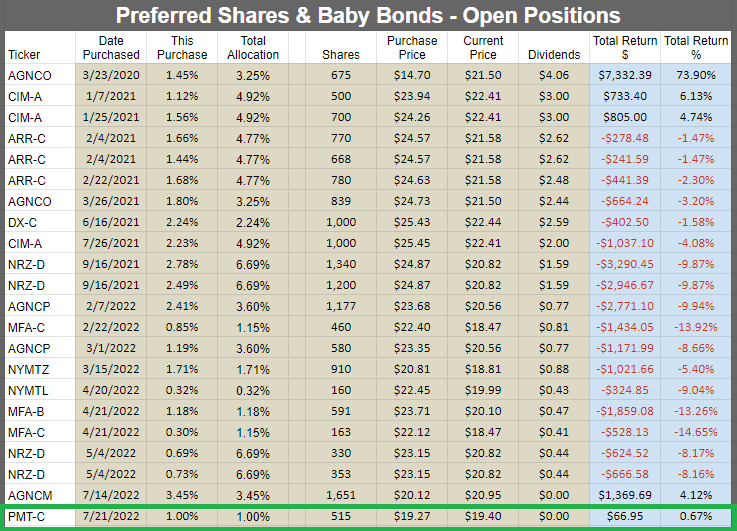
If PMT-C rallies too hard, there are some alternatives for investors. MFA-B (MFA.PB) and MFA-C (MFA.PC) are both deep in our target ranges. NRZ-D (NRZ.PD) also continues to look attractive. For lower-risk choices, AGNCO (AGNCO) and AGNCP (AGNCP) both look good. These 5 choices are all in our portfolio as well. We have about 1.15% to 1.2% in MFA-B and MFA-C, over 3.2% in AGNCO and AGNCP, and over 6.5% in NRZ-D.
Note: The trade alert was posted Thursday during the market day. The public release is Monday night (assuming it goes quickly). Prices will have moved some. PMT-C is still attractive, but shares did jump Thursday before the close. To ensure members are not stuck waiting for the alert, I aim to foreshadow all of our trades with statements like:
PMT-C is now at the top of my list for preferred shares where I would like to start a position.
That gives investors a chance to open any positions before I do, though I’m not compelled to buy shares if the price becomes unattractive. Personally, I really like this statement for foreshadowing:
The REIT Forum
By the time I had added some cash to the portfolio (to combine with dividends), shares were a bit over $19. However, they were still a good deal, so I went for it.
The rest of the charts in this article may be self-explanatory to some investors. However, if you’d like to know more about them, you’re encouraged to see our notes for the series.
Stock Table
We will close out the rest of the article with the tables and charts we provide for readers to help them track the sector for both common shares and preferred shares.
We’re including a quick table for the common shares that will be shown in our tables:
Let the images begin!
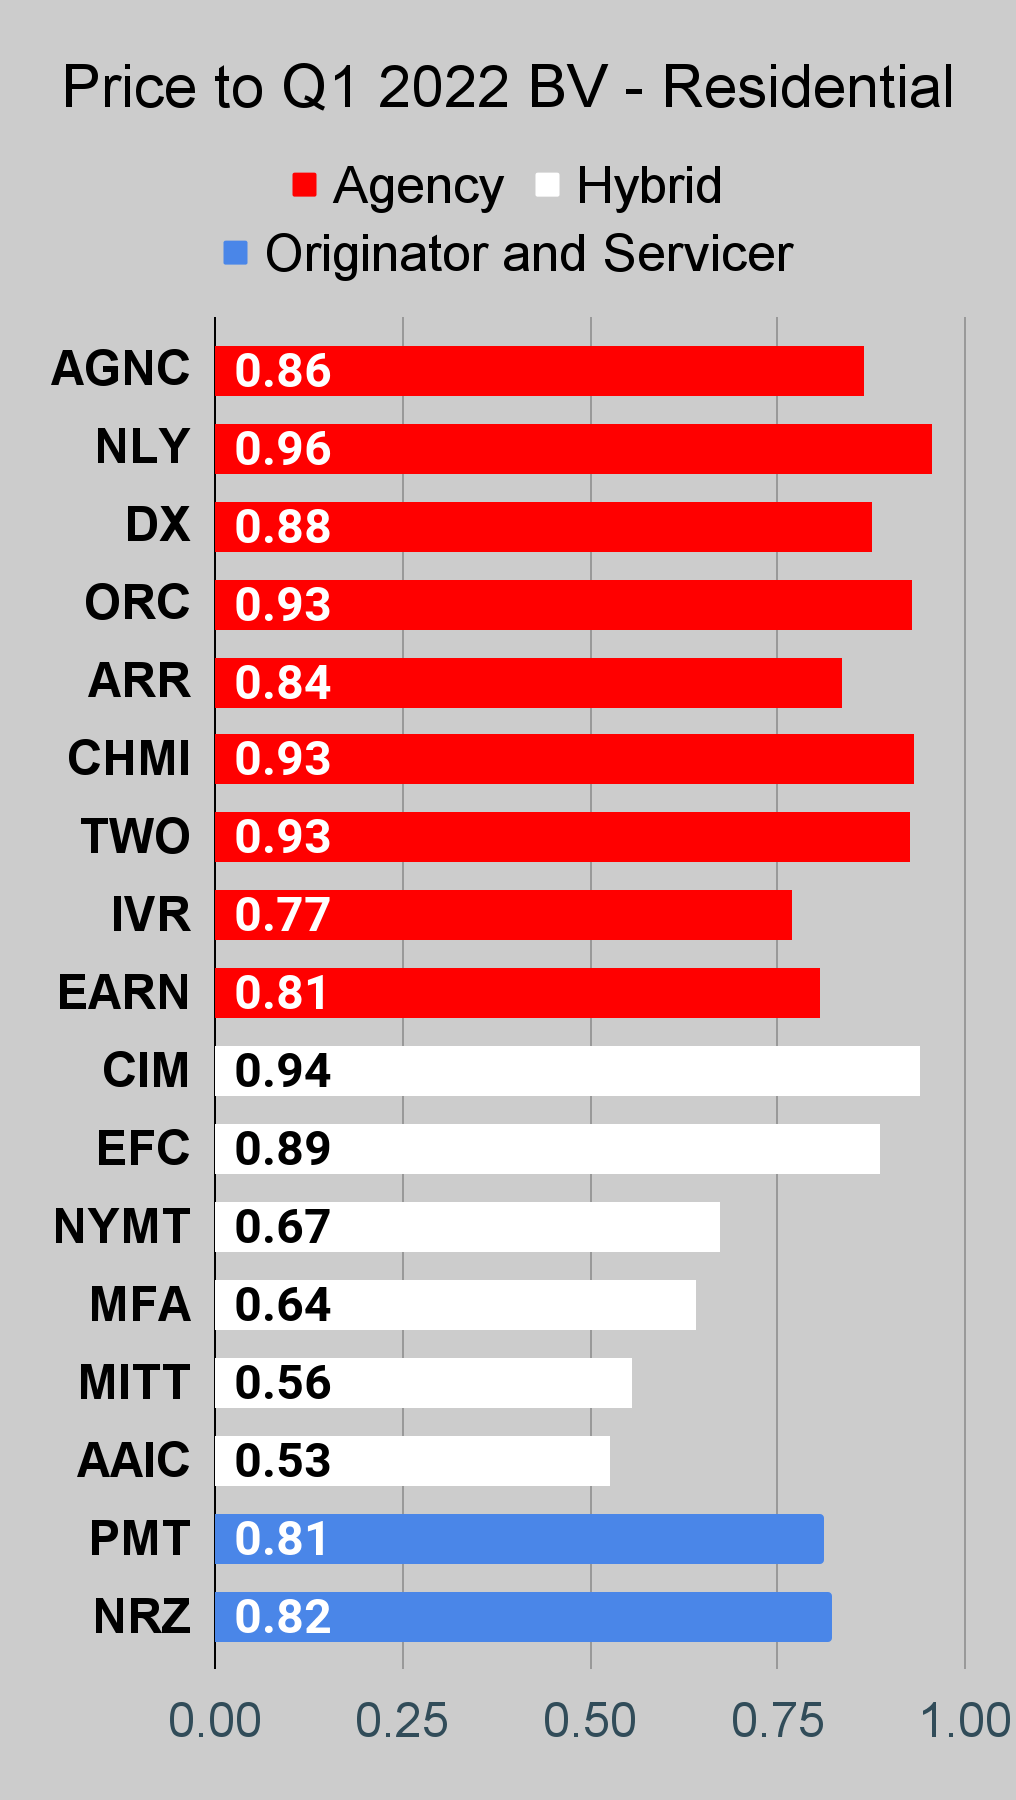
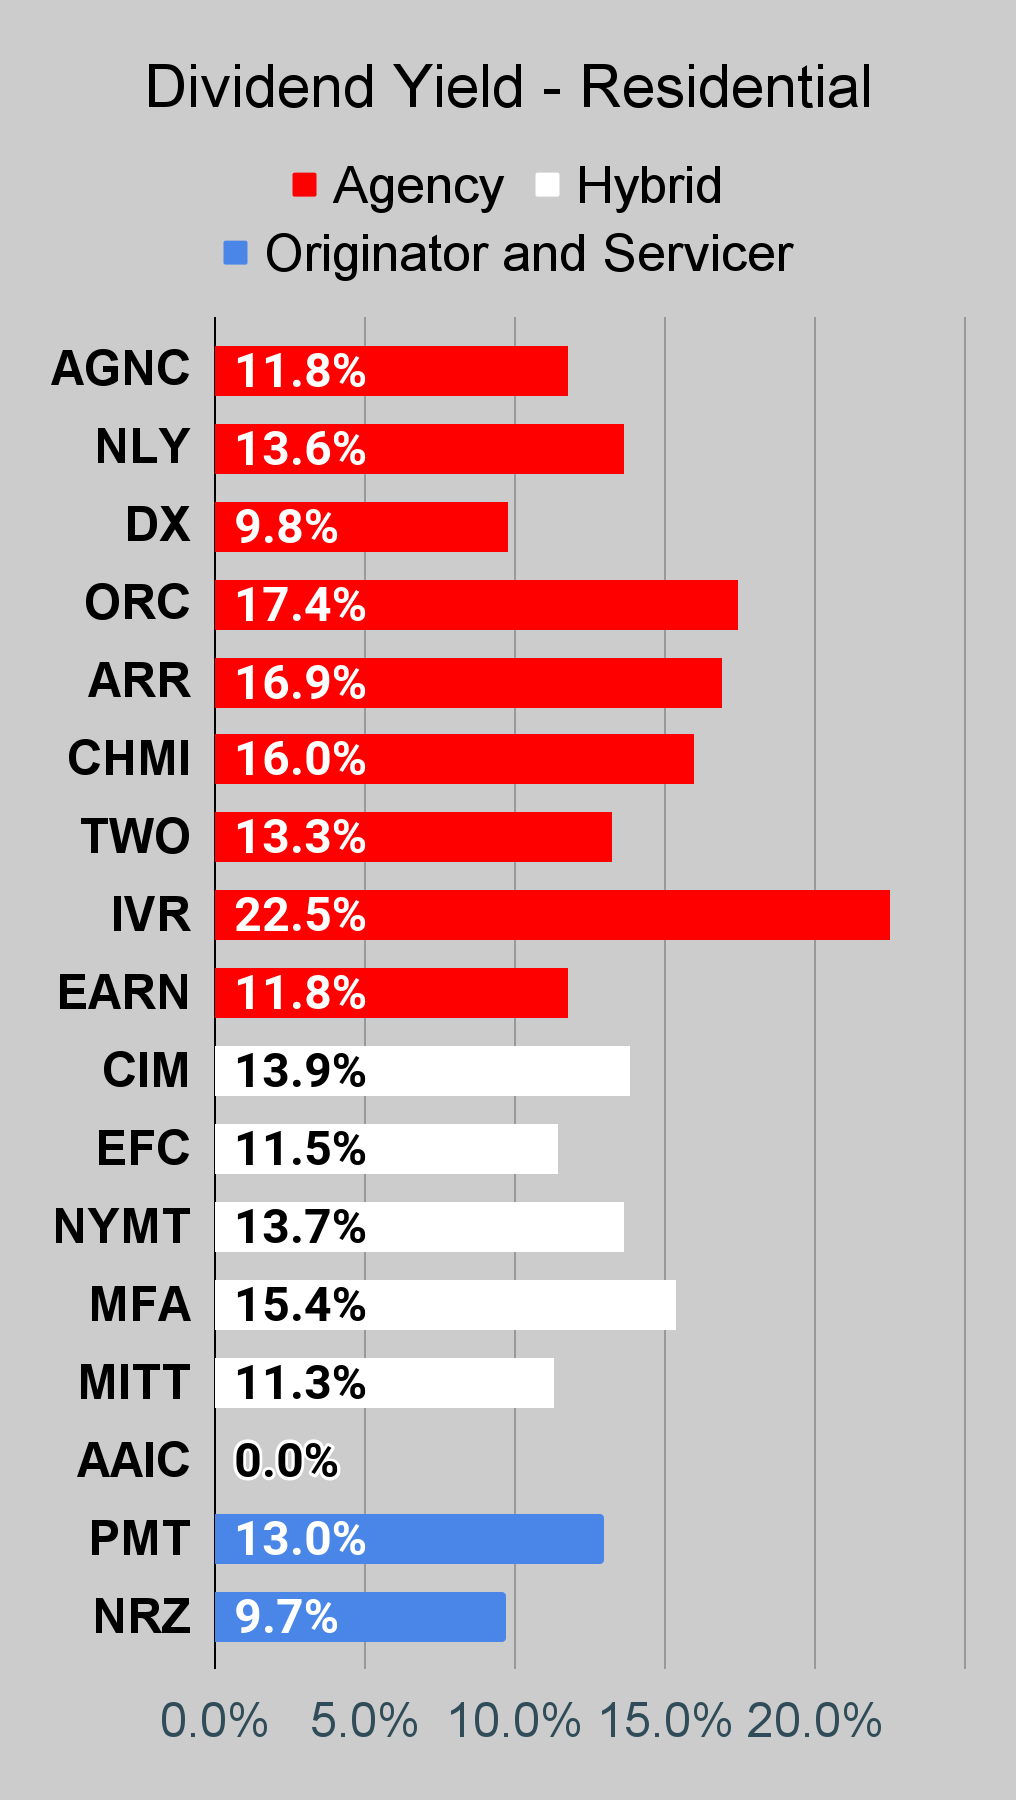
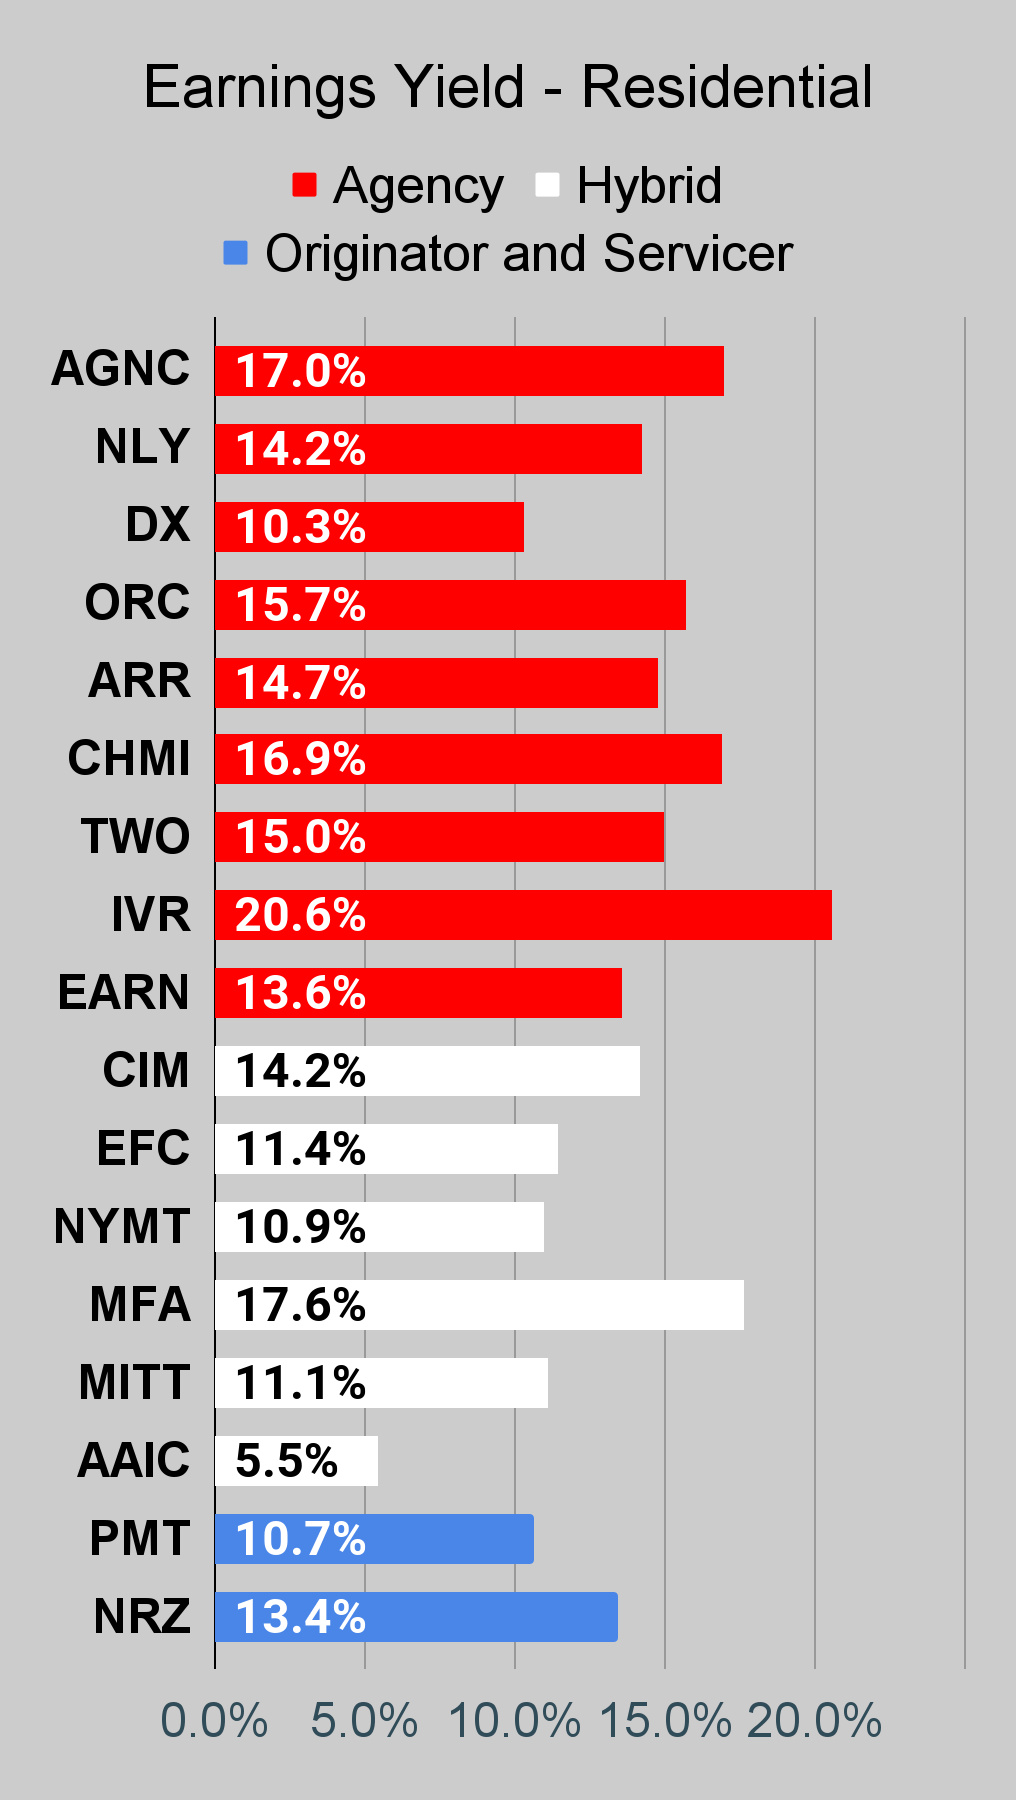
Residential Mortgage REIT Charts
Note: The chart for our public articles uses the book value per share from the latest earnings release. Current estimated book value per share is used in reaching our targets and trading decisions. It is available in our service, but those estimates are not included in the charts below.
The REIT Forum
The REIT Forum
The REIT Forum
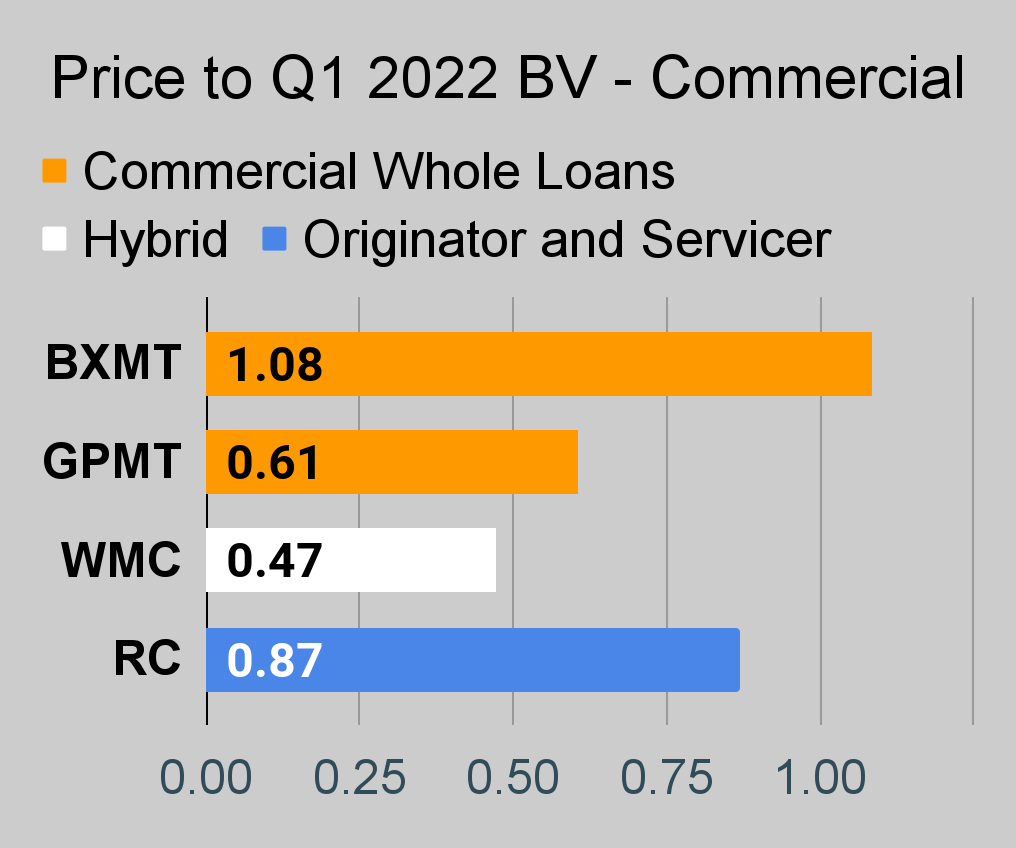
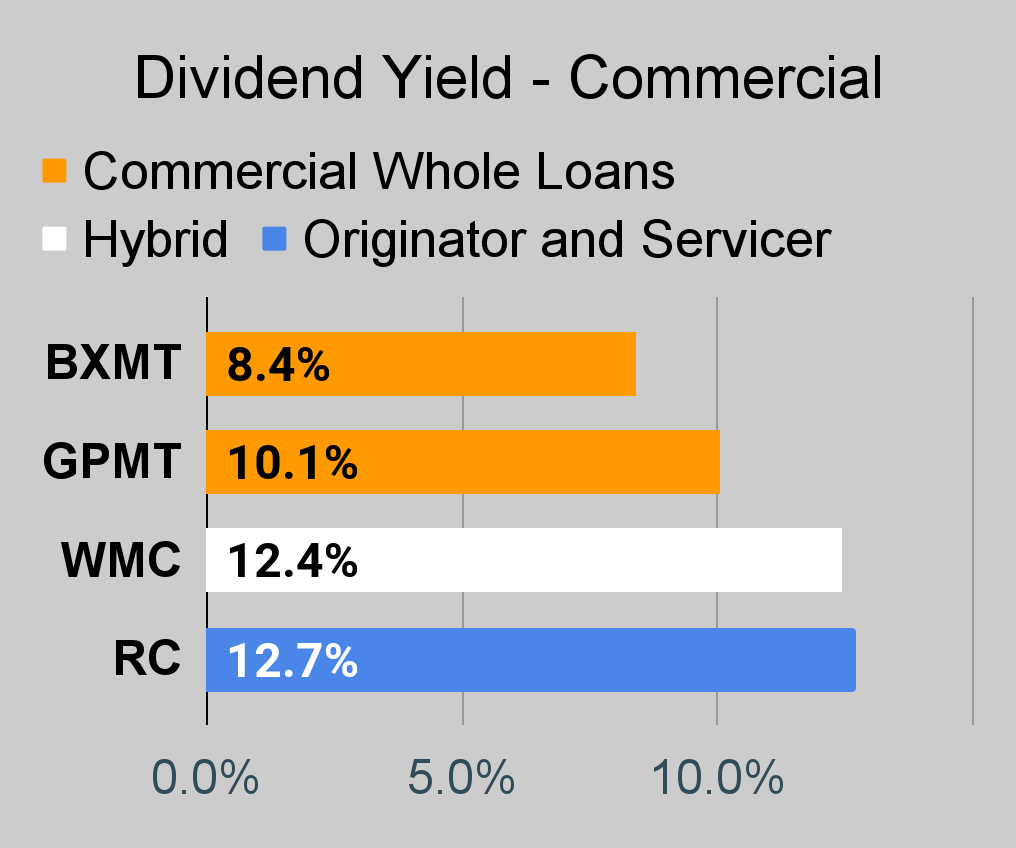
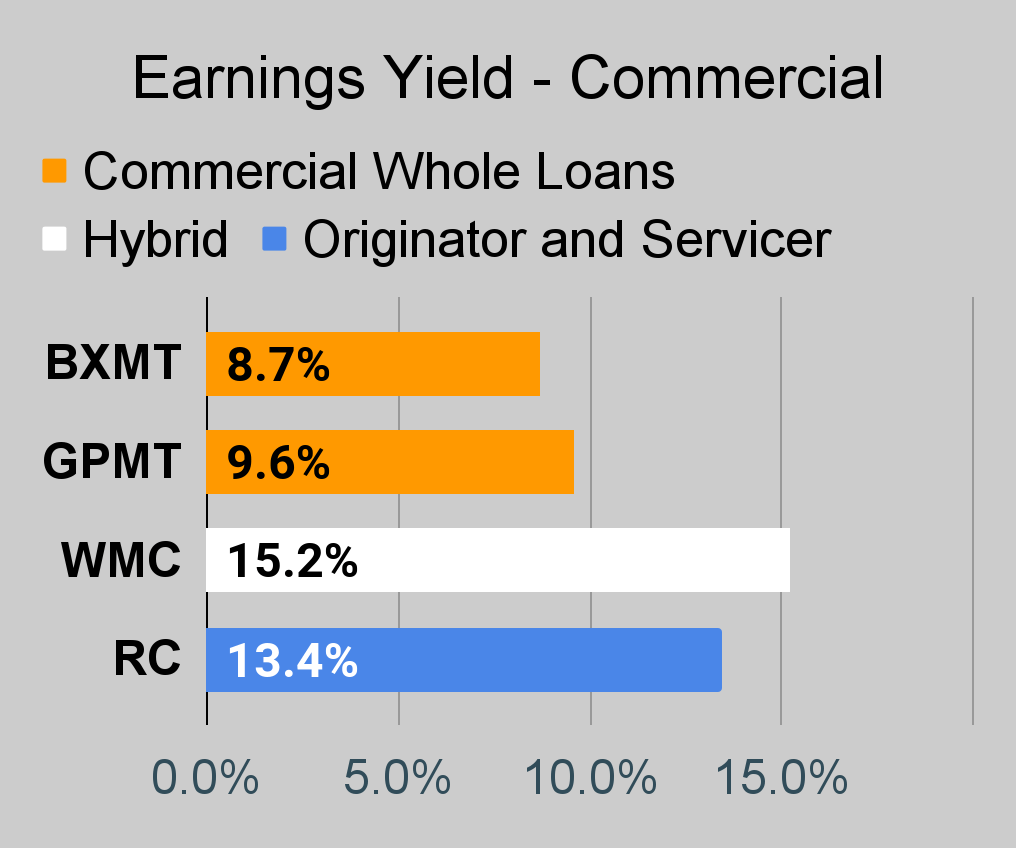
Commercial Mortgage REIT Charts
The REIT Forum
The REIT Forum
The REIT Forum
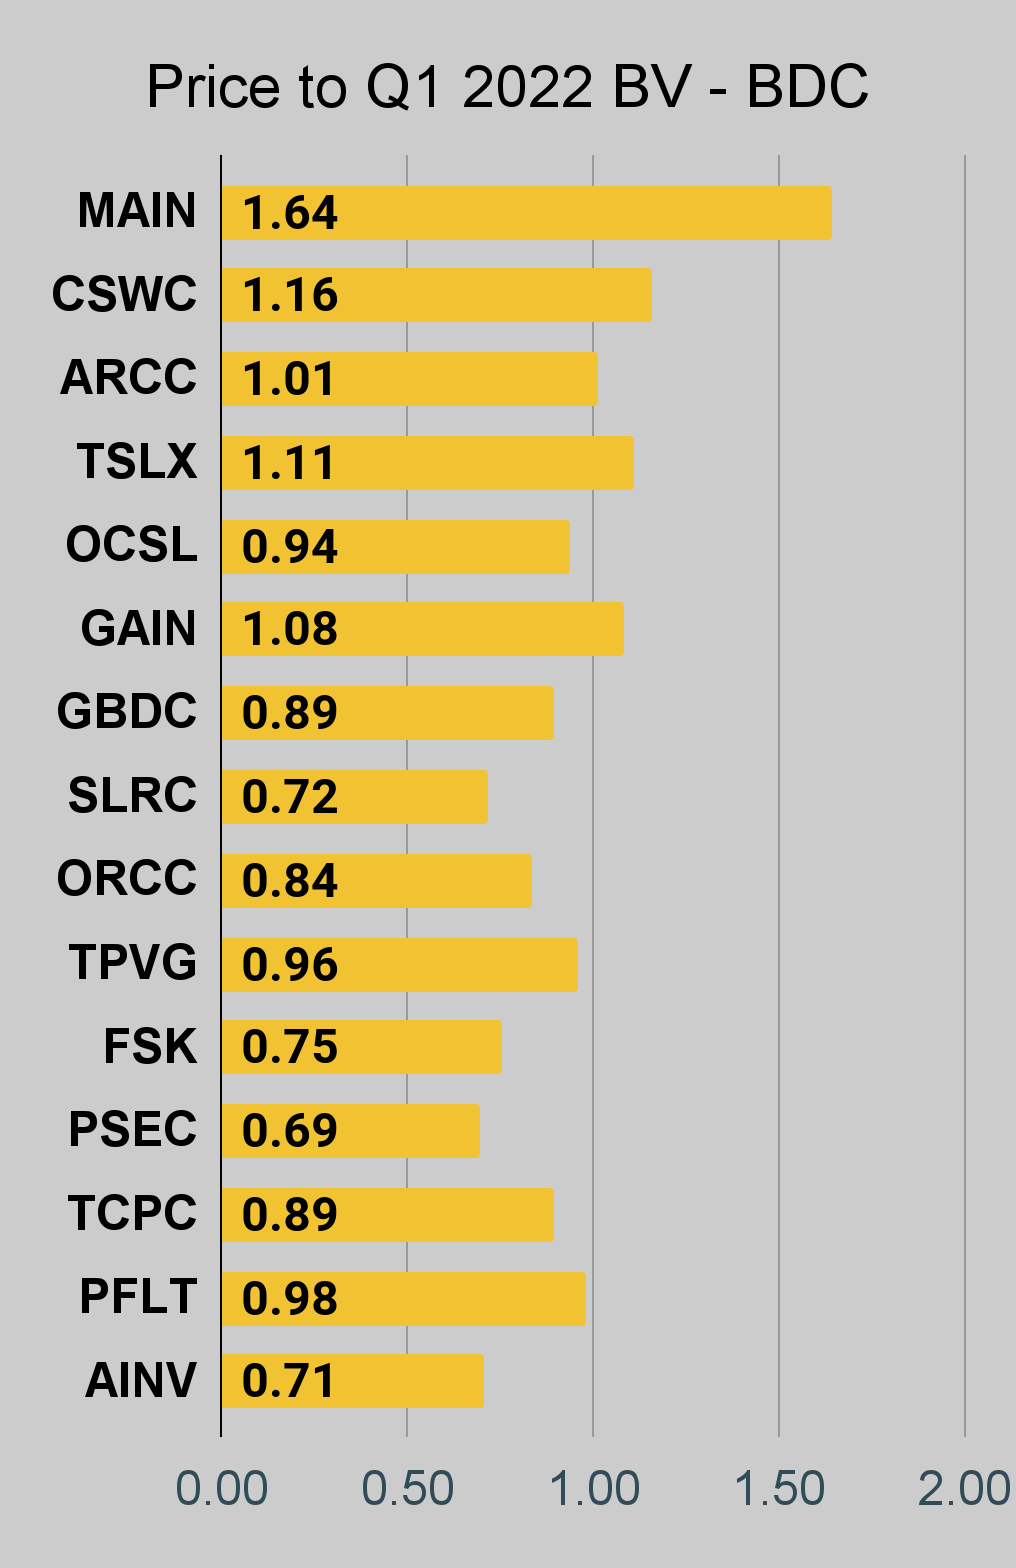
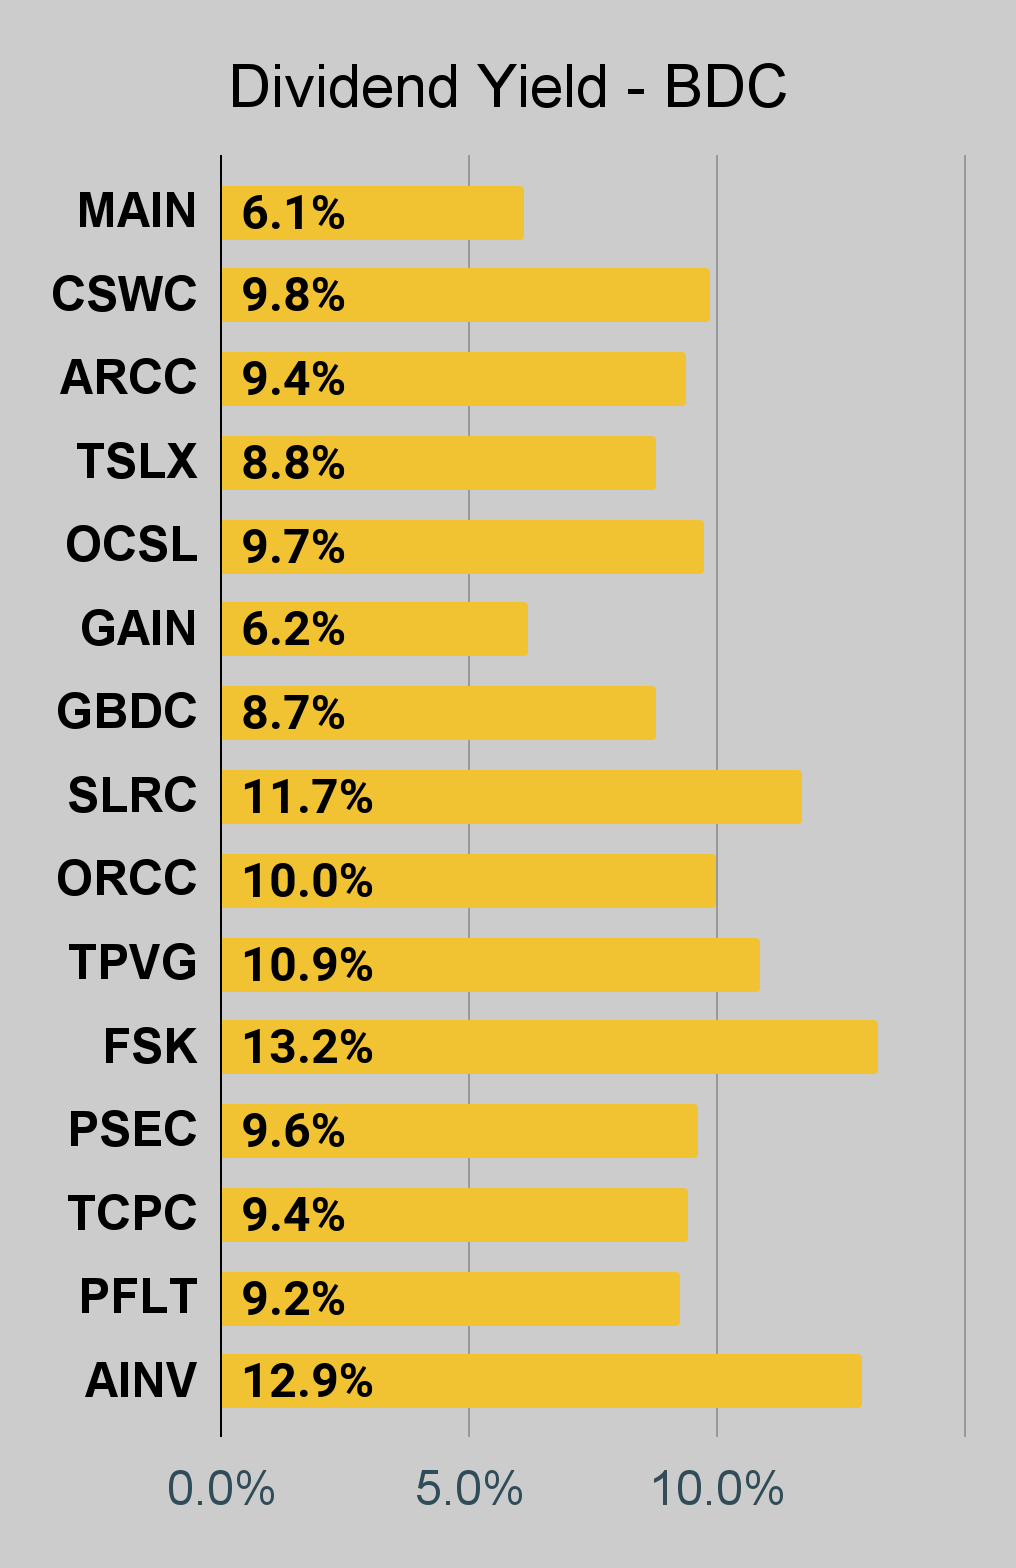
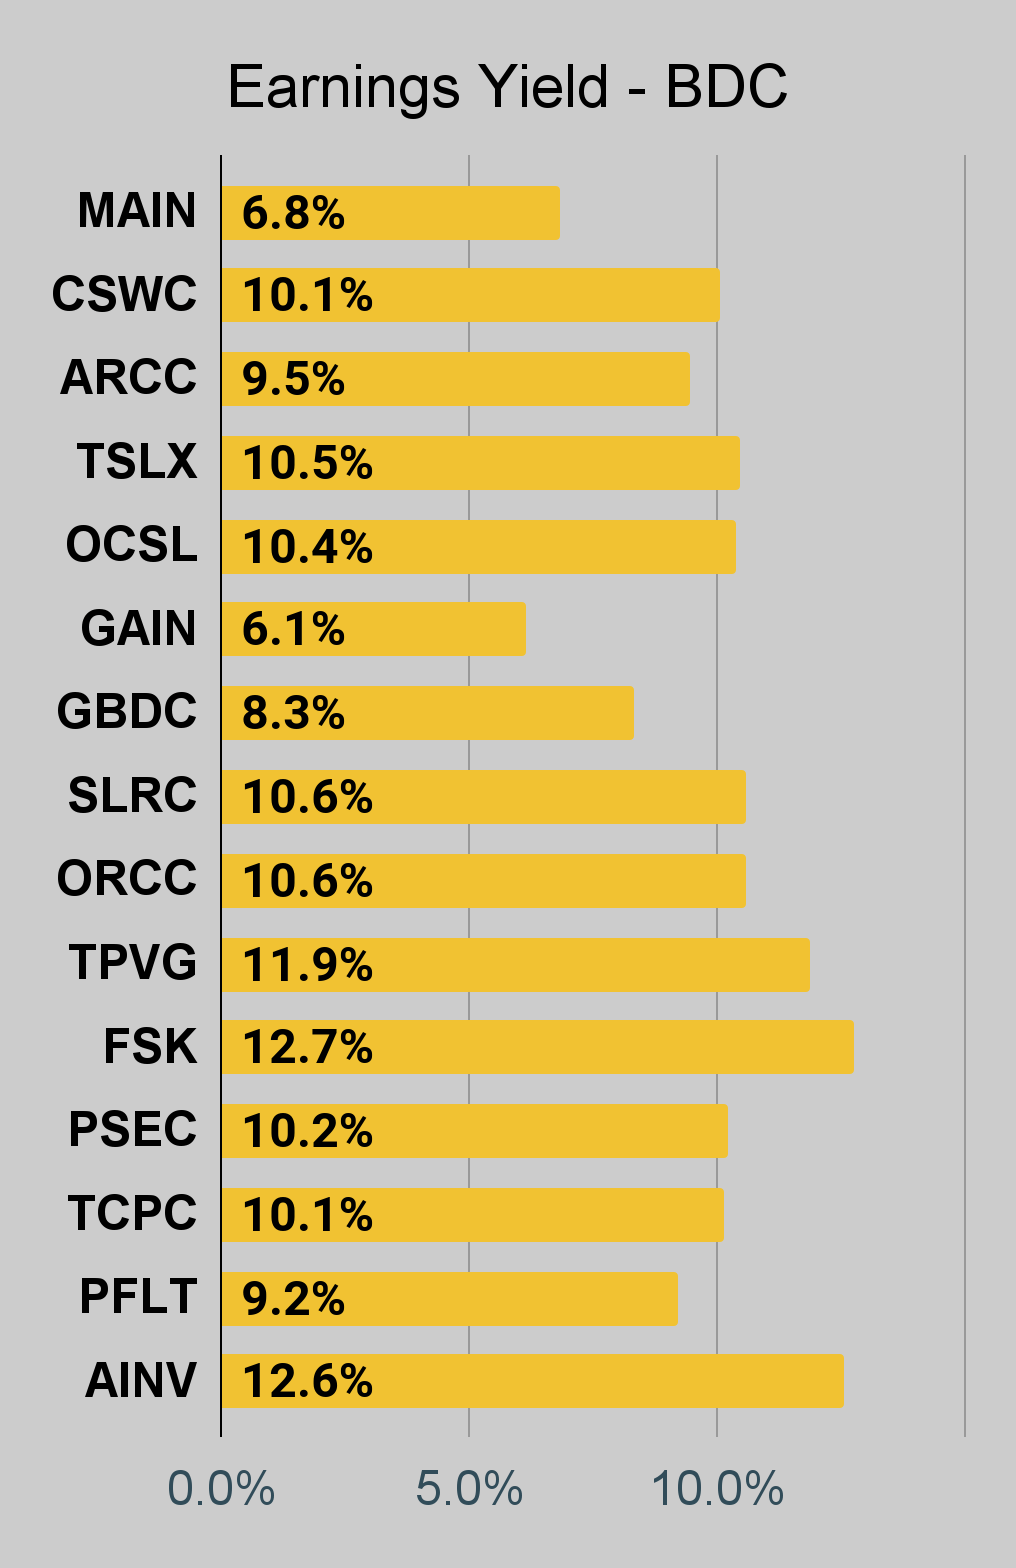
BDC Charts
The REIT Forum
The REIT Forum
The REIT Forum
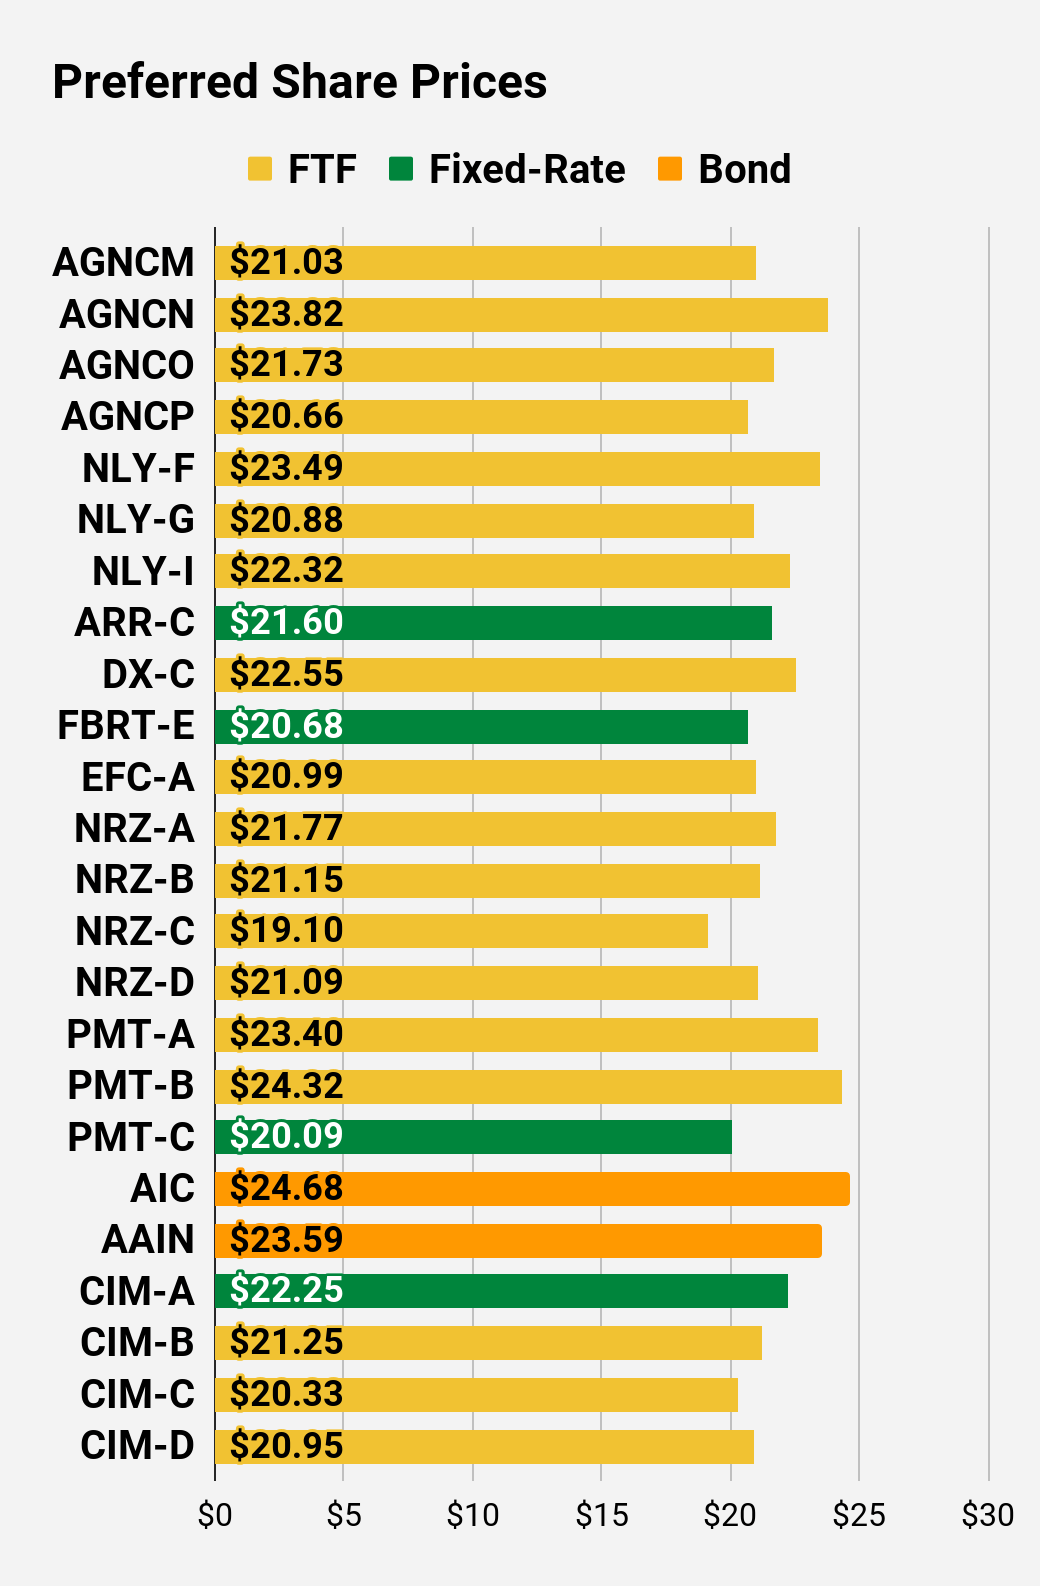
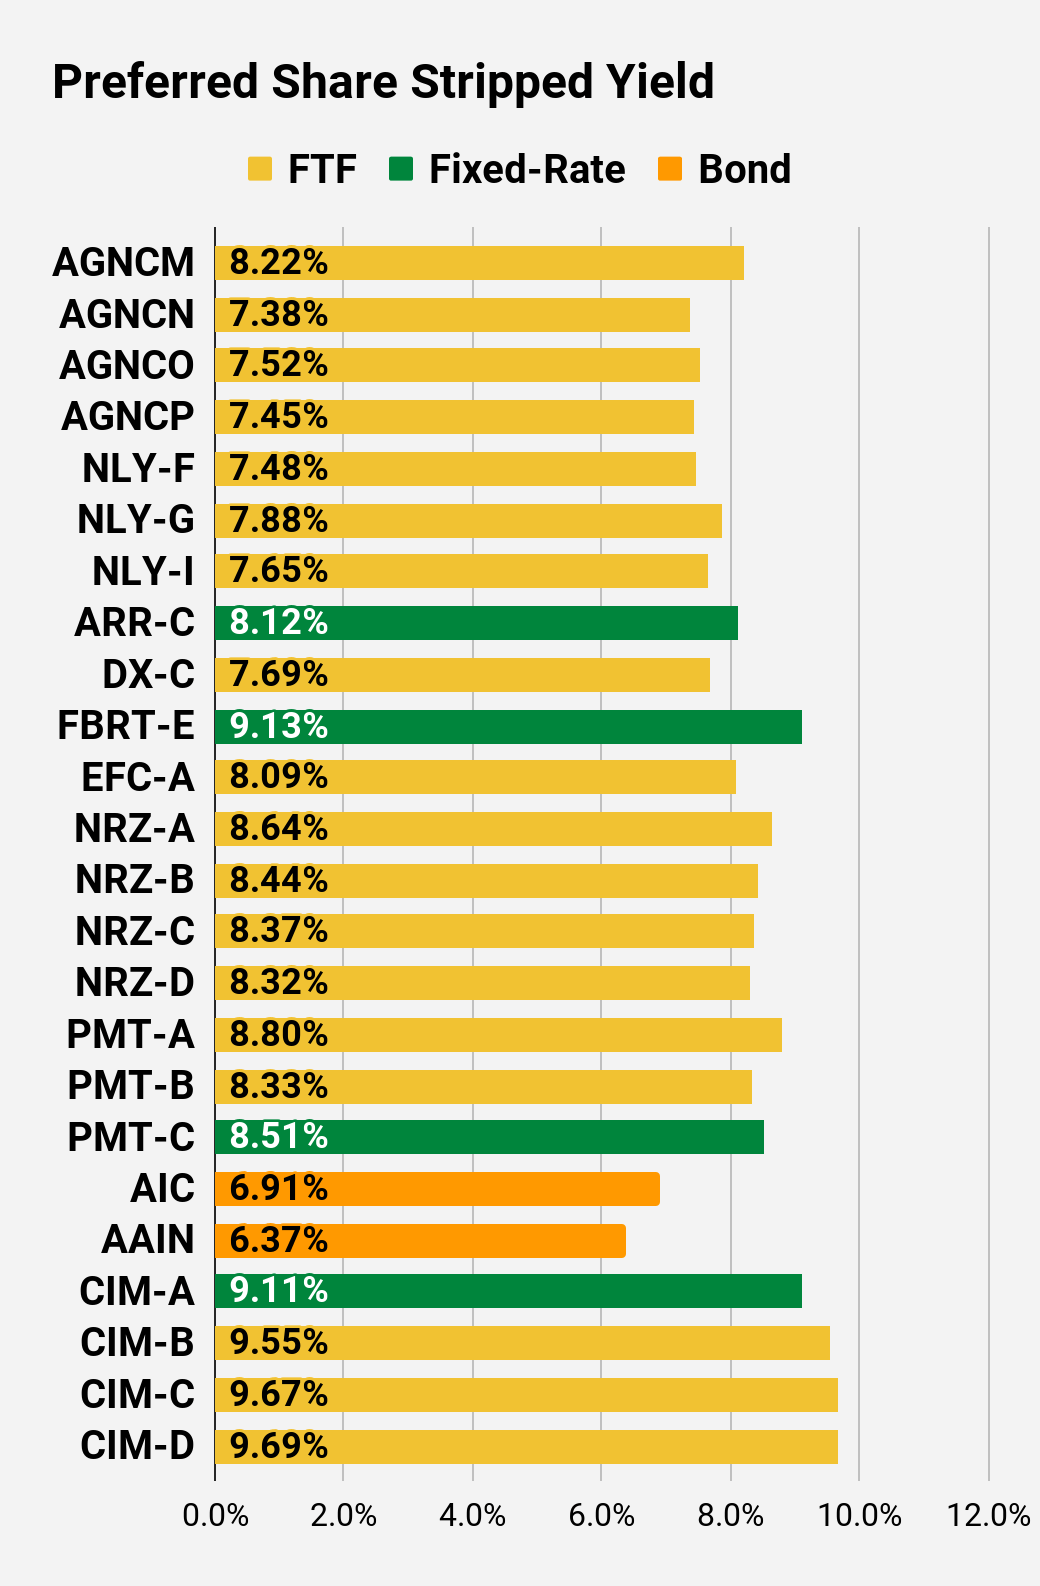
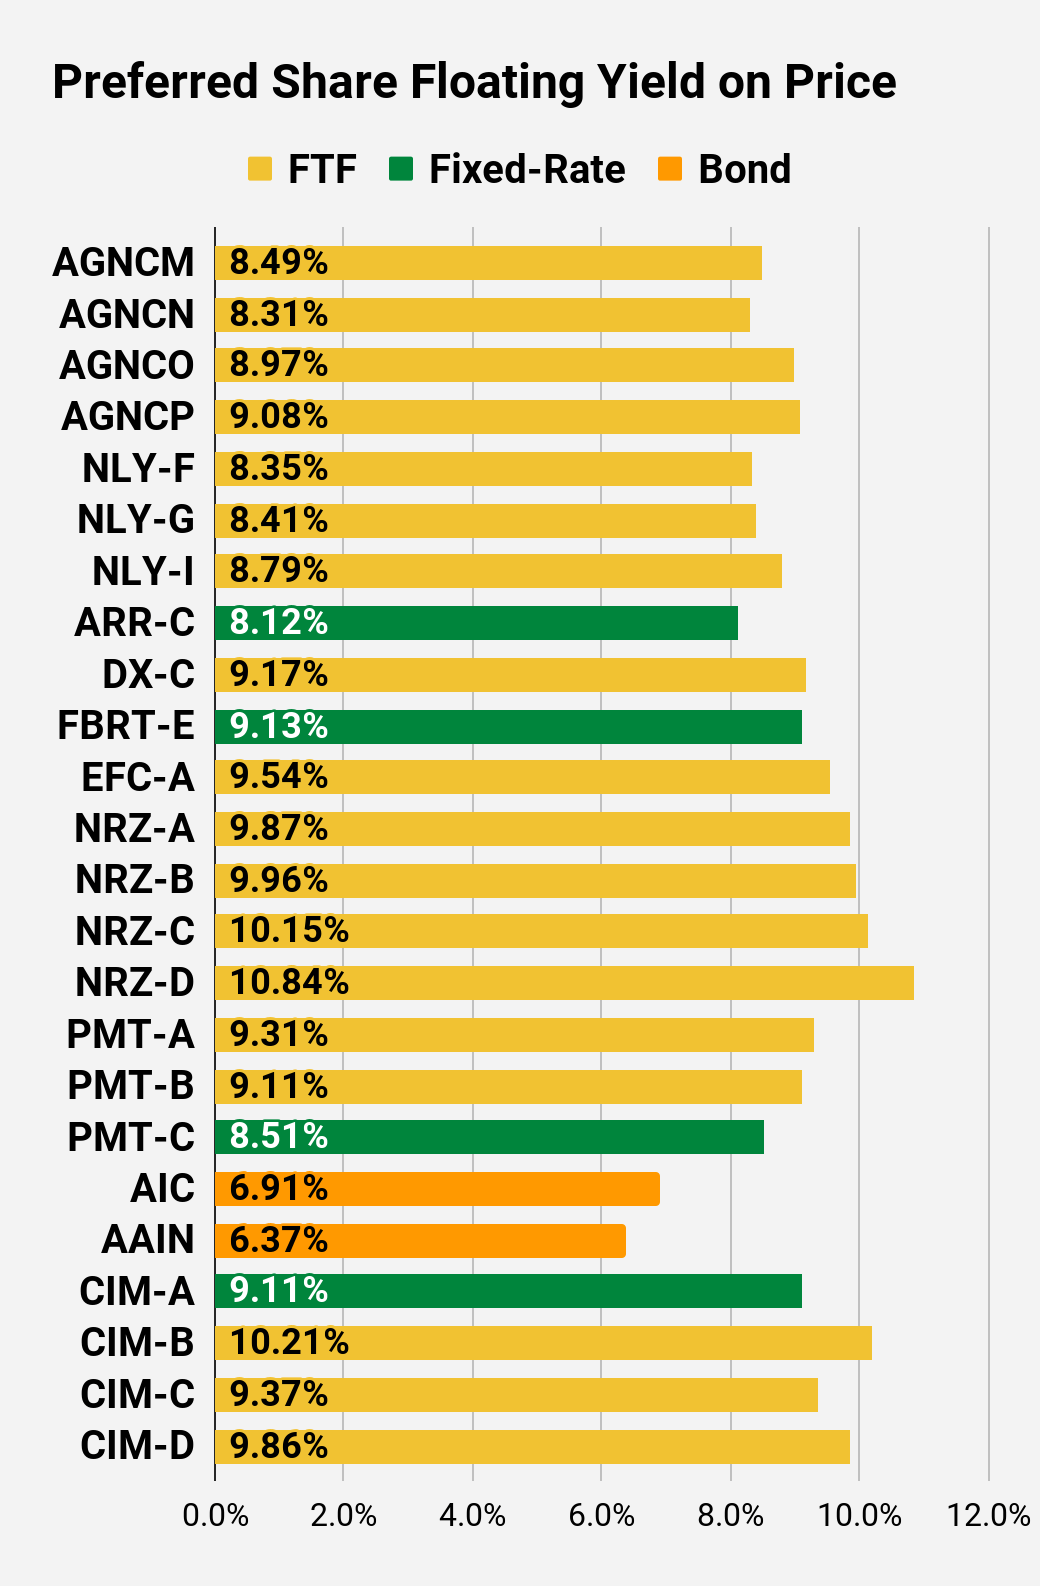
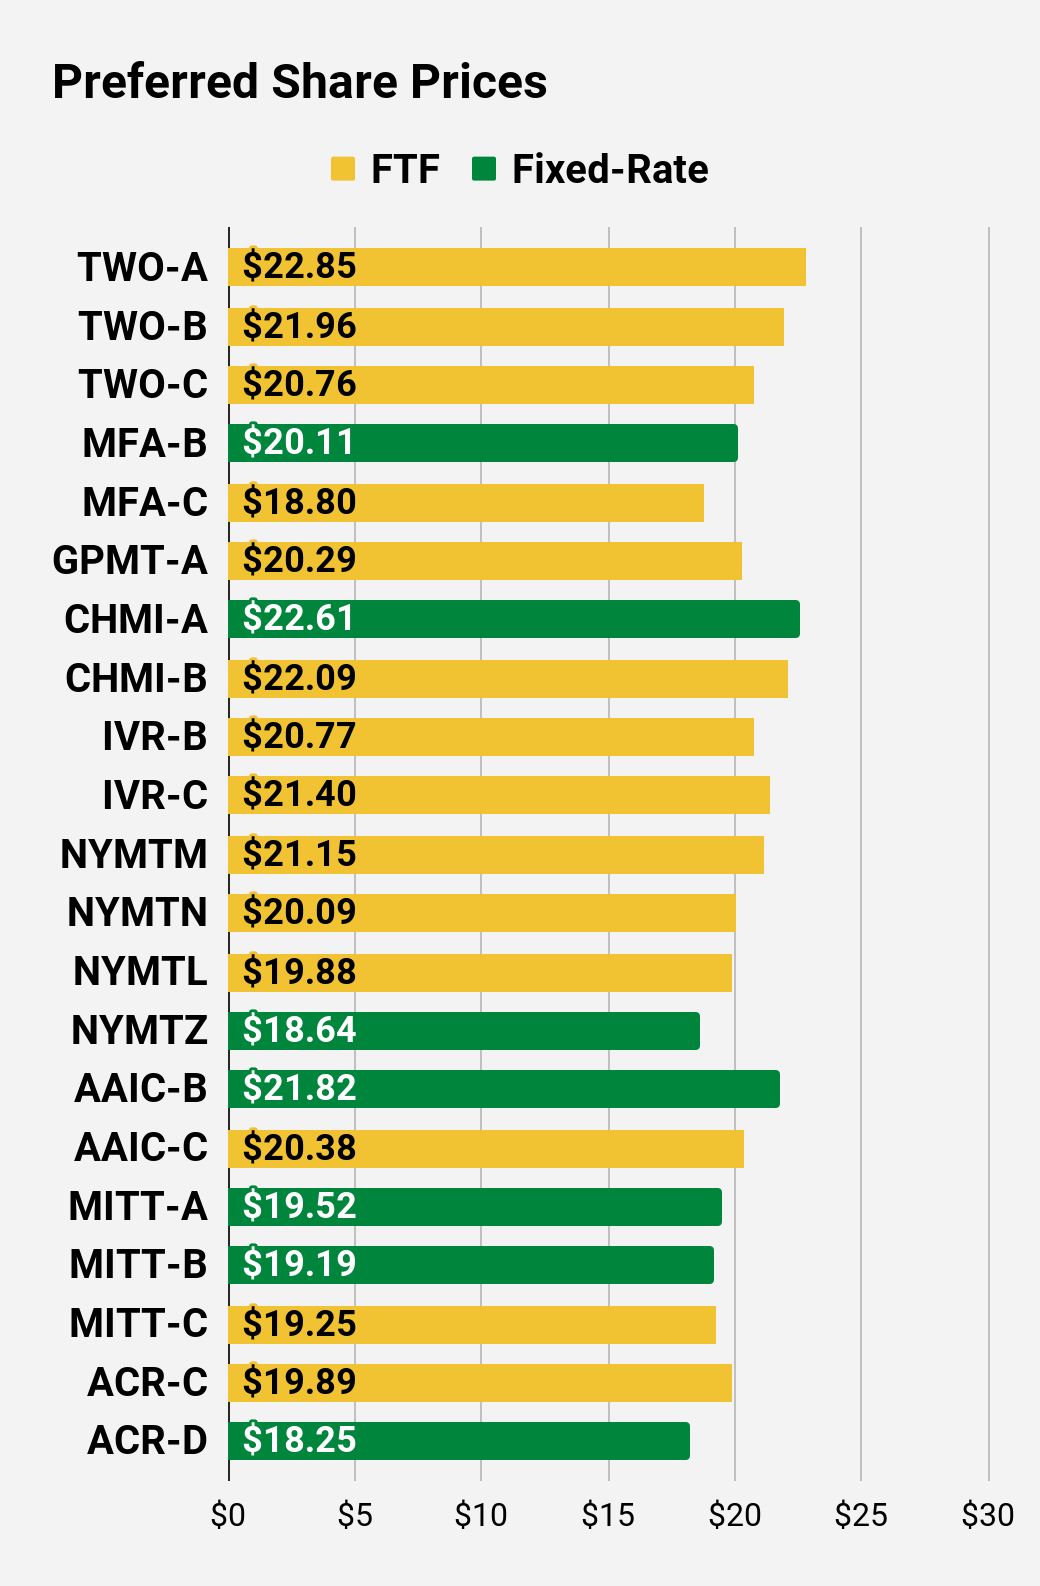
Preferred Share Charts
The REIT Forum
The REIT Forum
The REIT Forum
The REIT Forum
The REIT Forum
The REIT Forum
Preferred Share Data
Beyond the charts, we’re also providing our readers with access to several other metrics for the preferred shares.
After testing out a series on preferred shares, we decided to try merging it into the series on common shares. After all, we are still talking about positions in mortgage REITs. We don’t have any desire to cover preferred shares without cumulative dividends, so any preferred shares you see in our column will have cumulative dividends. You can verify that by using Quantum Online. We’ve included the links in the table below.
To better organize the table, we needed to abbreviate column names as follows:
Price = Recent Share Price – Shown in Charts
BoF = Bond or FTF (Fixed-to-Floating)
S-Yield = Stripped Yield – Shown in Charts
Coupon = Initial Fixed-Rate Coupon
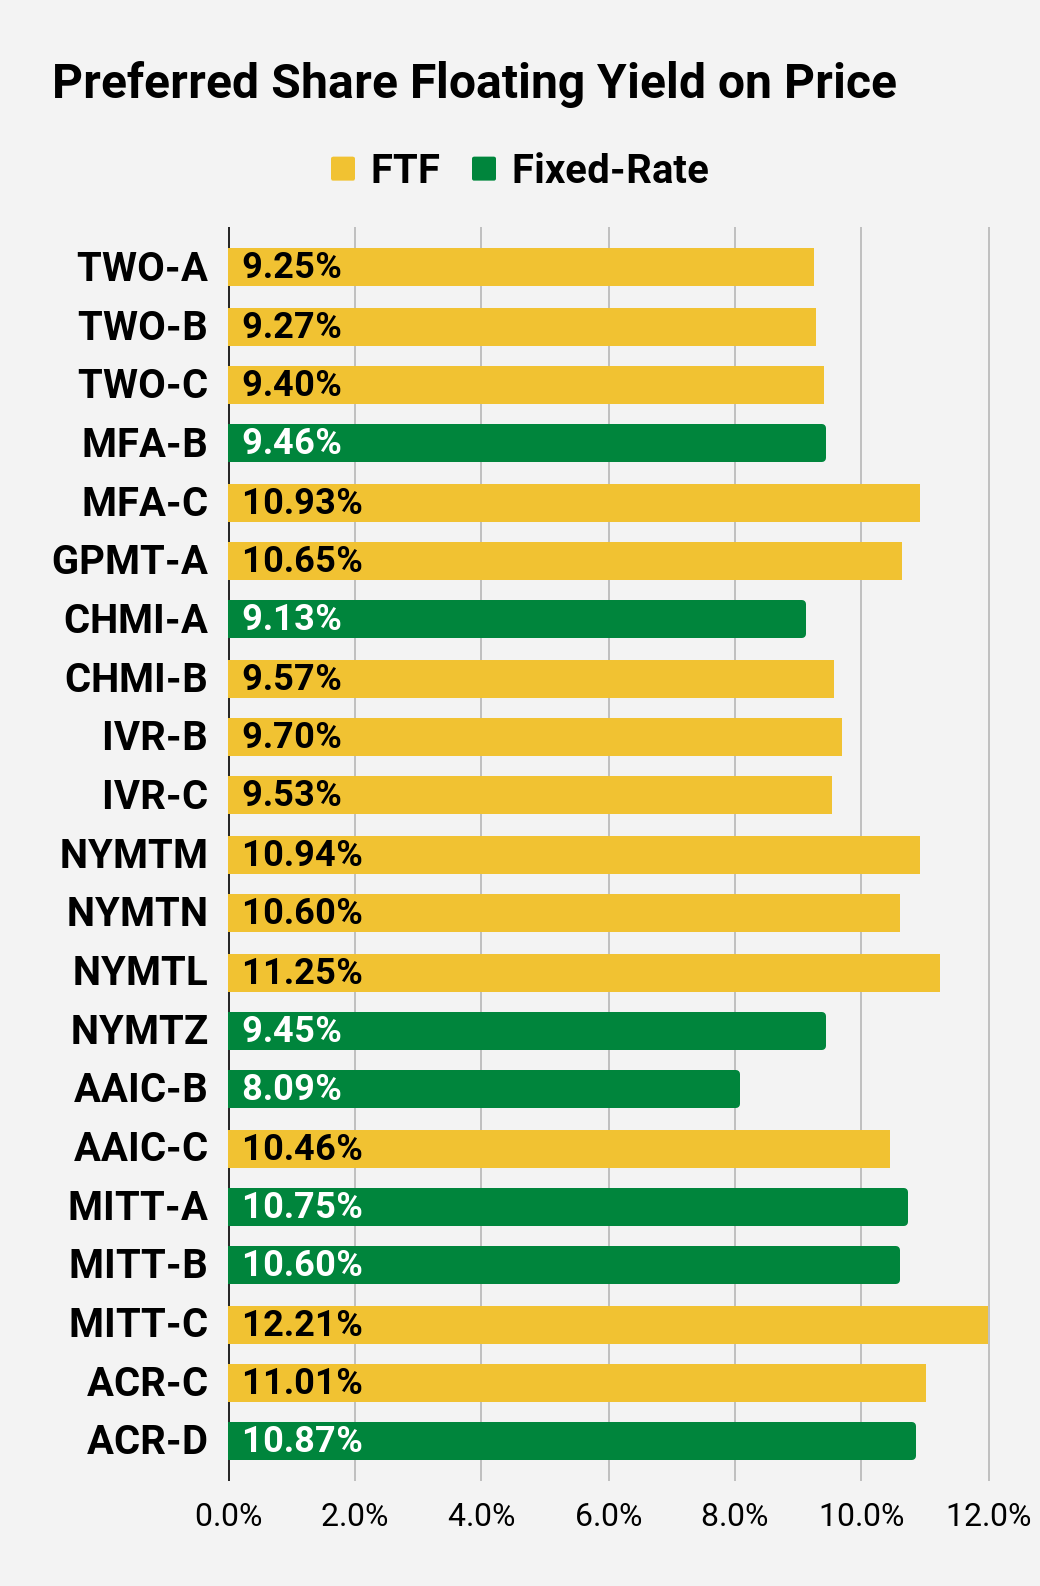
FYoP = Floating Yield on Price – Shown in Charts
NCD = Next Call Date (the soonest shares could be called)
Note: For all FTF issues, the floating rate would start on NCD.
WCC = Worst Cash to Call (lowest net cash return possible from a call)
QO Link = Link to Quantum Online Page
Second Batch:
Strategy
Our goal is to maximize total returns. We achieve those most effectively by including “trading” strategies. We regularly trade positions in the mortgage REIT common shares and BDCs because:
Prices are inefficient.
Long-term, share prices generally revolve around book value.
Short-term, price-to-book ratios can deviate materially.
Book value isn’t the only step in analysis, but it is the cornerstone.
We also allocate to preferred shares and equity REITs. We encourage buy-and-hold investors to consider using more preferred shares and equity REITs.
Performance
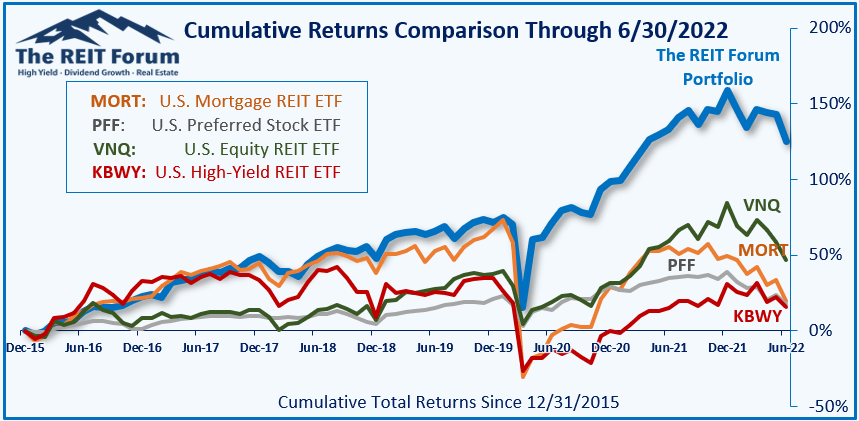
We compare our performance against 4 ETFs that investors might use for exposure to our sectors:
The high-yield equity REIT ETF. Yes, it has been dreadful.
When investors think it isn’t possible to earn solid returns in preferred shares or mortgage REITs, we politely disagree. The sector has plenty of opportunities, but investors still need to be wary of the risks. We can’t simply reach for yield and hope for the best. When it comes to common shares, we need to be even more vigilant to protect our principal by regularly watching prices and updating estimates for book value and price targets.
Please note that foreign exchange and other leveraged trading involves significant risk of loss. It is not suitable for all investors and you should make sure you understand the risks involved, seeking independent advice if necessary.


Be the first to comment