

Pgiam/iStock via Getty Images
Decades ago, before the deregulation of brokerage commissions and way ahead of today’s “no commission” world, people used to hold stocks for years, not hours, days or months.
The chart below shows average holding periods of slightly above seven years in the 1940s and greater than eight years as recently as the 1960s.
As commissions came down during the 2010 through 2019 decade average holding periods dropped to well below six months.
Average Holding Period by Decade (LPL Financial, NYSE)
That shift to looking for “instant results” is a huge problem for those seeking truly substantial gains along with favorable long-term capital gains tax rates.
The very best percentage rebounds typically come over months or years. The potential for huge upturns is created when shares get really beaten up. Sometimes that happens due to company-specific news. Other times it occurs due to general market malaise or outright panics like the COVID panic of March 2020.
The following list details five of the stocks I bought following enormous percentage declines due to the COVID panic. Traders and investors alike were scared to death seeing plunges like these and sold regardless of price simply to relive stress.
Nobody knew how long pandemic-related shutdowns would last or how well things would work out afterward.
It was like the early days of World War II, when legendary investor Sir John Templeton made his fortune buying shares of every NYSE company selling for under $2 per share.
Horrifying declines on otherwise healthy companies are fabulous to set yourself up for outsized rebounds like the ones illustrated below.
Declines and Rebounds (ValueLine )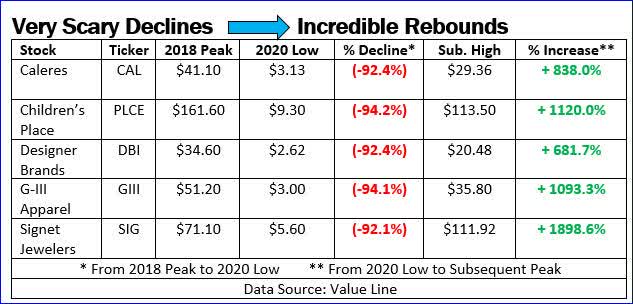
Bearish media personalities love to tell you that riding a stock down by 50% requires a 100% gain from “just to get even.” While that’s true, on the flip side, buying after a 50% decline and seeing the shares rebound to where they were previously, provides 100% upside. Once a stock has plummeted the Law of Asymmetric Returns kicks in: Buying after severe sell-offs can lead to excellent recovery prospects.
Asymmetric Returns (ALR)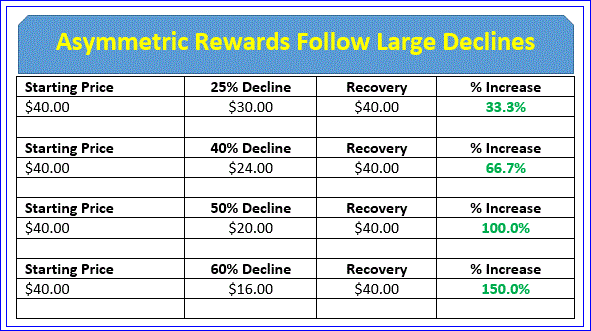
How can you know if a company is worth much more than its current price? I like to use long-term growth data to see how much value has been created vs. the change in share price over time.
When shareholders’ total returns trail stock price action by wide margins there’s usually money to be made. The more out of balance that ratio is, the higher the potential gains.
Signet Jewelers (SIG) rebounded to almost $112 per share in November 2021. Its shares proceeded to fall as low as $50.84 last October.
Fiscal Q3 (ended Oct. 31, 2022) numbers came in better than expected. Management now sees about $11.40 – $12.00 for FY 2022, up from $10.80 when I created the table below.
Signet metrics (ValueLine)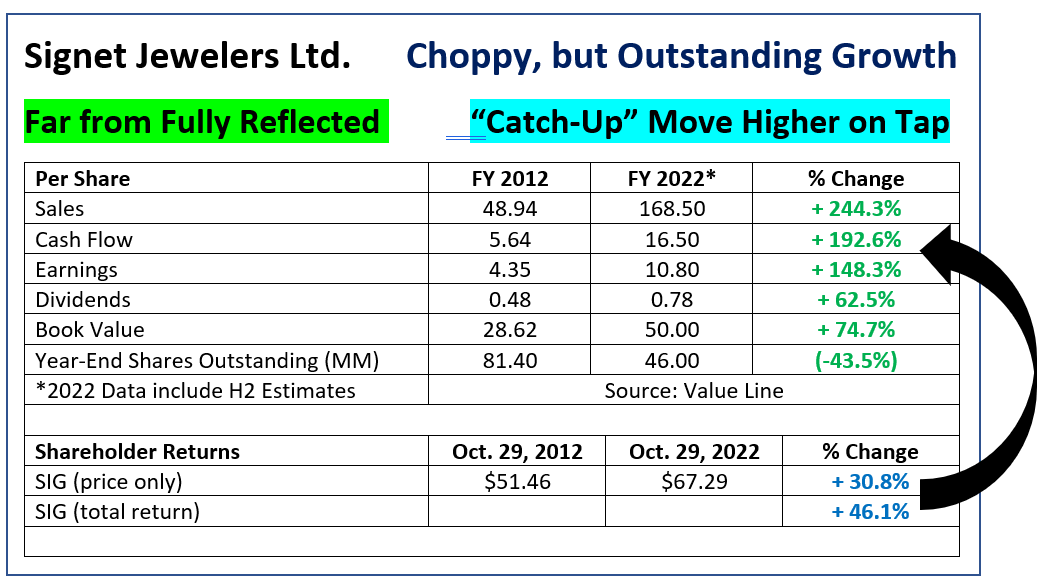
Since 2012 Signet’s business metrics surged yet the shares barely reflected the value created. That sets it up for a major “catch-up” higher to arbitrage away the discrepancy between price and worth.
Signet’s four most recent sell-offs gave investors chances at average gains of 433% achieved over average holding periods of just 23 months. Eliminate the astounding COVID panic low and those figures come to three rebounds averaging 133.1%, plus dividends, over about 4.33-months.
Signet Trading Opportunities (ValueLine)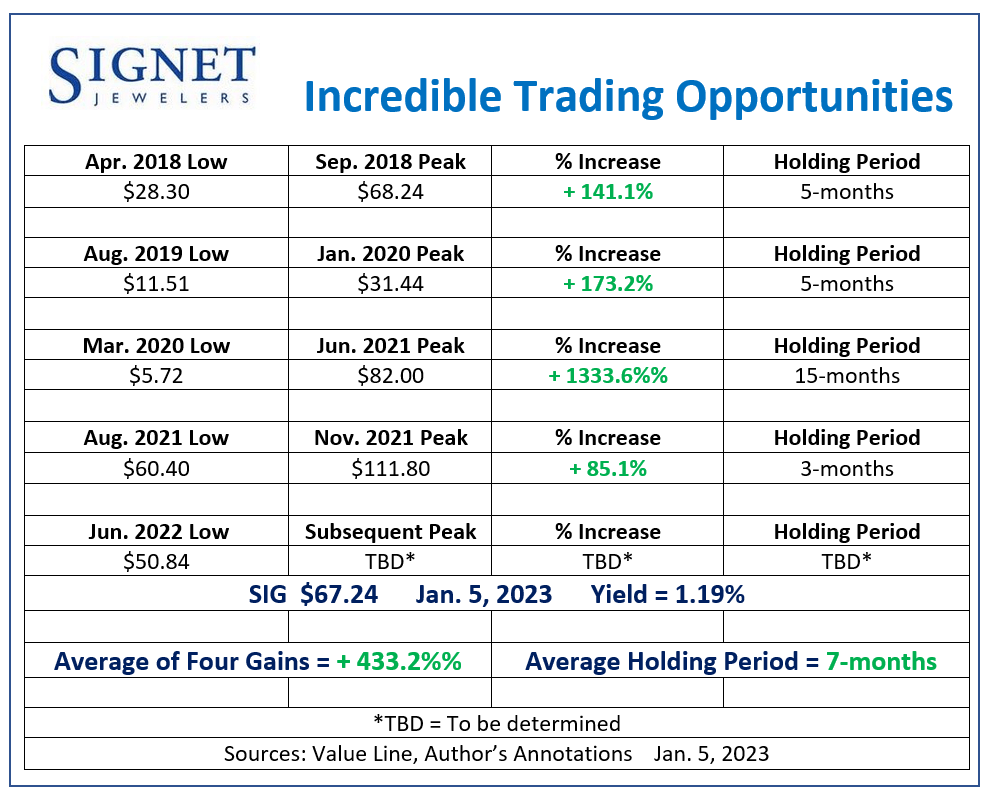
Caleres (CAL) had three major gains following large declines since 2019. Include the COVID panic period and they averaged + 322.6% over just eight months. Excluding the post-COVID rebound, the two remaining gains averaged 75.3% over five months.
Caleres Trading Opportunities (ValueLine, Author’s Annotations)
Wolverine World Wide (WWW) is another footwear company which gave investors superior trading opportunities over the years. The firm produces and markets many famous brands while posting reliable profits.
Wolverine’s financial metrics (Wolverine)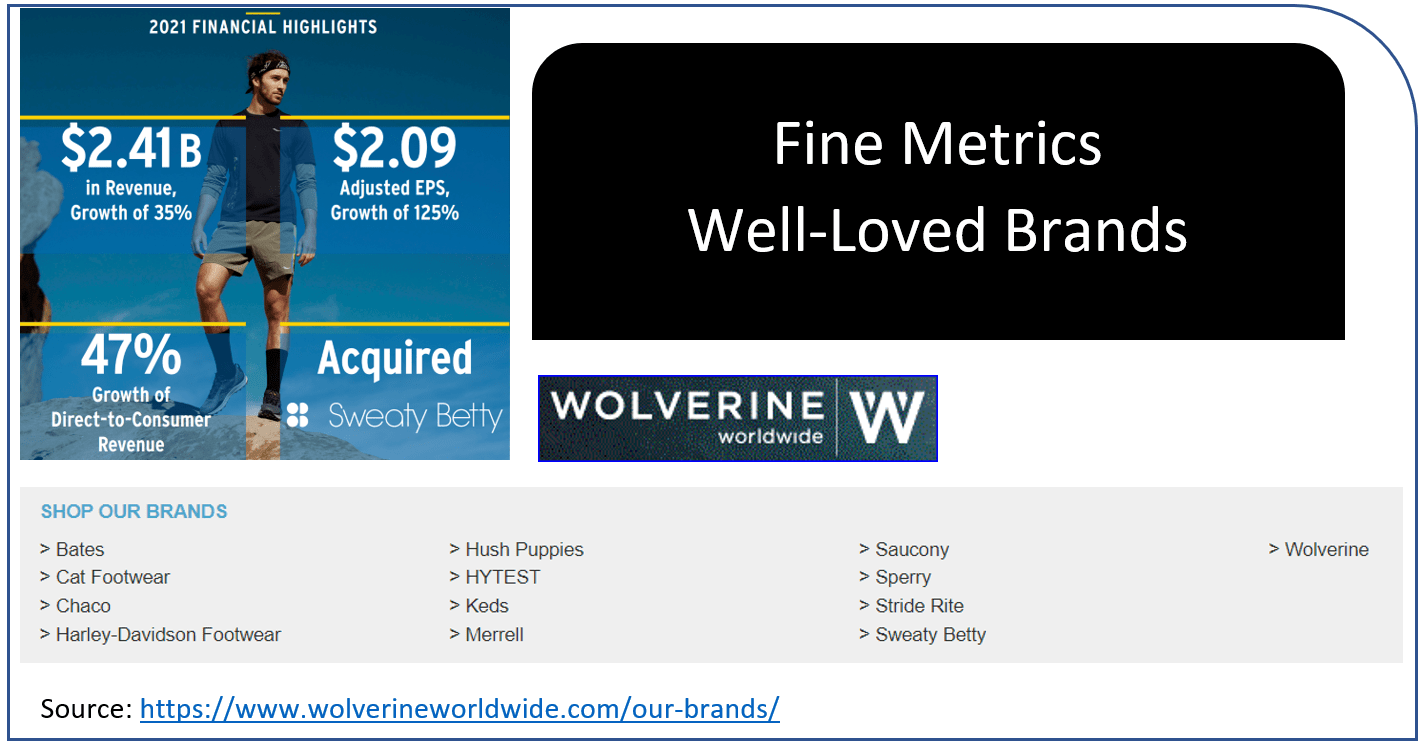
Since early 2016 the stock saw two major upturns followed by three subsequent declines. The latest sell-off, from $44.68 to $9.60, totaled 78.5% from peak to trough. As of Jan. 5, 2023, WWW was still down by almost 76%.
I smell opportunity with WWW now. At just 7.2-times trailing EPS for the FY ending Jan. 28, 2023 and a 3.7% current yield there is very substantial upside. The stock’s 10-year median multiple has been 17x.
WWW’s last two rebounds averaged 218.5% over around 23 months.
Wolverine Trading Opportunities (ValueLine, Author’s Annotations)
Company officers obviously agree. There were three significant insider buys on Dec. 9, 2022, totaling more than $1.1 million dollars at an average cost of $10.47 per share.
Wolverine Insider Buying (Insidercow.com, Author’s Annotations)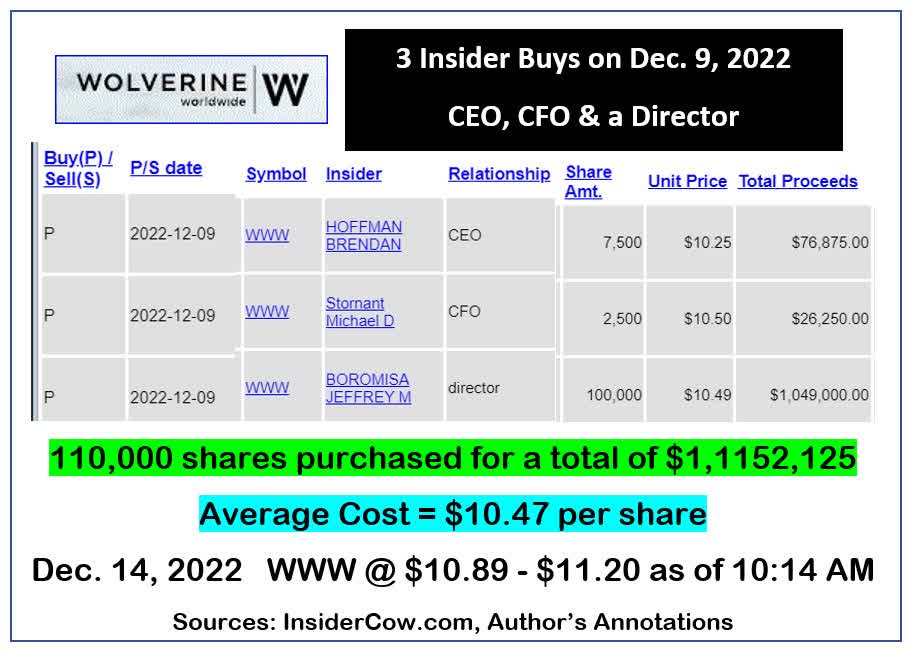
G-III Apparel (GIII) owns or licenses many beloved fashion brands.
G-III Apparel Brands (G-III Apparel)
Over the past eleven years its shares saw five declines averaging a painful 71.9%. Value-oriented investors would not have owned it at the peaks. Smart buyers near the lows saw four subsequent rebounds averaging a staggeringly great 529%.
Downturns lasted about 13 months, share price recoveries averaged 19-months.
GIII Trading Opportunties (ValueLine, Author Annotations)
As with WWW, the company’s CEO and a Director ponied up almost $3.4 million to buy 269,000 shares on the open market last month. Their average price was $12.57 per share. They are happy so far. GIII closed on Jan. 5, 2023 at $14.20, up almost 13% in under one month.
GIII Insider Buying (Insidercow.com, Author’s Annotations)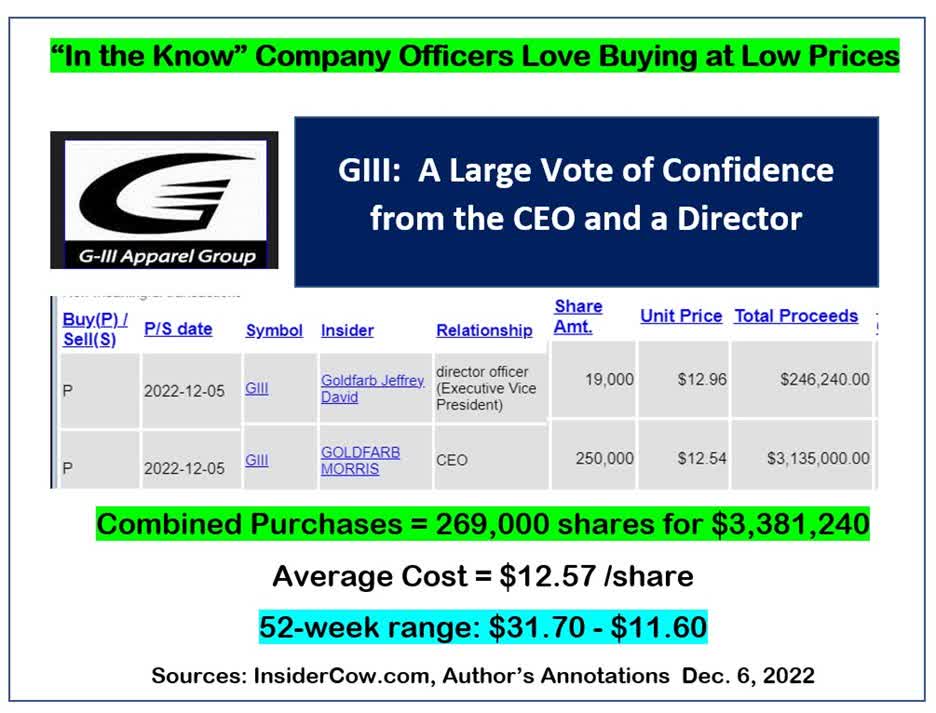
It’s not just shares of mundane industries that offer terrific trading opportunities. Axos Financial (AX) is a premier growth company. Its data since 2013 speaks for itself.
Even so, the shares declined from $62.40 in December 2021 to as low as $33.91 on Sept. 30, 2022. That 45.6% decline was totally unwarranted, presenting a great entry point.
AXOS Financial Metrics (Yahoo Finance)
Fundamentals have never been stronger. Amazingly, the stock, at its Jan. 5, 2023 quote of $37.47, now trades for just 8.1-times this year’s estimate. That represents a 36.2% discount to AX’s average P/E, which looks cheap to begin with considering the company’s proven growth profile.
AXOS Chart (ValueLine, Author’s Annotations)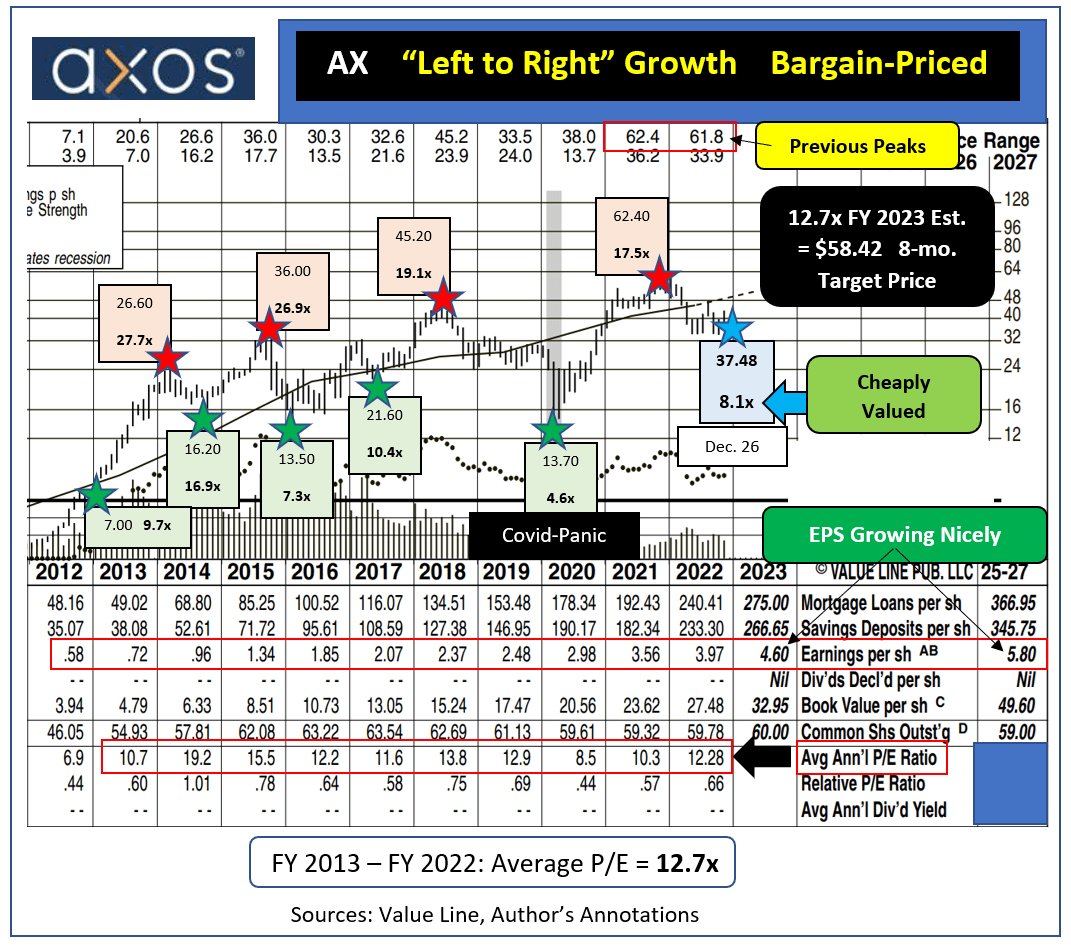
Market volatility often gave traders chances to buy AX low following big declines. The previous four rebounds averaged 381.5% gains over average holding periods of 21.5 months.
AXOS Trading Opportunities (ValueLine, Author’s Annotations)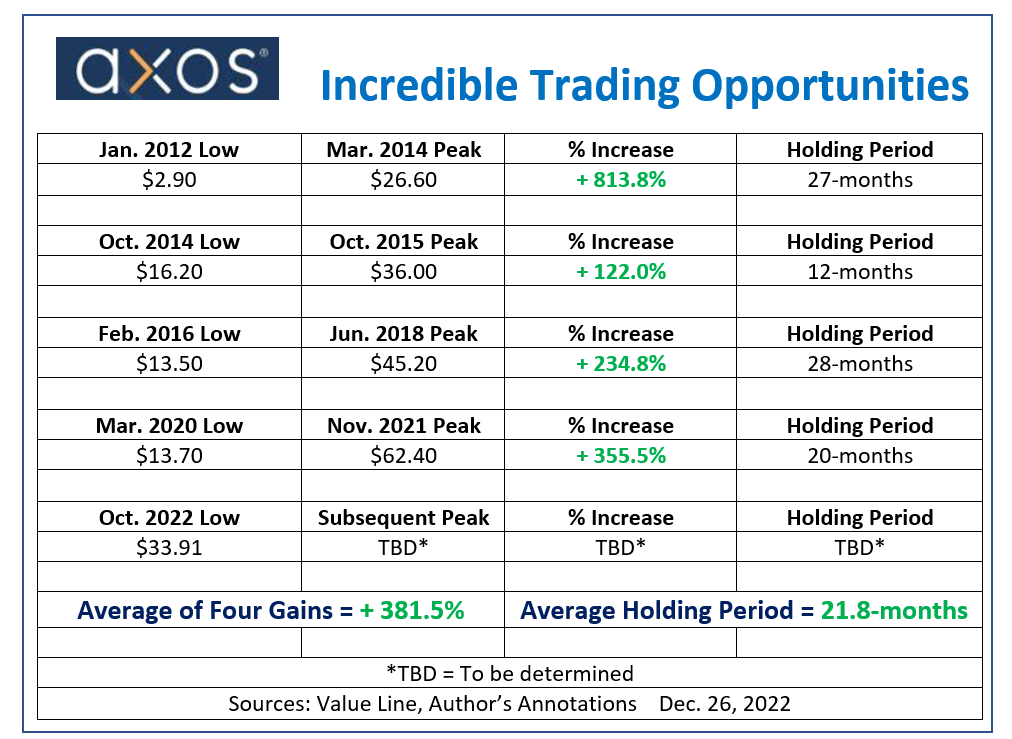
Brokerage firm Interactive Brokers (IBKR) understandably moves sharply along with major market swings. Here is what IBKR looked like on May 12, 2022, compared with cumulative shareholder returns at that time.
Interactive Brokers Metrics (Yahoo Finance, ValueLine )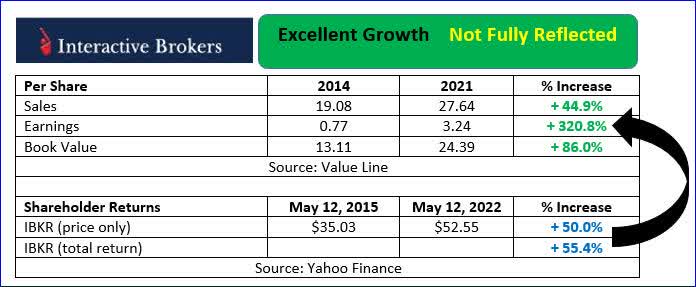
Seven-year total returns of 55.4% were far lower than the greater than 320% EPS growth. It reached $81.46 on Nov. 2, 2022, up 55% plus dividends in under six months.
As of Jan. 5, 2023 IBKR sat at $71.82, mostly due to generally punk market action.
The three most recent rebounds for IBKR, not counting the current one, averaged 185.1% and only required about 28-months to achieve that.
Interactive Brokers Trading Opportunities (ValueLine, Author’s Annotations )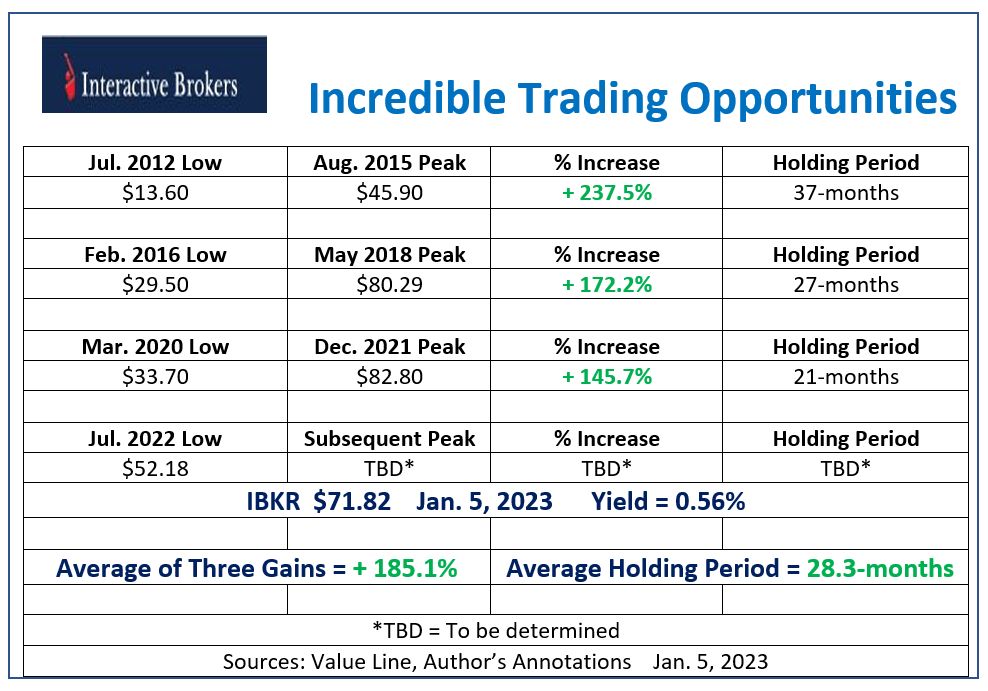
The Law of Asymmetric Returns is always in effect.
P/E expansion is the fuel that creates fabulous gains, and low P/E shares are the best candidates for multiple expansion. We try to identify bargain stocks by comparing long-term value creation to total return for continuous shareholders. Day trading and other short-term strategies rarely capture the breathtaking gains that are achievable by long-term strategies.
Huge capital gains are easiest to capture by going long following sharp percentage sell-offs in bargain stocks. Healthy companies with severely depressed prices offer the best reward to risk ratios. Buying, when you feel the most uncomfortable doing so, is the key to enormous profits.
Disclosure: Long shares and short options of all specific stocks mentioned.
Be the first to comment