tiero
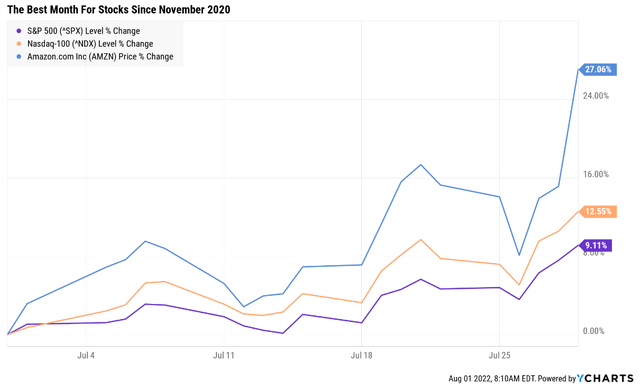
What a glorious month for stocks! The S&P soared 9%, its best month since November 2020.
The Nasdaq just roared 13%, its best month since April 2020.
And Amazon (AMZN) rocketed up 27%, or nearly 1% per day.
What explains this impressive rally? There are many factors, but the market pricing in a Fed pivot is the biggest.
- slowing growth causing the Fed to stop hiking rates,
- start cutting rates
- and stop QT (rolling off its balance sheet)
There is only one small problem with this super bullish thesis in my opinion. It’s based on a mass delusion, with zero evidence to back it up.
Neil Kashkari, the president of the Minneapolis Fed, is considered by many to be the most dovish Fed president. And here’s what the most dovish FOMC member says about the recent “Fed pivot” thesis.
I’m surprised by markets’ interpretation,” Mr. Kashkari said in an interview. “The committee is united in our determination to get inflation back down to 2 percent, and I think we’re going to continue to do what we need to do until we are convinced that inflation is well on its way back down to 2 percent — and we are a long way away from that.”- NYT
I watched the Fed’s press conference and can verify that nothing Fed chair Jerome Powell said was actually dovish.
- the Fed has withdrawn inter-meeting guidance
- but says to use the June dot plot for the best estimate of the Fed’s terminal rate
What does the Dot plot say about where the Fed is headed?
- 3.75% by mid-2023
- 1.5% above where we are today
Now I should say that another theory explaining the recent rally is that a mild recession MIGHT already be priced in.
- Goldman and Citi believe this to be the case
- -24% to -25% peak declines are their base case scenarios
We hit -24% on June 16th, from which the market has rallied 14%.
But the consensus is that the Fed pivot thesis has been driving stocks higher, including the strongest 2-day post-Fed meeting rally in history.
But here’s the problem with that bullish thesis, it’s 100% wrong.
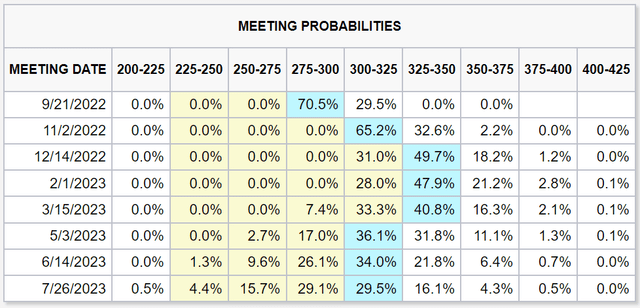
Here is what the stock and bond markets are currently pricing regarding where the Fed is headed with interest rates.
The market is pricing in 50 in September, then 25 in November and December, and then a pause until the first rate cut in May.
The Fed is clear that until they see strong evidence that inflation is headed back to its long-term target of 2%, it won’t stop hiking, much less pausing, much less cutting, much less stopping QT.
- step 1: inflation peaks
- step 2: inflation falls consistently
- step 3: the fed slows the pace of rate hikes
- step 4: the Fed stops hiking
- step 5: the Fed starts cutting (to neutral, 2.5% FOMC consensus)
- step 6: the Fed ends QT (in mid-2025, per the current plan, which is on autopilot)
The Market jumped from step 1 to step 6 in one month, with zero actual evidence.
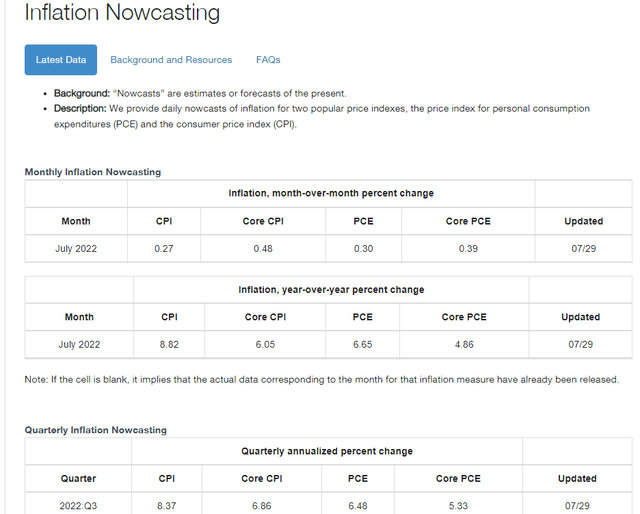
The good news is the Cleveland Fed’s daily inflation nowcast is predicting the July CPI report (coming August 10th) will show 8.8% YOY inflation.
That’s less than 9.1% for June, BUT core PCE, the Fed’s official inflation metric, is expected to rise 4.9% YOY, compared to 4.8% in June.
And some potentially very bad news could shock the market in the coming few weeks, potentially causing stocks to fall 20% in just 3 weeks.
Why Stocks Might Fall 20% In August
I’m not a market timer, and I’m not here to try to scare you out of stocks for the next month.
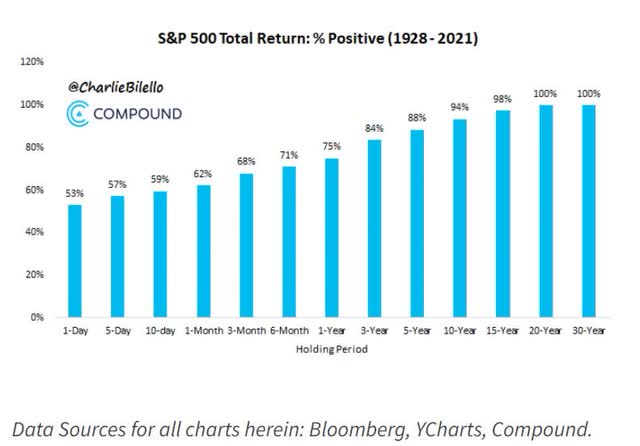
- studies are very clear that if you try to time the market, you are 98% likely to fail
- and risk turning up to 8.2% inflation-adjusted long-term gains into -3.1% CAGR
- instead of 1,150X inflation-adjusted returns over 90 years, -94%
- by missing just the 10 single best daily gains of each decade
But my goal is to help you stay calm, rational, and disciplined, including warning of what might cause short-term pain that could lead many to panic sell and unnecessarily turn paper losses into real ones.
The biggest single risk to the market is the simple fact that inflation might not have peaked yet.
How can that be with commodity prices and gas prices falling 30+% in recent weeks?
How can that be when the Cleveland Fed thinks inflation has peaked? Research Affiliates has the answer, and I call it spreadsheet math.
- the next CPI report will drop a lower inflation month and replace it with a higher one
- potentially causing YOY inflation to keep rising for a lot longer than the market expects
- and thus forcing the Fed to hike a lot more
- 4% by year-end according to Fed president Bullard and Citigroup
Here’s Research Affiliates’ basic model, using a few key assumptions.
- mostly that the monthly rate of inflation falls at the 0.3% rate the Cleveland Fed’s model is anticipating
Research Affiliates Stagflation Hell Model
| Current Month | Month A Year Earlier | CPI YOY Growth | CPI Cleveland Fed Model | Difference | RA CPI YOY Model Estimate |
| July 2022 | July 2021 | 5.4% | 8.8% | 3.4% | 9.4% |
| August 2022 | August 2021 | 5.3% | 8.5% | 3.2% | 9.7% |
| September 2022 | September 2021 | 5.4% | 8.2% | 2.8% | 9.9% |
| October 2022 | October 2021 | 6.2% | 7.9% | 1.7% | 10.0% |
| November 2022 | November 2021 | 6.8% | 7.6% | 0.8% | 10.1% |
| December 2022 | December 2021 | 7.0% | 7.3% | 0.3% | 10.1% |
| January 2023 | January 2022 | 7.5% | 7.0% | -0.5% | 10.1% |
| February 2023 | February 2022 | 7.9% | 6.7% | -1.2% | 10.0% |
| March 2023 | March 2022 | 8.5% | 6.4% | -2.1% | 9.8% |
| April 2023 | April 2022 | 8.3% | 6.1% | -2.2% | 9.6% |
| May 2023 | May 2022 | 8.6% | 5.8% | -2.8% | 9.4% |
| June 2023 | June 2022 | 9.1% | 5.5% | -3.6% | 9.1% |
| July 2023 | July 2022 | 9.4% | 5.2% | -4.2% | 8.8% |
| August 2023 | August 2022 | 9.7% | 4.9% | -4.8% | 8.4% |
| September 2023 | September 2022 | 9.9% | 4.6% | -5.3% | 7.9% |
| October 2023 | October 2022 | 10.0% | 4.3% | -5.7% | 7.4% |
| November 2023 | November 2022 | 10.1% | 4.0% | -6.1% | 6.9% |
| December 2023 | December 2022 | 10.1% | 3.7% | -6.4% | 6.4% |
(Sources: Research Affiliates, Cleveland Fed, Bureau of Labor Statistics)
Now I’m not saying that the Research Affiliates model is correct, and I hope the statisticians at the Cleveland Fed are baking the calendar into their model.
But with producer price inflation at 11.1%, and thus far inflation surprising to the upside and shocking most economists, we can’t ignore RA’s model, which estimates that inflation MIGHT potentially peak at 10.1% in November and stay that high through February, and not start consistently falling until march.
Moreover, RA’s model estimates that YOY CPI might be as high as 6.4% by the end of December… 2023.
Does this sound like an environment in which the Fed will be able to pivot?
Bank of America, Bridgewater, and Deutsche Bank have all released research reports showing how if inflation stays sticky into 2023, the Fed might have to hike to 5% or even 6%.
- Blackstone also thinks the Fed might have to hike to 5%
Societe General and UBS also include a stagflation hell scenario in their worst-case scenario estimates, which show the S&P 500 potentially bottoming at -48% to -52% from record highs.
But a 20% market crash in 3 to 4 weeks is pretty intense, and even if RA’s inflation model proves correct (or even close to correct) why would stocks fall that much that quickly?
If RA’s model is correct, May 2023, when the market is currently pricing in a Fed hike, could have 9.4% CPI, higher than it is now. The Fed would not be cutting rates if inflation remains elevated for this long, but why -20% and why by the end of August?
Morgan Stanley, one of the 16 most accurate economist teams in the world, according to Market Watch, has thus far been very accurate in this bear market.
According to Mike Wilson, CIO of Morgan Stanley, their base case is for the S&P 500 to bottom at 3,400 to 3,500 (about -30% in total), 20% lower than it is now.
- 3,900 by the end of the year
- 4,200 by the end of June 2023
- basically a sharp final decline in August
- and stocks flat from current levels for about 12 months
They expect this by the end of August, coinciding with the end of the S&P 500 earning season.
Does Morgan Stanley think a recession is coming?
- Morgan Stanley estimates a 36% probability
- Goldman Sachs 34%
- Moody’s 45%
- Bloomberg 40%
No, most blue-chip economists don’t (BAC and Deutsche Bank are the only ones I know of who have a mild recession as their base case).
So why is Morgan Stanley so bullish in the short-term if they don’t think we’re going into a recession soon?
The Simple Math Behind Bear Market Bottom Forecasts
| Time Frame | Historically Average Bear Market Bottom |
| Non-Recessionary Bear Markets Since 1965 | -21% (Achieved May 20th) |
| Median Recessionary Bear Market Since WWII | -24% (Citigroup base case with a mild recession) June 16th |
| Non-Recessionary Bear Markets Since 1928 | -26% (Goldman Sachs base case with a mild recession) |
| Average Bear Markets Since WWII | -30% (Morgan Stanley base case, no recession) |
| Recessionary Bear Markets Since 1965 | -36% (Bank of America recessionary base case) |
| All 140 Bear Markets Since 1792 | -37% |
| Average Recessionary Bear Market Since 1928 |
-40% (Deutsche Bank, Bridgewater, SocGen Severe Recessionary base case, Morgan Stanley Recessionary Base Case) |
|
(Sources: Ben Carlson, Bank of America, Oxford Economics, Goldman Sachs) |
Here are the historical bear market lows both with and without recessions.
Notice how the blue-chip consensus is for a -24% to -40% bear market depending on whether or not we get a recession in 2023.
How do these blue-chip economists come up with such forecasts? Do they simply pluck a historical average out of a hat and then declare this their house forecast?
They use a very simple fundamental model based on two simple things.
- how much will earnings fall in a recession (vs. current 2023 expectations to estimate a potential end of year 2022 bear market bottom)
- the historical trough P/E in recessionary bear market lows (13 to 15)
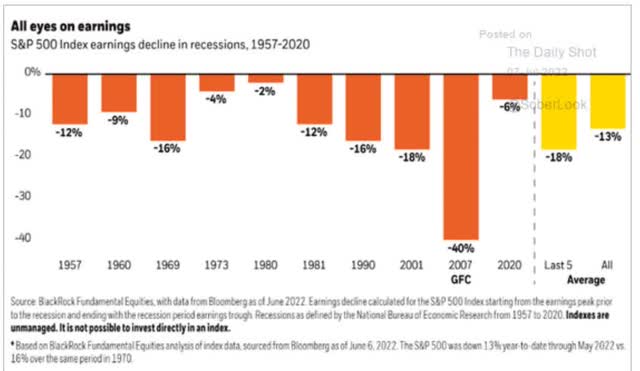
Depending on the time frame, the average S&P EPS decline in recessions ranges from 13% (since 1957 and WWII) to 18%.
Morgan Stanley’s base case is that EPS estimates for 2023 are 10% too high and will fall that much even without a recession.
If we get a mild recession in 2023, they expect a 20% EPS decline.
So far, the most severe EPS decline estimates I’ve seen are from Soc Gen’s and UBS’s -30% in a severe stagflation hell scenario.
| EPS Decline | 2023 EPS Consensus |
| 0% | $249 |
| 5% | $237 |
| 10% | $224 |
| 15% | $212 |
| 20% | $199 |
| 25% | $187 |
| 30% | $174 |
(Source: FactSet Research Terminal)
Now apply the historical 13 to 15X trough forward P/E range that’s proven accurate outside the most extreme recessions (such as the GFC).
| Trough Forward P/E At Market Low (Bearish Scenario) | Trough Forward P/E At Market Low (Base Case Scenario) | Trough Forward P/E At Market Low (Bullish Scenario) |
| 13 | 14 | 15 |
And here’s what you get.
| EPS Decline | Trough Forward P/E At Market Low (Bearish Scenario) | Trough Forward P/E At Market Low (Base Case Scenario) |
Trough Forward P/ E At Market Low (Bullish Scenario) |
| 0% | 3,237 | 3,486 | 3,735 |
| 5% | 3,075 | 3,312 | 3,548 |
| 10% | 2,913 | 3,137 | 3,362 |
| 15% | 2,751 | 2,963 | 3,175 |
| 20% | 2,590 | 2,789 | 2,988 |
| 25% | 2,428 | 2,615 | 2,801 |
| 30% | 2,266 | 2,440 | 2,615 |
(Source: FactSet Research Terminal)
What does that mean for a potential decline from July 29th’s close of 4,130 on the S&P 500?
| EPS Decline | Further Potential Decline (Bearish Scenario) | Further Potential Decline (Base Case Scenario) |
Further Potential Decline (Bullish Scenario) |
| 0% | 21.6% | 15.6% | 9.6% |
| 5% | 25.5% | 19.8% | 14.1% |
| 10% | 29.5% | 24.0% | 18.6% |
| 15% | 33.4% | 28.3% | 23.1% |
| 20% | 37.3% | 32.5% | 27.7% |
| 25% | 41.2% | 36.7% | 32.2% |
| 30% | 45.1% | 40.9% | 36.7% |
(Source: FactSet Research Terminal)
And here’s what it means for a potential peak decline for the entire bear market.
| EPS Decline | S&P Peak Decline (Bearish Scenario) | S&P Peak Decline (Base Case Scenario) |
S&P Peak Decline (Bullish Scenario) |
| 0% | 32.8% | 27.7% | 22.5% |
| 5% | 36.2% | 31.3% | 26.4% (Citi Group, Goldman Base Case) |
| 10% | 39.5% | 34.9% | 30.2% (Morgan Stanley Base Case) |
| 15% | 42.9% | 38.5% (Overall Blue-Chip Consensus, Historical Average) | 34.1% |
| 20% | 46.3% | 42.1% | 38.0% (Bank of America Base Case) |
| 25% | 49.6% (Soc Gen Worst Case) | 45.7% | 41.9% |
| 30% | 53.0% (UBS Worst-Case) | 49.4% | 45.7% |
(Source: FactSet Research Terminal)
There are some important things to note about these forecasts.
- The 60% to 90% doomsday scenarios are likely way too pessimistic
- the world’s best economists always think in terms of ranges of likely, bearish, and bullish outcomes, not exact price targets
- Wall Street runs on probabilities, not certainties
But here’s what I can tell you with near certainty.
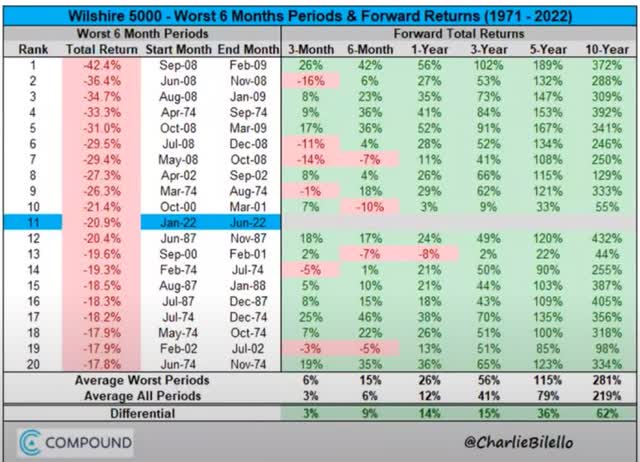
- buying stocks after a terrible 6 months historically results in 4% to 6% higher annual returns for the next decade
- a 3.8X historical return in the next 10 years
- 14.4% CAGR
- individual blue-chips could deliver 9X to 24X
If you don’t buy blue-chips in a bear market, you will very likely regret it 10 years later.
If you try to time the market, you’ll almost certainly regret that too.
If you trust the world’s best blue-chips to safeguard and grow your income and wealth, you will almost certainly not regret that.
And that’s why today I wanted to showcase 6 incredible high-yield low volatility blue-chips that can help you sleep well at night even if the market does plunge as much as 20% in August and potentially far more before this bear market bottoms.
- even if this bear market has bottomed at some point, the market will crash again
- that’s one of the few certainties on Wall Street
The more stocks fall in a bear market, the larger the future gains, and the only thing standing in the way of retiring in safety and splendor is you remaining sane, safe, and rational when the market freaks out.
How To Find The Best High-Yield Low Volatility Blue-Chips For A Future Market Crash In 3 Minutes
Knowing which blue-chips are best for your goals, time horizon, and risk profile starts with the right watchlist.
The Dividend Kings 500 Master List is one of the world’s best watchlists, including
- every dividend aristocrat (S&P companies with 25+ year dividend growth streaks)
- every dividend champion (every company, including foreign, with 25+ year dividend growth streaks)
- every dividend king (every company with 50+ year dividend growth streaks)
- every foreign aristocrat (every company with 20+ year dividend growth streaks)
- every Ultra SWAN (wide moat aristocrats, as close to perfect quality companies as exist)
- 40 of the world’s best growth stocks
And this is the watchlist that powers our Zen Research Terminal which allows you to find the best companies for your needs in two to three minutes.
Here’s how I screened for low volatility, high-yield blue-chips that you can trust even in the most terrifying market crashes.
- Reasonable buy or good buy (never knowingly overpay for a company): 299 companies remain
- yield 4+% (high-yield ETFs yield about 3.7%): 66 companies remain
- dividend safety score 81%+ (very safe, 2% or less risk of a dividend cut in a severe recession): 36 companies remain
- quality score 80+% (Super SWAN, sleep well at night, quality or better): 32 companies remain
- consensus long-term return potential 8+% (good rule of thumb for defensive companies): 30 companies remain
- time: 2 minutes
The 30 companies that remain have an average yield of 5.4% and 12.5% CAGR long-term return potential.
But now, let’s screen for low volatility.
- add 15-year average annual volatility column
- sort by lowest to highest volatility
- select the lowest volatility blue-chip in each sector (the first eight sectors)
Finally, use the watchlist construction tool to build a watchlist of just these eight companies.
6 High-Yield Blue-Chips You’ll Want To Own If The Market Crashes Again
(Sources: Dividend Kings Zen Research Terminal)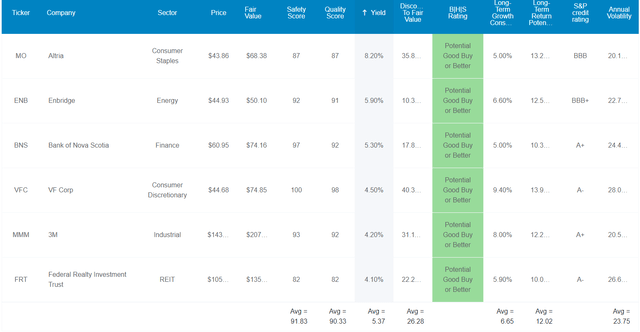
I’ve linked to articles covering each blue-chips long-term investment thesis, growth prospects, risk profile, valuation, and return potential.
Note that BNS and ENB are Canadian companies.
- a 15% dividend tax withholding in taxable accounts
- not in retirement accounts
- a tax credit (with some paperwork) can recoup the dividend withholding in taxable accounts
FAST Graphs Up Front
Altria 2024 Consensus Total Return Potential
(Source: FAST Graphs, FactSet Research)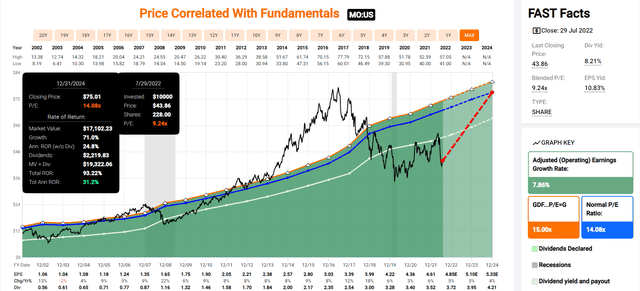
Enbridge 2024 Consensus Total Return Potential
(Source: FAST Graphs, FactSet Research)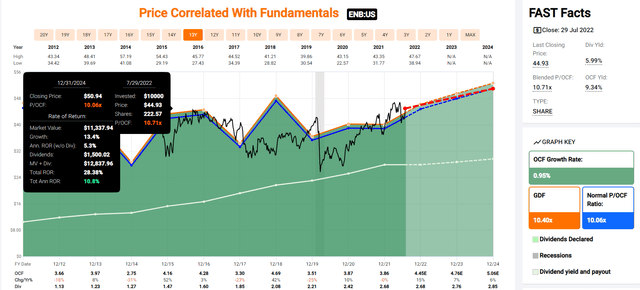
Bank of Nova Scotia 2024 Consensus Total Return Potential
(Source: FAST Graphs, FactSet Research)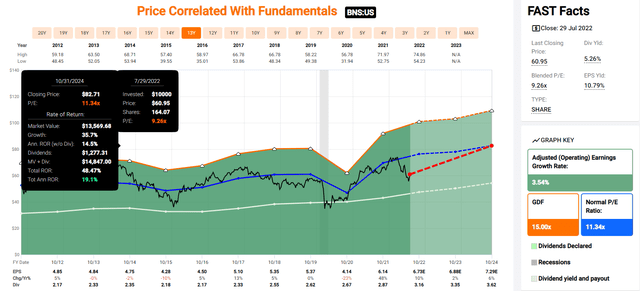
VF Corp 2024 Consensus Total Return Potential
(Source: FAST Graphs, FactSet Research)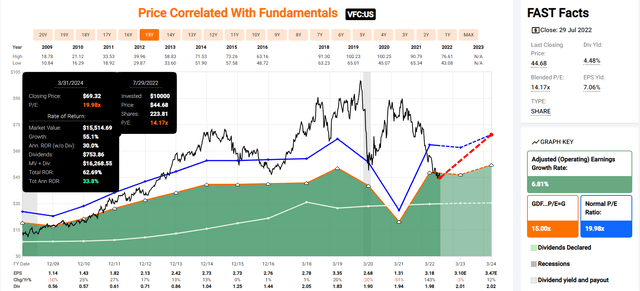
3M 2024 Consensus Total Return Potential
(Source: FAST Graphs, FactSet Research)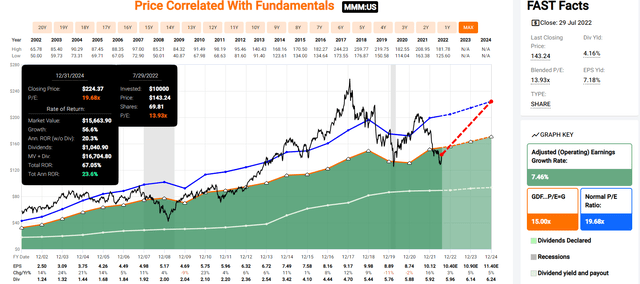
Federal Realty Investment Trust 2024 Consensus Total Return Potential
(Source: FAST Graphs, FactSet Research)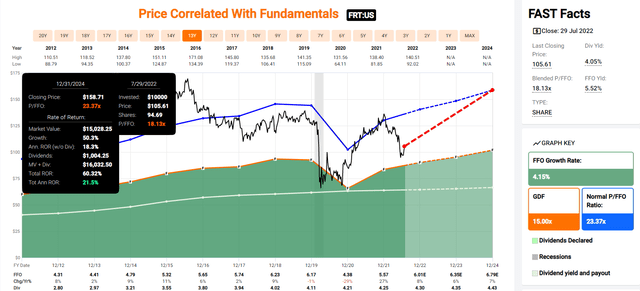
Now compare these analyst forecasts to the S&P 500’s consensus return potential.
S&P 2024 Consensus Total Return Potential
(Source: FAST Graphs, FactSet Research)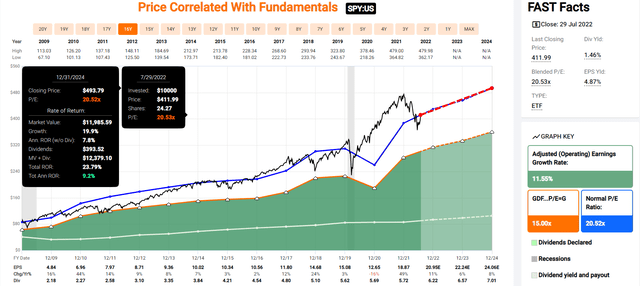
Analysts expect the S&P to deliver about 9% annual returns through 2024, a decent return from close to its historical fair value.
These high-yield low volatility blue-chips? 24% annual returns.
- 71% average total returns through 2024
- about 3X more than the S&P 500
- Buffett-like 24% annual return potential from high-yield blue-chip bargains hiding in plain sight
Quality And Safety You Can Trust In Any Market Crash
(Sources: Dividend Kings Zen Research Terminal)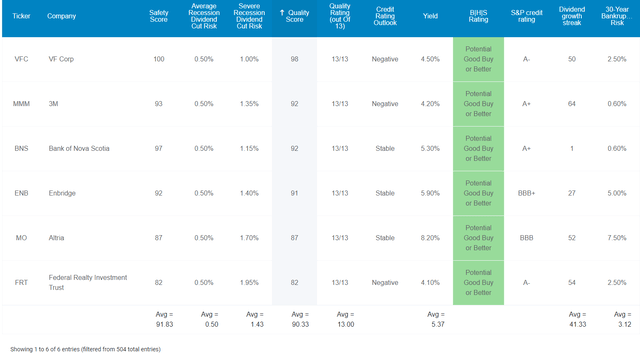
These aren’t just blue-chips they are 13/13 Ultra SWANs (sleep well at night) as close to perfect quality dividend growth stocks as on Wall Street. For proof let’s compare them to the dividend aristocrats.
Higher Quality Than The Dividend Aristocrats
| Metric | Dividend Aristocrats | 5% Yielding Low Volatility Blue-Chips | Winner Dividend Aristocrats |
Winner 5% Yielding Low Volatility Blue-Chips |
| Quality | 87% | 90% | 1 | |
| Safety | 90% | 92% | 1 | |
| Average Recession Dividend Cut Risk | 0.5% | 0.5% | 1 | 1 |
| Severe Recession Dividend Cut Risk | 1.5% | 1.4% | 1 | |
| Dependability | 84% | 91% | 1 | |
| Dividend Growth Streak (Years) | 44.8 | 41.3 | 1 | |
| Long-Term Risk Management Industry Percentile | 67% Above-Average | 73% Good | 1 | |
| Average Credit Rating | A- Stable | A- Stable | 1 | 1 |
| Average Bankruptcy Risk | 3.04% | 3.12% | 1 | |
| Average Return On Capital | 88% | 279% | 1 | |
| Average ROC Industry Percentile | 69% | 89% | 1 | |
| 13-Year Median ROC | 74% | 172% | 1 | |
| Forward PE | 20.0 | 12.2 | 1 | |
| Discount To Fair Value | 0.0% | 26.0% | 1 | |
| DK Rating | Reasonable Buy | Very Strong Buy | 1 | |
| Yield | 2.4% | 5.4% | 1 | |
| LT Growth Consensus | 8.7% | 6.7% | 1 | |
| Total Return Potential | 11.1% | 12.0% | 1 | |
| Risk-Adjusted Expected Return | 7.5% | 8.2% | 1 | |
| Inflation & Risk-Adjusted Expected Return | 5.1% | 5.7% | 1 | |
| Conservative Years To Double | 14.2 | 12.7 | 1 | |
| Total | 5 | 18 |
(Source: DK Zen Research Terminal)
Across almost every qualitative and quantitative measure of safety, quality, and dependability these 5% yielding Ultra SWANs beat the bluest of blue-chips.
Ben Graham considered a 20+ year dividend growth streak an important sign of excellent quality. These 5% yielding Ultra SWANs average a 41-year dividend growth streak, more than 2X the Graham standard of excellent.
Joel Greenblatt considers return on capital, or ROC, his gold standard proxy for quality and moatiness.
- ROC = annual pre-tax profit/the cost of running the business
The S&P 500’s ROC is 14.6%. The aristocrats an incredible 88%. These 5% yielding Ultra SWANs a mind-blowing 279%.
- more than 3X better than the aristocrats
- 19X better than the S&P 500
The aristocrat’s average ROC in the 69th industry percentile, these 5% yielding Ultra SWANs 89th percentile.
In the last 13 years, the median ROC of the aristocrats was an impressive 74%, but these 5% yielding Ultra SWANs delivered 172%.
S&P estimates the average 30-year bankruptcy risk of an aristocrats is 3%, an A-stable credit rating.
The average rating of these 5% yielding Ultra SWANs is A-stable with a 3.1% bankruptcy risk.
6 rating agencies estimate the aristocrats LT risk-management is in the 67th industry percentile, these 5% yielding Ultra SWANs in the 73rd percentile.
Risk-Management You Can Trust In All Market Crashes
| Classification | Average Consensus LT Risk-Management Industry Percentile |
Risk-Management Rating |
| S&P Global (SPGI) #1 Risk Management In The Master List | 94 | Exceptional |
| Strong ESG Stocks | 78 |
Good – Bordering On Very Good |
| Foreign Dividend Stocks | 75 | Good |
| 5% Yielding Low Volatility Blue-Chips | 73 | Good |
| Ultra SWANs | 71 | Good |
| Low Volatility Stocks | 68 | Above-Average |
| Dividend Aristocrats | 67 | Above-Average |
| Dividend Kings | 63 | Above-Average |
| Master List average | 62 | Above-Average |
| Polaris | 61 | Above-Average |
| Hyper-Growth stocks | 61 | Above-Average |
| Monthly Dividend Stocks | 60 | Above-Average |
| Dividend Champions | 57 | Average bordering on above-average |
(Source: DK Research Terminal)
An aristocrat’s average risk of a dividend cut in a typical recession since WWII is about 0.5%. It’s also about 0.5% for these 5% yielding Ultra SWANs.
The risk in a severe recession, like the GFC or Pandemic? 1.5% for aristocrats, 1.4% for these Ultra SWANs.
OK, now that you understand why these 5.4% yielding Ultra SWANs represent some of the safest high-yield on Wall Street, here’s why you might want to buy them today.
Wonderful Companies At Wonderful Prices
(Source: Dividend Kings Zen Research Terminal)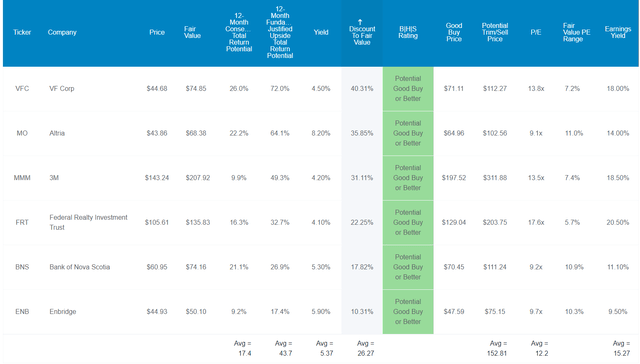
The S&P 500 trades at 17.5X earnings or a 4% historical premium.
The aristocrats trade at 20X earnings, or historical fair value.
These 5% yielding Ultra SWANs trade at 12.2X earnings, a 26% historical discount.
Analysts expect them to deliver 17% total returns within 12 months… even with a recession potentially starting within six months!
They are so undervalued that their fundamentally justified 12-month total return potential is 44%.
- if each of them grew as expected over the next year and returned to historical, market-determined fair value you would make 44% total returns
But my goal isn’t to help you achieve a 17% total return within a year or even a 44% return. I aim to help you achieve 15X inflation-adjusted returns over the next 30 years with some of the highest quality and safest low volatility blue-chips on earth.
Total Return Potential That Can Help You Retire In Safety And Splendor
(Source: Dividend Kings Zen Research Terminal)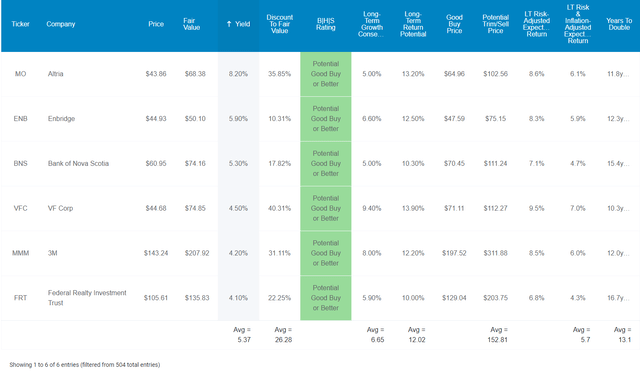
These 5% yielding Ultra SWANs offer one of the world’s safest 5.4% yields AND are growing at 6.7%, with analysts expecting about 12% long-term returns.
- about 1% more than the 2.4% yielding dividend aristocrats
- about 2% more than the 1.7% yielding S&P 500
Think that 1% or 2% better returns don’t matter? Over a 30-year retirement time frame, it can matter quite a bit.
Inflation-Adjusted Consensus Total Return Potential: $510,000 Average Retired Couple’s Saving Initial Investment
| Time Frame (Years) | 7.7% CAGR Inflation-Adjusted S&P Consensus | 8.6% Inflation-Adjusted Aristocrat Consensus | 9.5% CAGR Inflation-Adjusted 5% Yielding Low Volatility Ultra SWANS Consensus | Difference Between Inflation-Adjusted 5% Yielding Low Volatility Ultra SWANS Consensus And S&P Consensus |
| 5 | $740,037.07 | $771,470.06 | $857,561.79 | $117,524.72 |
| 10 | $1,073,833.07 | $1,166,992.25 | $1,441,984.76 | $368,151.69 |
| 15 | $1,558,188.78 | $1,765,293.28 | $2,424,688.30 | $866,499.52 |
| 20 | $2,261,014.63 | $2,670,335.12 | $4,077,098.12 | $1,816,083.49 |
| 25 | $3,280,852.25 | $4,039,379.57 | $6,855,614.85 | $3,574,762.60 |
| 30 | $4,760,690.75 | $6,110,314.47 | $11,527,673.24 | $6,766,982.49 |
(Source: DK Zen Research Terminal, FactSet)
Over a 30-year retirement time frame, analysts think these 5% yielding Ultra SWANs can deliver 15X inflation-adjusted returns. And for the average retired couple, that could mean an extra $6.8 million in inflation-adjusted wealth compared to the S&P 500 and $5.4 million more than the dividend aristocrats.
| Time Frame (Years) | Ratio Aristocrats/S&P Consensus | Ratio Inflation-Adjusted 5% Yielding Low Volatility Ultra SWANS Consensus vs. S&P consensus |
| 5 | 1.04 | 1.16 |
| 10 | 1.09 | 1.34 |
| 15 | 1.13 | 1.56 |
| 20 | 1.18 | 1.80 |
| 25 | 1.23 | 2.09 |
| 30 | 1.28 | 2.42 |
(Source: DK Zen Research Terminal, FactSet)
That’s because 2% higher annual returns over 30 years means 142% higher returns, and 1% higher returns is 89% more inflation-adjusted wealth.
OK, these are some very impressive 5.4% yielding blue-chips, but what evidence is there that they can deliver lower volatility during most market downturns AND 12% long-term returns?
Historical Returns Since April 1995 (Equal Weight, Annual Rebalancing)
The future doesn’t repeat, but it often rhymes.” – Mark Twain
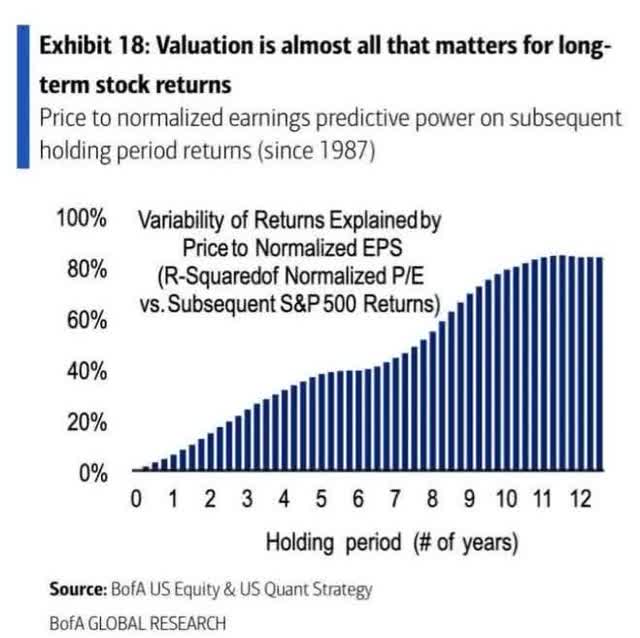
Past performance is no guarantee of future results. Still, studies show that blue-chips with relatively stable fundamentals over time offer predictable returns based on yield, growth, and valuation mean reversion.
So let’s look at how these 5% yielding Ultra SWANs performed over the last 27 years when about 95% of total returns were the result of fundamentals, not luck.
(Source: Portfolio Visualizer Premium)
These 5% yielding Ultra SWANs delivered 13.6% annual returns over the last 27 years, with slightly less volatility than the S&P 500. The largest decline was in the Great Recession at 38%, while the market was cut in half.
- 52% better negative volatility-adjusted returns than the market (Sortino ratio)
(Source: Portfolio Visualizer Premium)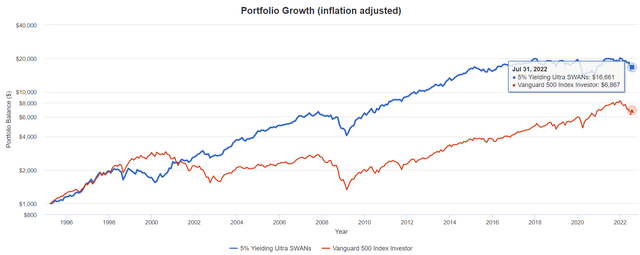
In the next 25 years, analysts expect 13.4X inflation-adjusted returns; over the last 27, they returned 17X.
- almost 3X more than the S&P 500
(Source: Portfolio Visualizer Premium)
For 27 years, they delivered about 2X the market’s average rolling return.
(Source: Portfolio Visualizer Premium)
For 27 years, they generally offered smaller declines in most corrections, but especially the largest market crashes.
(Source: Portfolio Visualizer Premium)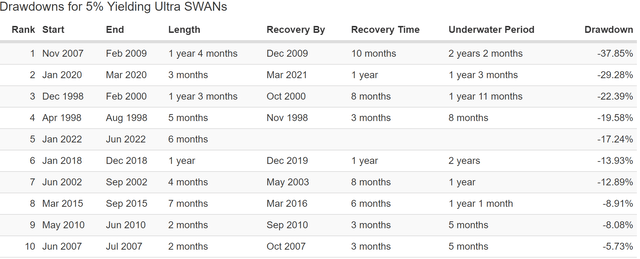
(Source: Portfolio Visualizer Premium)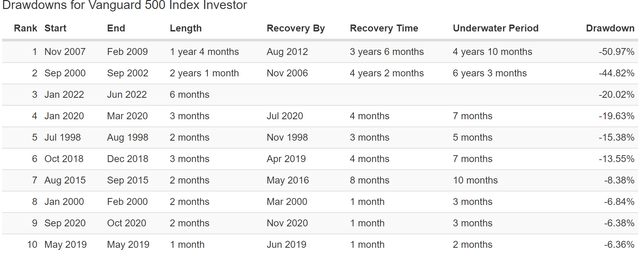
In the bear market of 2022, they have fallen 17%, 15% less than the S&P 500.
Strong And Dependable Income Growth In All Market Conditions
2007 and 2008 were MO’s spin-offs ((Source: Portfolio Visualizer Premium))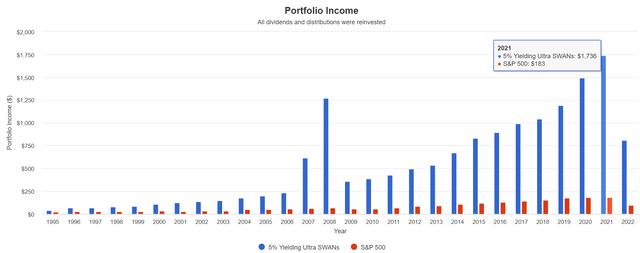
Impressive dividend growth on top of great returns
| Portfolio | 1996 Income Per $1000 Investment | 2021 Income Per $1000 Investment | Annual Income Growth | Starting Yield |
2021 Yield On Cost |
| S&P 500 | $28 | $183 | 7.80% | 2.8% | 18.3% |
| 5% Yielding Ultra SWANs | $67 | $1,736 | 13.90% | 6.7% | 173.6% |
(Source: Portfolio Visualizer Premium)
These 5% yielding Ultra SWAns delivered nearly 2X the market’s annual income growth for the past quarter century.
- 10X more annual income after 25 years
- a 174% yield on cost in 2021
Future Income Growth Consensus
| Analyst Consensus Income Growth Forecast | Risk-Adjusted Expected Income Growth | Risk And Tax-Adjusted Expected Income Growth |
Risk, Inflation, And Tax Adjusted Income Growth Consensus |
| 12.3% | 8.6% | 7.3% | 4.7% |
(Source: Portfolio Visualizer Premium)
Analysts expect 12.3% long-term income growth in the future, which, adjusted for the risk of these companies not growing as expected, inflation, and taxes is almost 5% real expected income growth.
Now compare that to what they expect from the S&P 500.
| Time Frame | S&P Inflation-Adjusted Dividend Growth | S&P Inflation-Adjusted Earnings Growth |
| 1871-2021 | 1.6% | 2.1% |
| 1945-2021 | 2.4% | 3.5% |
| 1981-2021 (Modern Falling Rate Era) | 2.8% | 3.8% |
| 2008-2021 (Modern Low Rate Era) | 3.5% | 6.2% |
| FactSet Future Consensus | 2.0% | 5.2% |
(Sources: S&P, FactSet, Multipl.com)
- 1.7% post-tax inflation-adjusted income growth from the S&P 500
- S&P 500’s historical post-tax inflation-adjusted income growth rate (current tax code) is 5.8% CAGR
What about a 60/40 retirement portfolio?
- 0.5% consensus inflation, risk, and tax-adjusted income growth.
In other words, these aristocrats are expected to potentially generate about 3X faster real income growth than the S&P 500 and 9.5X faster income growth than a 60/40.
- and 3X the yield of the S&P 500 and 60/40 and a safer yield at that
OK, this is incredible, BUT what if 15% lower volatility than the market just isn’t good enough for you? What if you simply can’t handle a 20% bear market, even in severe recessions?
How To Turn These Ultra SWANs Into The Ultimate Bear-Market Resistant Bunker Retirement Portfolio
In his great book “Just Keep Buying,” Nick Maggiulli, the chief data scientist for Ritholtz Wealth Managment, shows why a 33% bond allocation is historically the optimal way to minimize declines in bear markets and maximize long-term returns.
My research has concluded that a 67%/33% portfolio, not much different than the 60/40 gold standard pioneered in 1994, is a long-term recession-optimized portfolio.
(Source: Portfolio Visualizer Premium)
Here is an example of a prudently risk-managed portfolio diversified across six sectors.
How does adding 33% long-bonds help you sleep well at night in recessions and bear markets?
Historical Returns Since August 2002 (Annual Rebalancing)
(Source: Portfolio Visualizer Premium)
Over the last 20 years, the 60/40 delivered 7.7% annual returns with 9.3% annual volatility and a peak decline of 33% during the Great Recession.
A 67/33 portfolio of these 5% yielding Ultra SWANs delivered 10.6% annual returns with 9.7% annual volatility and a less than 20% decline in the Great Recession.
- It also beat the S&P 500 but with a 60% smaller decline during the Great Recession.
This means:
- 25% better negative volatility-adjusted total returns than the Ultra SWANs on their own
- 41% better than a 60/40
- 62% better than the S&P 500
(Source: Portfolio Visualizer Premium)
The worst 12-month return was -17%, 11% less than a 60/40.
The average 15-year rolling return was 11.3%, slightly more than the S&P 500 but with 35% lower annual volatility.
What about actual bear markets?
(Source: Portfolio Visualizer Premium)
The Pandemic didn’t cause one, and neither did the Great Recession.
(Source: Portfolio Visualizer Premium)
Yes, the worst bond bear market since 1788 did cause a peak decline of about 19% in 2022, but unless you think such things will occur in every recession, this is a pretty solid asset allocation.
- three corrections in 20 years
- zero bear markets
How likely is this portfolio to avoid a bear market in the future?
75-Year Monte Carlo Simulation: Stress Testing The Future
- 5.4% annual withdrawal rate (starting dividend yield)
- $510K average retired couple’s savings at age 65
- post-tax returns (highest tax bracket)
(Source: Portfolio Visualizer Premium)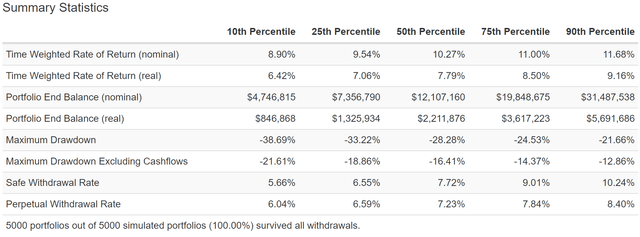
Excluding the annual withdrawals, there is a 90% probability this portfolio never falls more than 22% over the next 75 years.
Source: Portfolio Visualizer Premium)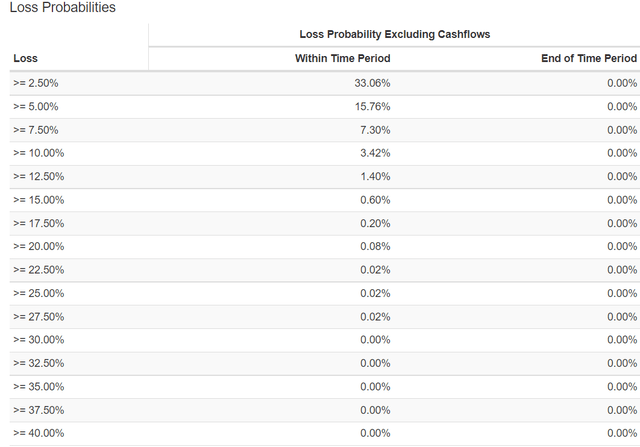
There is a 99.84% probability this portfolio never experiences a bear market over the next 75 years.
Source: Portfolio Visualizer Premium)
The 60/40s’ historical inflation-adjusted return is 5.1% CAGR. The probability that this portfolio matches a 60/40 over the next 30 years is 95%, and over the next 50 years, 98%.
Much higher yield? Higher returns? Lower volatility… especially when the market crashes hardest? And a 99.84% probability of never experiencing a bear market within your lifetime?
Now that’s what I call an Ultra Sleep Well At Night Retirement portfolio.
Bottom Line: Whether The Next Market Crash Starts Tomorrow Or In 10 Years, High-Yield Low Volatility Blue-Chips Can Help You Retire In Safety And Splendor
Has inflation already peaked as the blue-chip consensus believes? Or is Research Affiliates right, and CPI might not peak until early 2023 in the double-digits?
Are we headed for a mild recession? A severe recession? No recession at all?
I can’t tell you the answer to those questions, though I can tell you that the idea of the Fed pivoting anytime soon is baseless speculation with zero evidence to support it right now.
But here is what I can say with certainty.
- at some point, the market will crash again
- it’s a matter of “when” not “if”
Is Morgan Stanley right that stocks might fall 20% in August? In the worse month for the market since 1987? It’s possible.
Might the market have already bottomed and just trade sideways for the next year? That’s also possible.
How important is it that you know the answers to these questions? Not at all important.
Nobody can predict interest rates, the future direction of the economy or the stock market. Dismiss all such forecasts and concentrate on what’s actually happening to the companies in which you’ve invested. — Peter Lynch
As long as you own quality companies, bought at reasonable to attractive valuations, and own them within a diversified and prudently risk-managed portfolio, you have nothing to fear from even the scariest market crashes.
I can say that with 80% confidence about MO, MMM, ENB, BNS, FRT, and VFC, six 5% yielding Ultra SWANs.
- 5.4% very safe yield (more than 3X the market’s yield)
- A-credit rating (3.1% average fundamental risk)
- higher quality and profitability than the dividend aristocrats
- 73rd industry percentile long-term risk management
- 6.6% long-term growth consensus
- 12.0% CAGR long-term return potential, similar to the returns of the last 27 years
In most downturns, these 5% yielding Ultra SWANs fall less than the market. If you add in a prudent allocation of bonds, they fall less in every downturn.
- not even a bear market during the Great Recession
- 99.84% likely to never suffer a bear market in the next 75 years
Over decades market timing is one of the most dangerous things you can try while buying and holding the world’s best income-producing assets as close to a guarantee of success as exists on Wall Street.
- 98% probability in this case
The simple fact is that we’re not machines; we’re not blessed with pure Vulcan-like logic. Most of us will panic if the market falls 20% in a few weeks.
Many of us will panic, sell and turn paper losses into permanent ones. And then when the market invariably roars higher (as it did in July) we’ll sit in cash and “wait for the dust to settle”.
How long could we wait? Some people sold out of the market in 2008 and have sat in cash since.
- While stocks delivered 16% annual returns, a 4.4X gain
- and inflation was 40%
- half of that in the last two years
Inflation is pretty much a guarantee, so are blue-chips going up over time. So are bear markets. These are the facts of life on Wall Street.
But if you know what to expect, you can be emotionally and financially prepared for anything the market or economy throws at us. Not just in the next month or year, but during the coming decades.
And when you can say with 98% statistical certainty that your portfolio is likely to help you retire in safety and splendor? Then you truly achieve financial independence.
Do you know the secret of high-yield blue-chip portfolios like this one? If you are earning a very safe and steadily growing 5.4% yield today, what happens with stock prices tomorrow…. or ever, doesn’t matter as much.
If you can live entirely off safe and growing income, you can safely ignore the market’s short-term volatility and likely retire rich and grow steadily richer in retirement.


Be the first to comment