

anton5146
This article was coproduced with Dividend Sensei.
2022 was a crazy year for investors. We saw the highest inflation in 42 years, soaring interest rates, and a meltdown in the UK.
The year ended with the S&P down 18%, bonds down 14%, and UK stocks flat.
It was the only year in U.S. market history when both stocks and bonds fell double-digits, and 2023 is likely to be just as exciting a year.
That’s because the most anticipated and possibly the mildest recession in history could cause stocks to fall 5% to 24% in the coming weeks.
That’s likely to be followed by a brand new bull market that could generate face-ripping rallies and life-changing returns in coming years.
What’s a smart high-yield income investor to do when we face such a bipolar year? How can you stay safe, sane, and rolling in dividends in the face of such uncertainty?
By focusing on industry-leading ultra-yield blue-chips like Healthcare Realty Trust Incorporated (NYSE:HR), which I just recommended for Dividend King’s members.
Let me show you the many reasons why HR is one of the best options for SWAN (sleep well at night) investors looking to lock in amazing yield today and potentially Buffett-like returns for the next few years.
The Mack Daddy of Hospital REITs
2023 is likely to be a year with a mild recession, and stocks aren’t likely to start the year off strong.
S&P Bear Market Bottom Forecast Range
|
Earnings Decline In 2023 |
2023 S&P Earnings |
X 25-Year Average PE Of 16.7 |
Decline From Current Level |
|
0% |
$218.46 |
$3,648.28 |
5.0% |
|
5% |
$207.54 |
$3,465.87 |
9.7% |
|
10% |
$196.61 |
$3,283.45 |
14.5% |
|
13% (Historically average/median EPS decline) |
$190.06 |
$3,174.01 |
17.3% |
|
15% |
$185.69 |
$3,101.04 |
19.2% |
|
20% |
$174.77 |
$2,918.63 |
24.0% |
(Source: DK S&P 500 Valuation Tool)
The good news is that the recession is currently expected to be the mildest recession in U.S. history, with a 0.1% GDP decline in Q1 and Q2.
The bad news? Economists historically underestimate recessions, and that means the downturn is likely to be worse than expected, though still likely mild. That means a 5% to 10% S&P decline in the first few months of 2023 is the bullish case for stocks, and a 20% decline could occur since earnings estimates are likely still too high.
But this is where a deeply undervalued blue-chip medical office building or MOB (medical office building) REIT (real estate investment trust) is a potentially great investment for the year’s first half.
Especially one that yields a relatively safe 6.4% yield that will pay you to wait out what could be a very painful start to the year.
Why do I like Healthcare Realty Trust as an ultra-yield defensive option for 2023?
Why I Like Healthcare Realty And You Might Too
Healthcare Realty was founded in 1992 in Nashville, Tennessee.
Healthcare Realty owns a highly diversified portfolio of 728 hospitals in 35 states and manages hundreds more for institutional clients.
In 2022 its shareholders approved a merger with HTA that created the largest MOB REIT in America.
About 70% of its hospitals are located on college campuses, connected to university health systems.
Its biggest investments are located in some of the biggest, richest, and most thriving U.S. cities, such as Dallas, Seattle, Houston, LA, Atlanta, Boston, Charlotte, Denver, Miami, and Phoenix.
82% of its properties are multi-tenant, providing cash flow diversification.
And if you want a recession-resistant business model? Well, hospitals are about as essential a business as you can find, no matter what the economy is doing.
92% of its properties are medical offices or outpatient facilities, an industry that the work-from-home movement or Pandemic has minimally affected.
Its hospitals are leased to 57 of America’s 100 largest health systems, such as Yale, Baylor, and the University of California.
40% of net operating income comes from its 87-largest tenants, with just 2.5% coming from a tenant without an investment-grade credit rating.
Most of its rent comes from A-rated or AA-rated health systems like the University of Washington or Baylor University.
HR is the most concentrated medical office building REIT in America, with 95% exposure, and the highest concentration of MOBs located on campus with universities.
It’s not just the largest MOB REIT in America, it has the highest exposure to the largest cities.
-
85% of properties in the top 50 cities
-
97% in the top 100 cities.
Its average hospital is located within 10 miles of 814,000 people, the highest population density in the industry and almost 2X the population density of DOC, the other big MOB REIT.
How big an opportunity are MOBs and hospitals?
Here are the facts:
-
$460 billion size (of which REITs own just $60 billion or 13%)
-
$11 billion in annual property sales (what HR buys)
-
$9 to $12 billion in new property developers per year, around 3.6 million square feet
-
35% of that development is undertaken by HR itself
-
HR’s new developments each year are about 4X larger than its next largest rival.
In other words, HR is the industry leader in hospitals and MOBs, with the most scale and all the benefits that come with it.
Demographics are a major tailwind for HR’s growth because of the rapidly aging population of the U.S.
-
The average American under 45 generates $4,300 in healthcare spend and visits the doctor twice a year
-
the average American over the age of 65 visits the doctor six times per year and generates $19,100 in annual spending.
Older people visit the doctor 3X as often and generate almost 5X more healthcare spending as young people.
And unlike SNFs (skilled nursing facilities), which no one wants to go to, outpatient visits have been soaring steadily for the last 30 years and are going to keep rising.
-
people will fight tooth and nail to not end up “in a home”
-
but will happily go to the doctor’s office as many times as they need to.
Almost 50% of all doctors now work in hospitals or outpatient clinics, like the ones that HR owns.
HR has a $2.1 billion growth backlog, including over $500 million in projects expected to be completed by 2024.
It has a BBB stable credit rating from S&P, including over $1 billion in liquidity, 2X what it needs to complete its current growth projects.
100% of its debt is unsecured, and none matures before 2024, so there are no recession debt maturities.
Its leverage ratio of 6.3X net debt/EBITDA is in-line with the 6.5X safety guideline for an industry with long-term contracts, and that’s incredibly recession-resistant.
-
management’s policy is to keep leverage at 6X to 6.5X, a safe range according to S&P and Moody’s.
Its average interest cost is 3.2%, compared to cash flow yields of 6.5% to 11% depending on the project.
Its balance sheet is nowhere close to violating any of its debt covenants. For example:
-
Interest coverage ratio 4.2X vs. 1.5X covenant (and rating agency safety guideline)
-
debt/equity of 39% vs. 60% or less covenant (and rating agency safety guideline).
In other words, HR has a strong balance sheet and plenty of access to low-cost growth capital to achieve its goals. Which isn’t limited to just building or improving new or existing properties.
In the first nine months of 2022, HR bought $428 million worth of new properties, a total of 30, at an average cash flow yield of 5.3%. Cash flow yields have been rising steadily as interest rates rise and are expected to increase a bit more in 2023 on acquired properties.
In Q3 alone, it bought eight properties for $91 million, with 98% of those properties already leased under long-term contracts.
The average lease is for 55 months or about 4.5 years. But tenants almost always renew leases because patients hate finding new doctor’s offices.
-
location, location, location is the most important part of real estate
-
doubly so for healthcare.
That’s why HR’s retention rates are 80%.
Reasons To Potentially Buy Healthcare Trust Of America
|
Metric |
Healthcare Trust Of America |
|
Quality |
79% 10/13 Blue-Chip Quality MOB REIT |
|
Risk Rating |
Medium Risk |
|
DK Master List Quality Ranking (Out Of 500 Companies) |
354 |
|
DK Master List Quality Percentile |
30% |
|
Dividend Growth Streak (Years) |
2 |
|
Dividend Yield |
6.4% |
|
Dividend Safety Score |
79% |
|
Average Recession Dividend Cut Risk |
1.0% |
|
Severe Recession Dividend Cut Risk |
2.20% |
|
S&P Credit Rating |
BBB Stable Outlook |
|
30-Year Bankruptcy Risk |
7.5% |
|
LT S&P Risk-Management Global Percentile |
33% Below-Average, Medium Risk |
|
Fair Value |
$30.25 |
|
Current Price |
$19.27 |
|
Discount To Fair Value |
36% |
|
DK Rating |
Potential Strong Buy |
|
P/FFO |
11.5 |
|
Historical P/FFO |
17.5 to 18 |
|
LT Growth Consensus/Management Guidance |
2.6% |
|
PEG Ratio |
442.31 |
|
5-year consensus total return potential |
13% to 15% CAGR |
|
Base Case 5-year consensus return potential |
14% CAGR (About 2X The S&P 500) |
|
Consensus 12-month total return forecast |
30% |
|
Fundamentally Justified 12-Month Return Potential |
63% |
|
LT Consensus Total Return Potential |
9.0% |
|
Inflation-Adjusted Consensus LT Return Potential |
6.6% |
(Source: Dividend Kings Zen Research Terminal.)
HR isn’t a fast-growing REIT, but it’s currently so undervalued that it could deliver very good returns over the next five years while paying a safe 6.4% from day one.
-
36% historically undervalued
-
11.5X FFO (funds from operations).
Healthcare Realty 2025 Consensus Return Potential
FAST Graphs, FactSet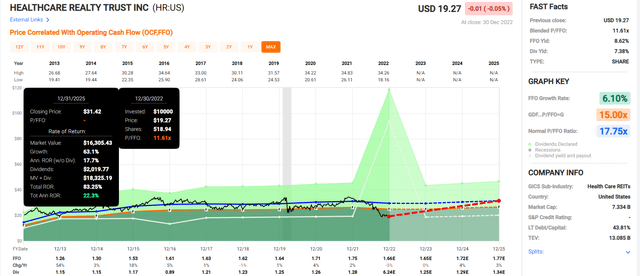
If HR grows as expected and returns to historical fair value by 2025, it could almost double, delivering Buffett-like 22% annual returns.
-
about 2.5X more than the S&P consensus.
Healthcare Realty 2028 Consensus Return Potential
FAST Graphs, FactSet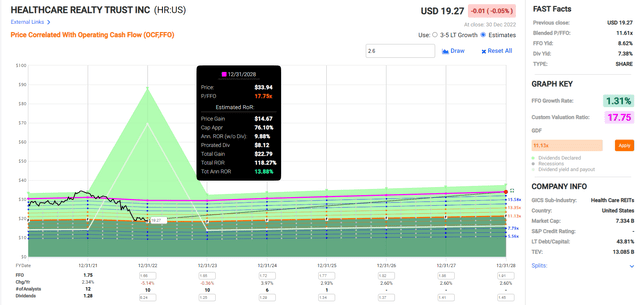
If HR grows as expected and returns to historical fair value by 2028, it could deliver almost 120% total returns, or 14% annually.
-
about 2X more than the S&P 500 consensus.
That is not bad from a slow-growing defensive REIT.
Healthcare Realty Investment Decision Score
Dividend Kings Automated Investment Decision Tool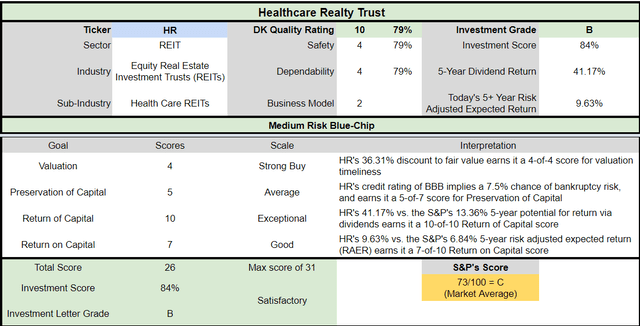
HR is a potentially good high-yield opportunity for anyone comfortable with its risk profile. Look at how it compares to the S&P 500 Index (SP500).
-
36% discount to fair value vs. 4% premium S&P = 40% better valuation
-
6.4% safe yield vs. 1.8% (3X higher and safer)
-
approximately 9.0% long-term annual return potential vs. 10.2% CAGR S&P
-
about 50% higher risk-adjusted expected returns
-
3X higher income potential over five years.
Slow But Steady Growth Prospects For Decades To Come
HR fell 36% in 2022, not for any fundamental reasons but likely because of the large increase in interest rates. This creates a strong 2023 buying opportunity because its growth outlook remains strong.
HR Medium-Term Growth Consensus
|
Metric |
2022 Growth Consensus |
2023 Growth Consensus |
2024 Growth Consensus |
2025 Growth Consensus |
|
Sales |
23% |
50% |
2% |
NA |
|
Dividend |
3% |
1% |
2% |
NA |
|
FFO |
-5% |
0% |
4% |
3% |
|
AFFO |
3% |
1% |
12% |
11% |
|
EBITDA |
-34% |
58% |
5% |
-2% |
|
EBIT (operating income) |
-56% |
85% |
9% |
-11% |
(Source: FAST Graphs, FactSet.)
In a year when the S&P’s earnings might fall a much as 20%, HR’s recession-resistant business model is expected to generate flat results, followed by a strong growth year in 2024 as new growth projects come online.
Long-Term Growth Outlook
The long-term analyst consensus for HR isn’t very exciting, with just 2.6% long-term cash flow per share growth.
Why is HR expected to grow so slowly? Because, like most REITs, it funds around 40% of its growth by selling new stock. Thus, while the sales growth is impressive (due to the HTA merger), the cash flow per share growth is modest.
Within a reasonable margin of error, HR’s very stable business model doesn’t miss expectations.
Its historical analyst margins of error are 10% to the downside and 5% to the upside.
-
2% to 3% margin-of-error-adjusted growth consensus range.
HR’s historical growth rate is around 2% to 4%, so I consider 2.6% a reasonable long-term growth estimate.
Long-Term Consensus Return Potential
|
Investment Strategy |
Yield |
LT Consensus Growth |
LT Consensus Total Return Potential |
Long-Term Risk-Adjusted Expected Return |
|
Healthcare Realty |
6.4% |
2.6% |
9.0% |
6.3% |
|
REITs |
3.9% |
6.1% |
10.0% |
7.0% |
|
Schwab US Dividend Equity ETF |
3.4% |
7.6% |
11.0% |
7.7% |
|
Vanguard Dividend Appreciation ETF |
1.9% |
10.2% |
12.1% |
8.5% |
|
Dividend Aristocrats |
1.9% |
8.5% |
10.4% |
7.3% |
|
S&P 500 |
1.8% |
8.5% |
10.3% |
7.2% |
|
Nasdaq |
0.8% |
10.9% |
11.7% |
8.2% |
(Source: DK Research Terminal, FactSet, Morningstar, Ycharts.)
HR is a potentially great combination of ultra-yield today and solid 9% defensive returns over the long term.
HR’s historical 12-month rolling return over the last decade was 9.0%, slightly better than the REIT sector’s 8.7%.
Investors can expect a reasonable long-term return from this slow-growing but highly defensive 6.4% yielding REIT.
A Wonderful REIT At A Wonderful Price
Millions of income investors have paid between 17.5X and 18X FFO for HR outside of bear markets and bubbles for ten years.
-
90% statistical probability that this approximates intrinsic value
|
Metric |
Historical Fair Value Multiples (all Years) |
2022 |
2023 |
2024 |
2025 |
12-Month Forward Fair Value |
|
5-Year Average Yield |
3.99% |
$31.08 |
$31.08 |
$31.08 |
NA |
|
|
13-year median yield |
4.15% |
$29.88 |
$29.88 |
$29.88 |
NA |
|
|
P/FFO |
17.75 |
$29.82 |
$29.82 |
$30.89 |
$31.42 |
|
|
Average |
$29.82 |
$30.25 |
$30.60 |
$31.42 |
$30.25 |
|
|
Current Price |
$19.27 |
|||||
|
Discount To Fair Value |
35.38% |
36.29% |
37.04% |
38.66% |
36.31% |
|
|
Upside To Fair Value (including dividend) |
54.75% |
56.97% |
58.82% |
63.04% |
63.44% |
|
|
2023 FFO |
2024 FFO |
2022 Weighted FFO |
2023 Weighted FFO |
12-Month Forward FFO |
Historical Average Fair Value Forward P/FFO |
Current Forward P/FFO |
|
$1.68 |
$1.74 |
$1.65 |
$0.03 |
$1.68 |
18.0 |
11.5 |
Historically HR trades at 18X cash flow, and today, it’s trading at 11.5X, a 36% historical discount offering 63% upside potential to fair value.
|
Rating |
Margin Of Safety For Medium-Risk 10/13 Blue-Chip Quality Companies |
2023 Fair Value Price |
2024 Fair Value Price |
12-Month Forward Fair Value |
|
Potentially Reasonable Buy |
0% |
$30.25 |
$30.60 |
$30.25 |
|
Potentially Good Buy |
20% |
$24.20 |
$24.48 |
$24.20 |
|
Potentially Strong Buy |
30% |
$21.17 |
$21.42 |
$21.18 |
|
Potentially Very Strong Buy |
40% |
$14.52 |
$18.36 |
$18.15 |
|
Potentially Ultra-Value Buy |
50% |
$15.12 |
$15.30 |
$15.13 |
|
Currently |
$19.27 |
36.29% |
37.04% |
36.31% |
|
Upside To Fair Value (Including Dividends) |
63.40% |
65.26% |
63.44% |
HR is a potentially strong buy for anyone comfortable with its risk profile.
Risk Profile: Why Healthcare Realty Isn’t For Everyone
There are no risk-free companies, and no company is right for everyone. You have to be comfortable with the fundamental risk profile.
HR’s Risk Profile Includes (15 Pages in the 10K)
-
stock price risk: if the share price falls too low for too long, the highest cost of capital could slow
-
inflation risk (3% leases are tied to CPI)
-
regulatory risk (state, federal, and local): rising healthcare costs could spur significant changes to how doctors and hospitals are reimbursed in the future
-
project execution risk: completing projects on time and on budget
-
ground leases (on about 20% of its properties) limit its ability to sell those properties
-
Black Swan credit condition risk: If the financial markets slam shut (like in 2008), then HR’s access to low-cost liquidity could slam shut as well
-
weather risk: things like hurricanes or storms can damage their properties (though they are insured)
-
tenant risk: some of its tenants (less than 10%) are junk bond rated, and in bankruptcies, rent payments could be postponed or not come in at all
-
releasing risk: HR owns specialized properties that take time to find new tenants when one of them fails
How do we quantify, monitor, and track such a complex risk profile? By doing what big institutions do.
Long-Term Risk Management Analysis: How Large Institutions Measure Total Risk Management
DK uses S&P Global’s long-term risk-management ratings for our risk rating.
-
S&P has spent over 20 years perfecting their risk model
-
which is based on over 30 major risk categories, over 130 subcategories, and 1,000 individual metrics
-
50% of metrics are industry specific
-
this risk rating has been included in every credit rating for decades.
The DK risk rating is based on the global percentile of how a company’s risk management compares to 8,000 S&P-rated companies covering 90% of the world’s market cap.
HR scores 33rd Percentile On Global Long-Term Risk Management
S&P’s risk management scores factor in things like:
-
supply chain management
-
crisis management
-
cyber-security
-
privacy protection
-
efficiency
-
R&D efficiency
-
innovation management
-
labor relations
-
talent retention
-
worker training/skills improvement
-
occupational health & safety
-
customer relationship management
-
business ethics
-
climate strategy adaptation
-
sustainable agricultural practices
-
corporate governance
-
brand management.
HR’s Long-Term Risk Management Is The 401st Best In The Master List 20th Percentile In The Master List)
|
Classification |
S&P LT Risk-Management Global Percentile |
Risk-Management Interpretation |
Risk-Management Rating |
|
BTI, ILMN, SIEGY, SPGI, WM, CI, CSCO, WMB, SAP, CL |
100 |
Exceptional (Top 80 companies in the world) |
Very Low Risk |
|
Strong ESG Stocks |
86 |
Very Good |
Very Low Risk |
|
Foreign Dividend Stocks |
77 |
Good, Bordering On Very Good |
Low Risk |
|
Ultra SWANs |
74 |
Good |
Low Risk |
|
Dividend Aristocrats |
67 |
Above-Average (Bordering On Good) |
Low Risk |
|
Low Volatility Stocks |
65 |
Above-Average |
Low Risk |
|
Master List average |
61 |
Above-Average |
Low Risk |
|
Dividend Kings |
60 |
Above-Average |
Low Risk |
|
Hyper-Growth stocks |
59 |
Average, Bordering On Above-Average |
Medium Risk |
|
Dividend Champions |
55 |
Average |
Medium Risk |
|
Monthly Dividend Stocks |
41 |
Average |
Medium Risk |
|
Healthcare Realty |
33 |
Below-Average |
Medium Risk |
(Source: DK Research Terminal.)
HR’s risk-management consensus is in the bottom 20% of the world’s best blue chips and is similar to:
-
Cincinnati Financial (CINF) blue-chip quality dividend aristocrat
-
Camden Property Trust (CPT): Ultra-SWAN quality apartment REIT
-
Apple (AAPL): Ultra SWAN
-
Main Street Capital (MAIN): SWAN quality BDC (business development company)
-
Broadcom (AVGO): Super SWAN quality.
The bottom line is that all companies have risks, and HR is below-average, at managing theirs, according to S&P.
How We Monitor HR’s Risk Profile
-
12 analysts
-
two credit rating agencies
-
14 experts who collectively know this business better than anyone other than management
“When the facts change, I change my mind. What do you do, sir?”
– John Maynard Keynes.
There are no sacred cows at iREIT or Dividend Kings. Wherever the fundamentals lead, we always follow. That’s the essence of disciplined financial science, the math behind retiring rich and staying rich in retirement.
Bottom Line: Buy Healthcare Realty To Take Advantage Of The Bear Market
Let me be clear: I’m NOT calling the bottom in HR (I’m not a market-timer).
Blue-Chip quality does NOT mean “can’t fall hard and fast in a bear market.”
Fundamentals are all that determine safety and quality, and my recommendations.
-
over 30+ years, 97% of stock returns are a function of pure fundamentals, not luck
-
in the short term; luck is 25X as powerful as fundamentals
-
in the long term, fundamentals are 33X as powerful as luck.
While I can’t predict the market in the short term, here’s what I can tell you about HR.
-
the industry leader in medical office businesses and hospitals
-
safe 6.4% yield (3X the S&P yield growing around 2% per year)
-
9.0% long-term return potential (good for a defensive ultra-yield blue-chip)
-
36% historically undervalued
-
11.5X FFO compared to 17.5 to 28X historically
-
120% consensus return potential over the next five years, 14% annually, 2X more than the S&P 500
-
50% more income potential than the S&P over the next five years
-
3X higher income potential than the S&P over the next five years.
Healthcare Realty is a wonderful choice for anyone looking to take advantage of the bear market we’ve already had while protecting themselves from the recession we’re facing now.
It’s the biggest hospital and MOB REIT in America, with a great balance sheet, strong access to capital, and growth opportunities spanning decades.
If you want a recession-resistant REIT, they don’t come much better than HR’s 728 mission-critical properties.
If you want a defensive way to earn 6.4% today while earning solid 9% long-term returns over decades, HR is a potentially wonderful choice.
And if you want to potentially earn Buffett-like 22% annual returns over the three years? Then it’s time to consider this blue-chip bargain hiding in plain sight.
Be the first to comment