

J. Michael Jones
Purpose
This article is the second in a series analyzing current valuations of U.S. banks. The first article focused on 25 Large-Caps. The major finding of this first article is that the large-cap banks are fully priced relative to history, but U.S. Bancorp with its superior Risk-Adjusted Return on Equity, reasonable valuation, and 4% dividend appears worthy of potential investment.
This second article evaluates 50 Mid-Caps that rank in asset size between the 26th and 78th largest U.S. banks as of Q2 2022.
As a reminder, historically September is the best month of the year to buy bank stocks. Thus, my motivation for a comprehensive review of bank stock valuations and opportunities.
Disclosures
Three of the Mid-Caps included in this study are held in my Long Term (>7 years) Buy-and-Hold bank portfolio: Commerce Bancshares Inc. (CBSH), Cullen/Frost Bankers Inc (CFR), and First Interstate BankSystem Inc (FIBK).
These three banks each have outperformed peer banks (see SPDR S&P Regional Banking ETF (KRE)) as the chart below shows over the tenure of my holdings. However, as the chart also shows, only CBSH has outperformed the S&P 500 during the same time.
Reasons for why I have preferred these three banks will become clear in this article.
For readers interested in my past in-depth analyses of these banks, you can find my most recent article on FIBK here and CFR here.
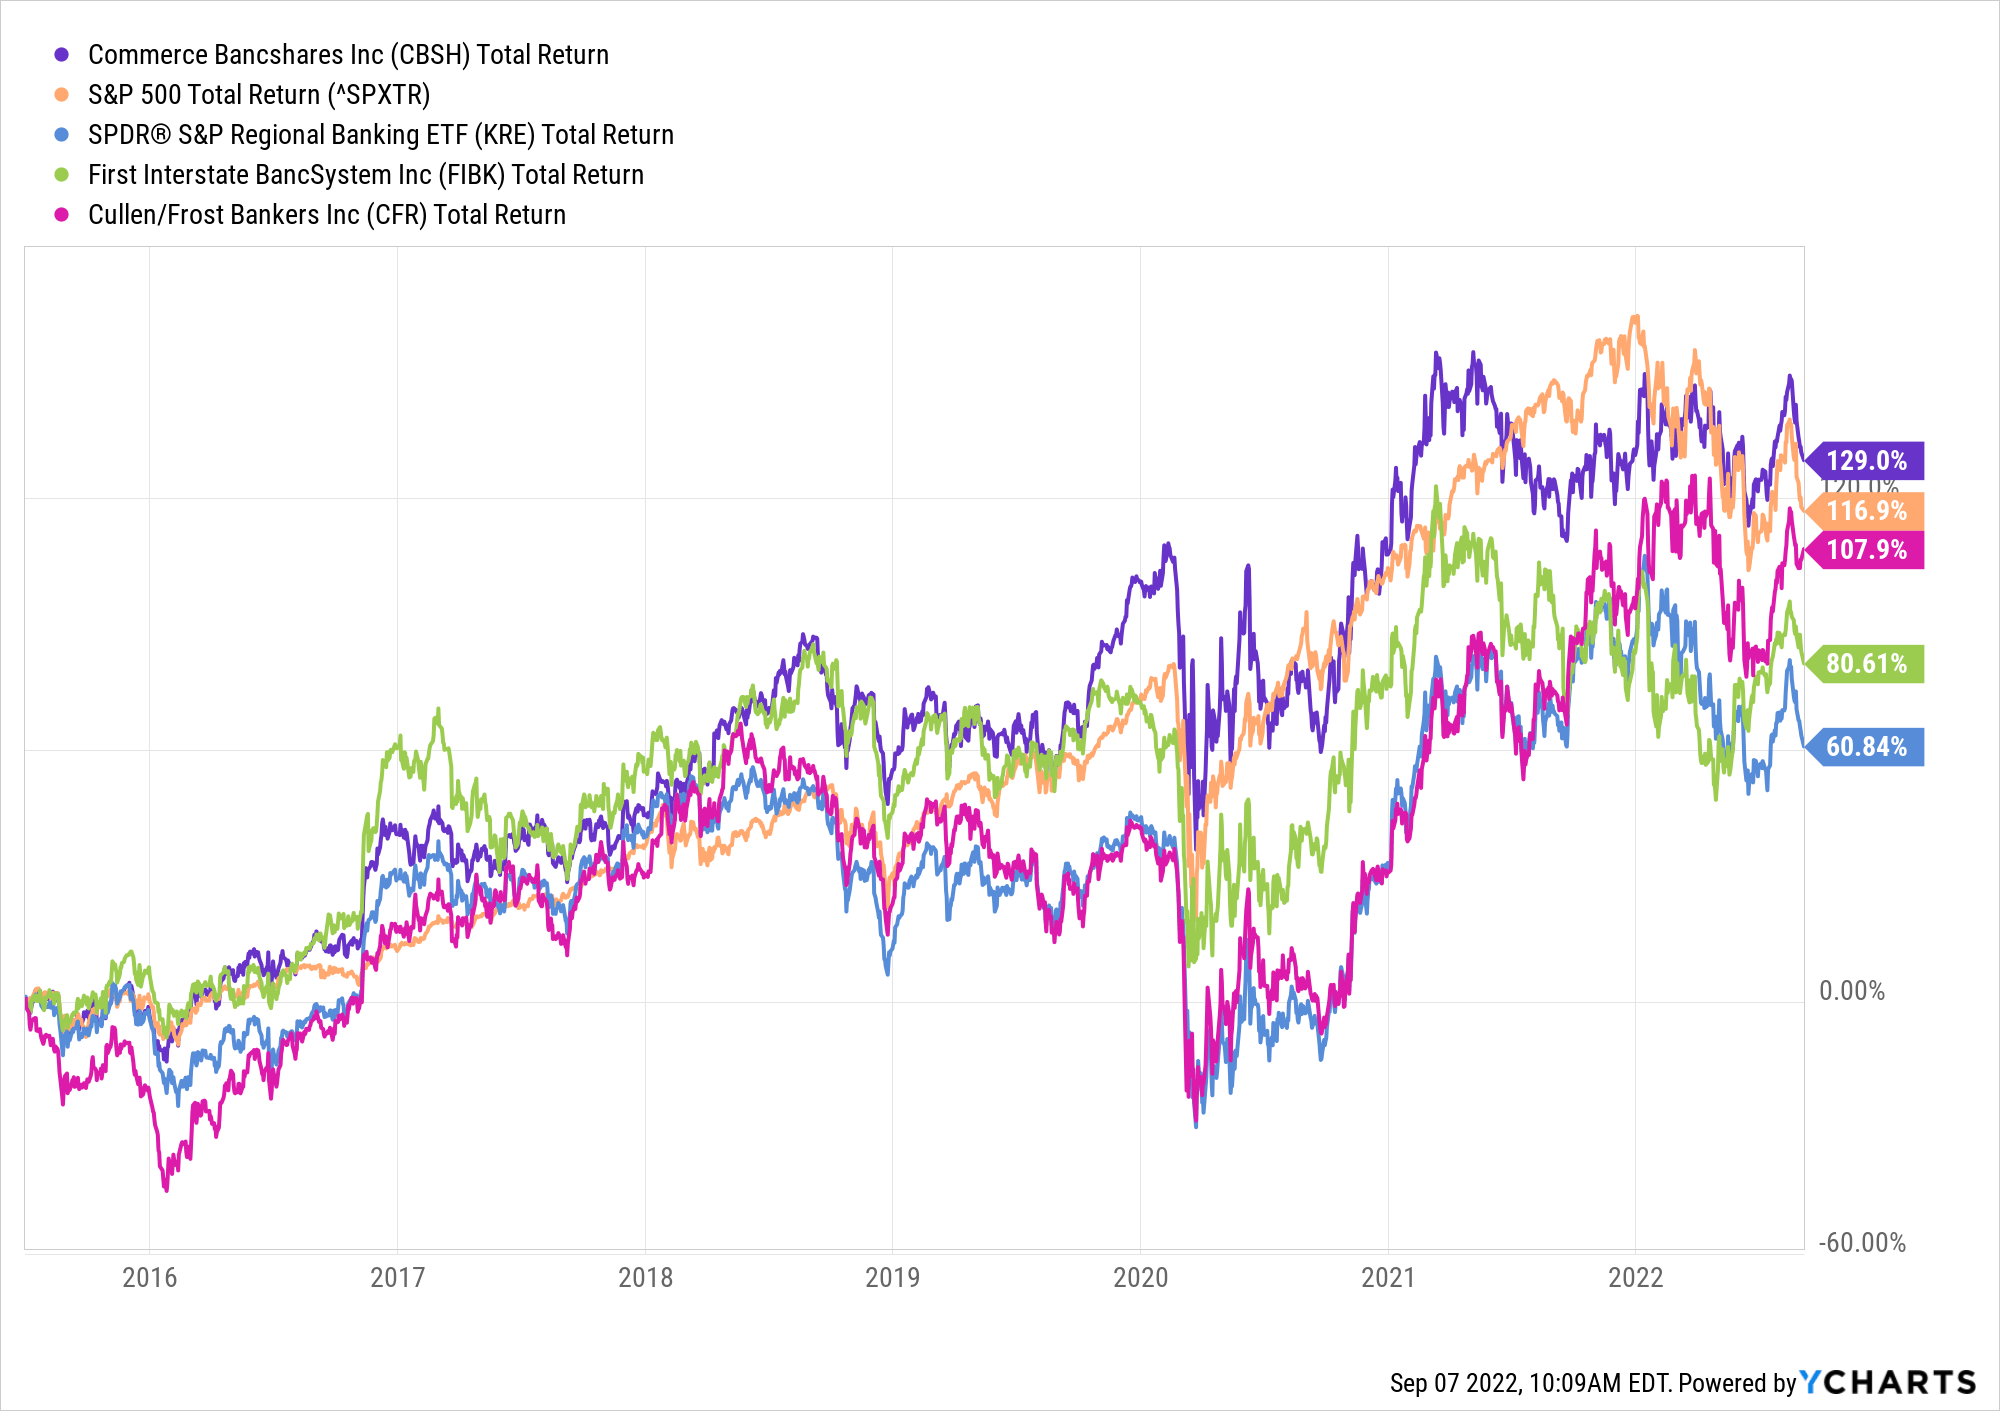
Stock Price Trends (Ycharts)
Valuation Trend
The chart below shows a run-chart of the median Price/Earnings (P/E) and Price/Tangible Book Value (P/TBV) for 50 Mid-Caps from YE 2011 to September 2022. Several observations can be made:
- Trends for both ratios have trended modestly down since peaking in the immediate aftermath of Trump’s 2016 victory.
- The Z-scores are important to evaluate as they provide statistical evidence of whether current valuations are truly different than recent history.
- I consider a Z-score between 1.0 and -1.0 statistically insignificant.
- Current median P/TBV of 1.69x is not significantly different than recent history, and therefore, does not indicate Mid-Caps are cheap as a group.
- However, the current median P/E ratio appears to be significantly cheaper than the 10-year history and moderately lower than five years.
- But, as noted in the article on Large-Caps, the lower P/E ratios for banks must be taken with a grain of salt: Why? Coming out of COVID, banks reversed Provision expenses, and as a result, somewhat artificially boosted profitability temporarily.
- Provision expense remains low compared to history; (smart) bank investors recognized this fact, and as a result, do not pay up for current earnings that are likely to fall as Provision normalizes over the next several quarters and years.
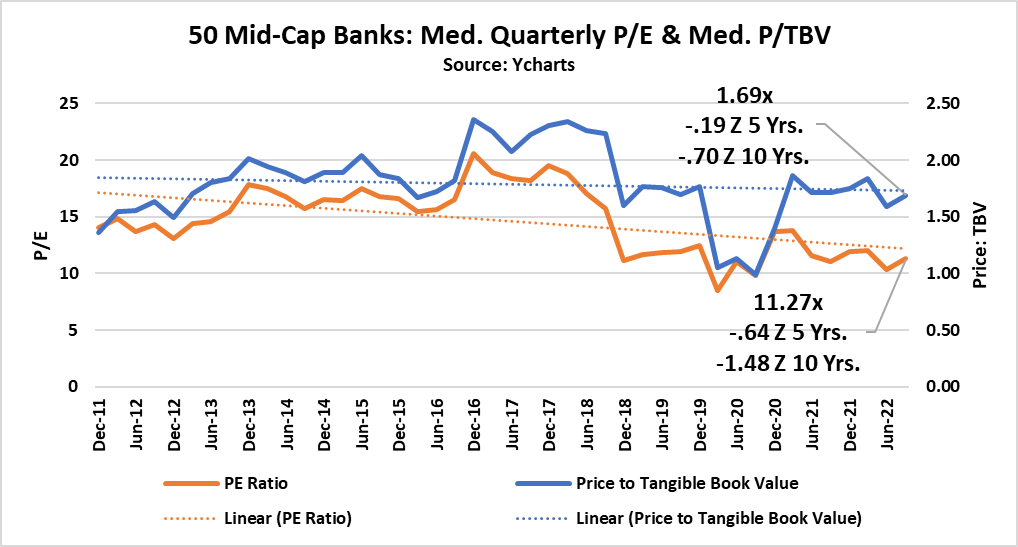
P/E & P/TBV Trends (Ycharts)
To build on the comment about Provision, this next chart highlights two observations:
- Note the drop in ROE (profitability) during peak COVID worries and the rebound during the months emerging from peak COVID concerns. Provision (a non-cash event) is the driver.
- The trend is generally up: This is good news, but may reflect benign market conditions (i.e., growing GDP, tight regulatory scrutiny, moderate-to-low loan growth trends, low interest rates) more than it reflects a real improvement in long-term profitability trends.
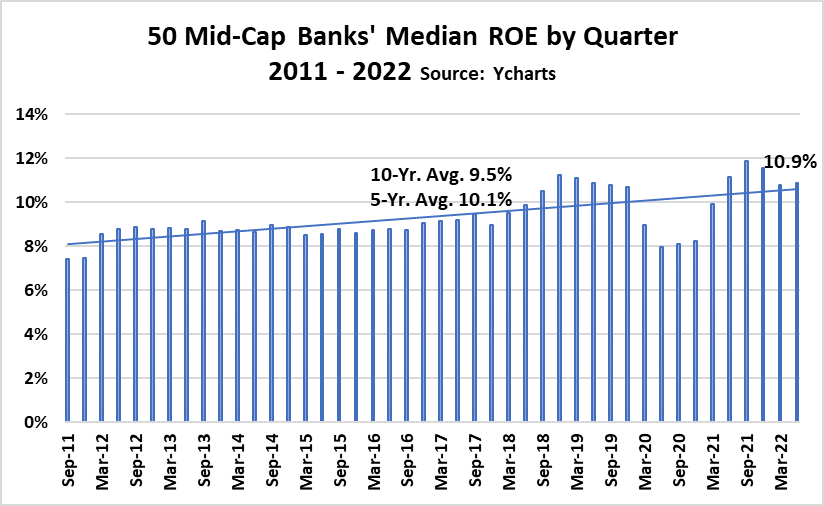
ROE Trends (Ycharts)
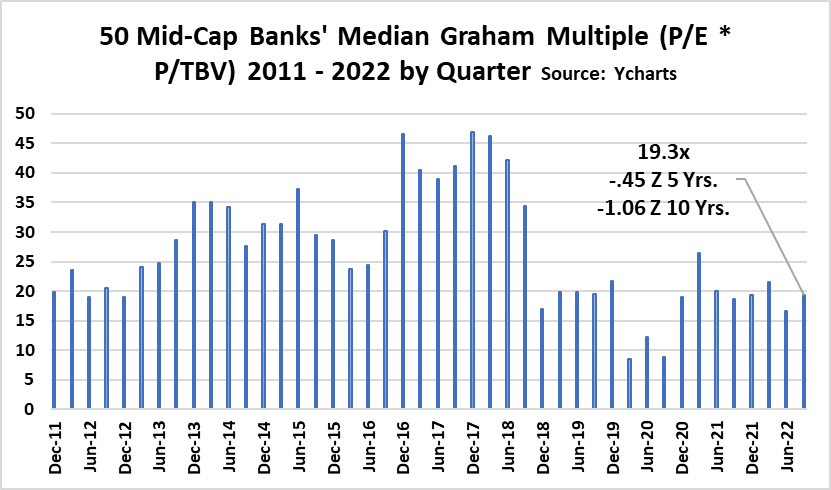
This next chart shows my favorite metric for measuring bank valuations: The Graham Multiple. For further background on this metric, see my recent Large-Cap article.
Key observations:
- At 19.3x, the Graham Multiple appears attractive relative to Graham’s rather arbitrary cap of 22.5x.
- At 19.3x, the current Graham Multiple is statistically favorable to the 10-year number.
- However, compared to the five-year Graham Multiple, the current Mid-Cap bank valuation is not super attractive.
Valuation Trend (Ycharts, BankRegData/FDIC)
Dividend Yields
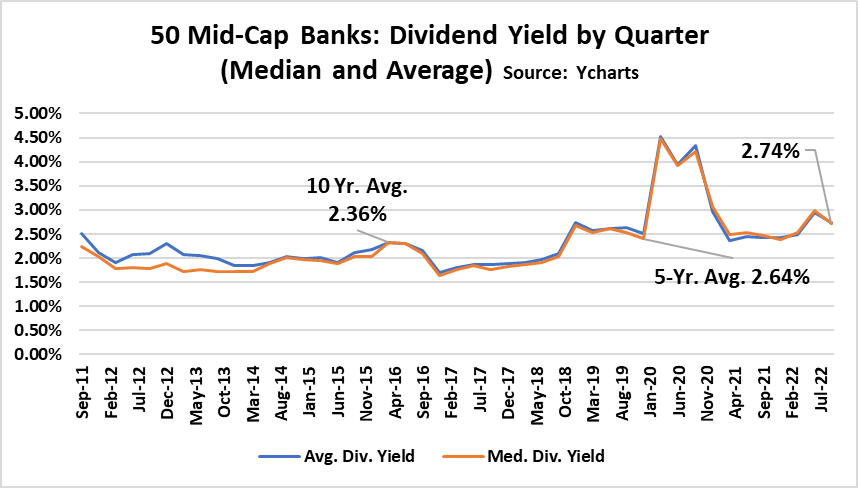
This next chart shows the average and median dividend yield for the 50 Mid-Caps during the past eleven years.
- Dividend yields today are favorable to five and ten-years.
- Note the spike in 2020: This was clearly the time to buy bank stocks if investors had the courage to buy when there was blood (virus) in the streets. Ironically, Warren Buffett, the apparent master of buying when everyone is selling, was a big seller of bank stocks at the time.
Div. Yields (Ycharts)
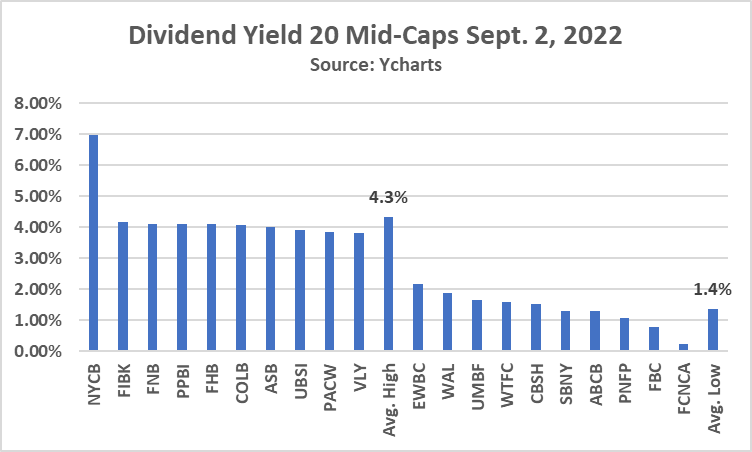
Since so many Seeking Alpha readers have a high regard for high yield dividends (see top 10 list of Seeking Alpha articles on any given day), readers might be interested to see the current dividend yields for the top-10 and bottom-10 Mid-Caps.
If you like dividends, the top dividend payers have a current average yield of 4.3% compared to just 1.4% among the banks that pay the lowest dividend rates. Is it better to buy Mid-Cap banks with high dividend yields or ones with low dividend yields?
Dividend Yields (Ycharts)
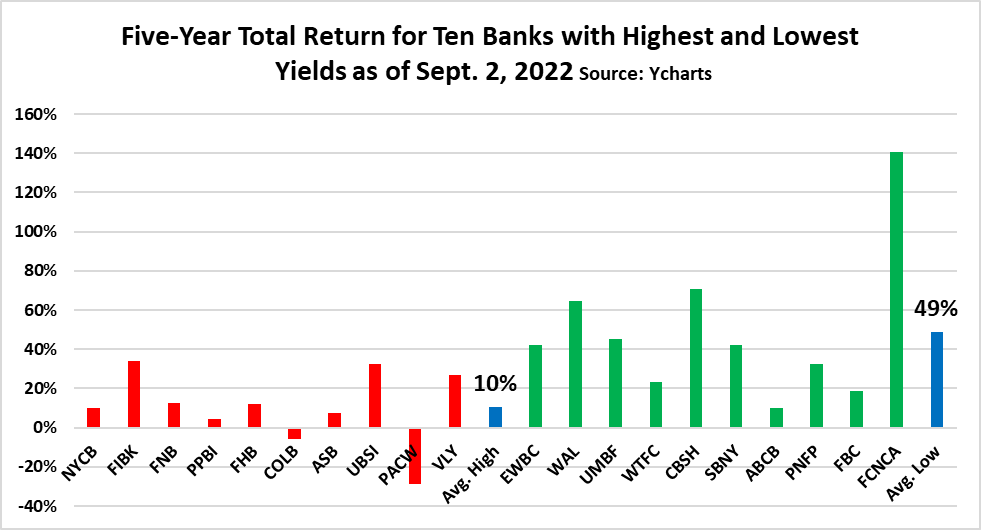
As a rule, I avoid high dividend yields because they tend to deliver lower total returns over time than banks with low and middle-of-the-pack dividend yields.
This next chart highlights the five-year total returns for the twenty banks from the prior chart. Note that the average total return (price + dividends) over the past five years for the high dividend payers is 10% compared to 49% for the ten banks with the lowest dividend yields.
Dividends & 5-Year Total Return (Ycharts)
Valuation Scatterplots
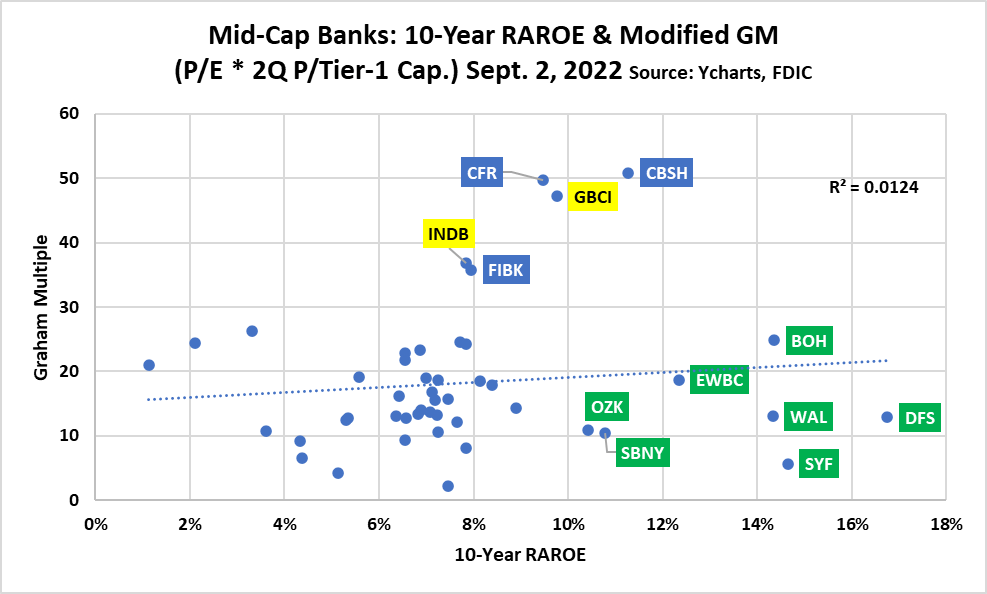
As I did with the Large-Cap banks, the next chart is a scatterplot that compares each bank’s five-year Risk-Adjusted Return on Equity (RAROE) to its Graham Multiple as of Sept. 2.
Unlike the Large-Caps that showed a statistically significant r-squared, it is notable that the Mid-Caps as a group show zero relationship between RAROE and Graham Multiple. (It needs to be noted that PacWest Bancorp (PACW), though one of the 50 Mid-Caps in this study, is excluded from the scatterplots because of its negative 5-year RAROE.)
What is the explanation for the absence of correlation between profitability (RAROE) and valuation (P/E, P/TBV)? Here are some thoughts:
- The market for Mid-Cap banks is less efficient than that for Large-Caps.
- Investors aggressively “overpay” for the most profitable and most consistently profitable Mid-Caps (see CFR, CBSH, and Glacier Bancorp Inc (GBCI)).
- Mid-Caps are much more likely to be engaged in M&A, an activity that tends to produce large one and two-quarter swings in earnings and ROEs. See FIBK, COLB, First Citizens BancShares Inc (FCNCA), Hancock Whitney Corp (HWC), SouthState Corp (SSB) among others.
- Investors today are almost deliriously suspicious of banks that are in the consumer card business, especially if the target consumer segment is mass market. I warned investors of this possibility (and likelihood) a year ago today in my Strong Sell article about Capital One Financial Corp (COF). Since then, COF’s price is down 34%. During the same time, Synchrony Financial (SYF) is down 33% and DFS Financial Services (DFS) is down 19%. Note in the scatterplot below that both are located in the bottom right-hand corner, a quadrant that indicates high and consistent profitability and low (favorable) valuation. Selling appears overdone.
- Western Alliance Bancorp (WAL) is a major outlier. Its RAROE is industry best, but its current valuation indicates some investors believe a major crisis is on the horizon.
- Eastern Bancshares Inc (EBC) is another major outlier. EBC, a Massachusetts bank, only went public in late 2020. This fact may contribute to its seemingly high price relative to profitability. As a hard rule, I avoid banks that compete in large New England cities for reasons described in this May 2020 article.

Scatterplot: GM & RAROE (Ycharts)
The absence of correlation between Valuation and Profitability took me back to the drawing board to see if there was something I am missing.
The next two charts are my response to this question.
This chart is identical to the prior, but in this case, I have modified the Graham Multiple to reflect Market Cap (Sept. 2) as a ratio of Tier-1 Capital for each bank (June 30 per FDIC).
Interestingly, the change to the Graham Multiple yields a similar picture as seen in the prior scatterplot.

Scatterplot: RAROE & Modified GM (Ycharts, BankRegData/FDIC)
The next scatterplot evaluates RAROE over ten years (40 quarters). Note that Bank OZK (OZK) has a 10-year RAROE greater than 10%. This is excellent. However, OZK’s five-year RAROE is less than 10%, indicating that its profitability is moving south when peer profitability has improved.
Scatterplot: RAROE & Modified GM 10 Years (Ycharts, BankRegData/FDIC)
Loan-to-Asset Ratios
Here are a couple charts that may shed light on why there is no current correlation between long-term Profitability and current Valuations.
This next run-chart shows the median Loans-to-Assets for the median Mid-Cap bank over the past decade. Note the precipitous drop that occurred in 2020-2021. Note too the change in trend over the past four quarters.
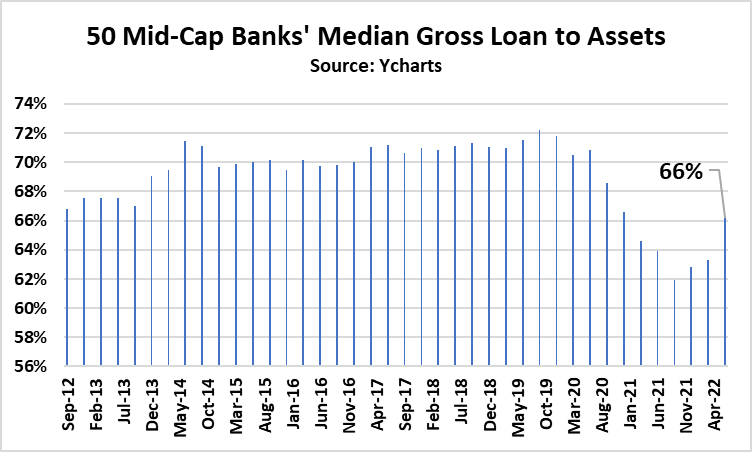
Loan-Assets (Ycharts)
The next chart shows the Loan/Asset ratio for the 50 Mid-Caps. The banks noted in red have the highest ratios and the ones in green have the lowest.
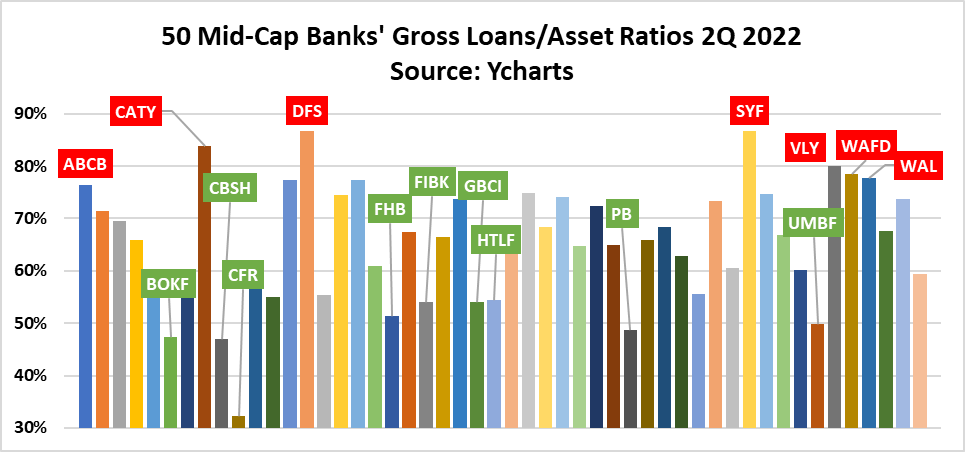
Loan-to-Assets (Ycharts)
Here comes a money chart.
It shows that investors favor banks with low loan/asset ratios.
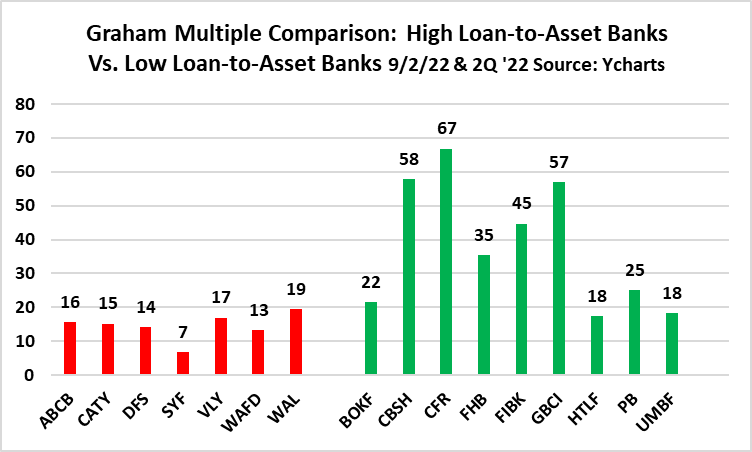
GM & Loan/Ass. Ratio (Ycharts)
This next chart is telling. Investors should be especially cautious when it comes to banks with high Loan/Asset ratios and high funding costs: DFS, SYF, WAL.
In contrast, banks with low Loan/Asset ratios have almost across-the-board low funding costs. Gathering cheap “core” deposits is a huge competitive advantage to banks like CFR, CBSH, FIBK, GBCI, and Texas-based Prosperity Bancshares Inc (PB).
Note also the last three banks:
- Comerica Inc has one of the best funding costs in the industry. Its shares are up 14.4% over the past year for this reason.
- Investors in Bank of America Corp (BAC) will see over time the advantage the bank enjoys because of its sticky core deposits gathered from not only its branches, corporate footprint, but also massive Merrill platform.
- Finally, Capital One looks a lot more like peers DFS and SYN than it does BAC.

Funding Costs (BankRegData/Ycharts)
Final Thoughts: Opportunities and Risks
I will close headline thoughts on a variety of banks and themes.
Mid-Cap Valuations
Mid-Caps are not bargain-priced. The best ones are expensive. The least expensive all bear their own unique risks.
Bank investors tend to under-emphasize the importance of investing new dollars in banks when bank stocks as a group are cheap. It is far better to invest in high quality banks when the industry is cheap than in cheap banks when the industry is expensive or even moderately priced.
Systemic Risk Uncertainty
2Q earnings for U.S. banks were stellar. My analysis of comments made by CEOs during 2Q earnings calls triggered few big concerns. The overall tone of CEOs was bullish.
That said, there are a number of moving parts in the economy that keep me from investing aggressively right now. Top systemic concerns: Inflation trends/Fed actions (impacts funding costs), Recession risk (impacts default risk), duration risk (impacts banks that fail to match assets/liabilities) and reversion to mean Provision expense (impacts EPS/ROE).
High-Quality Banks with Cheap Core Deposits
The market has spoken: Investors prefer banks with cheap core deposits. That said, not all the banks with low-cost deposits are bid up today. Comerica remains attractive if rates rise. Oklahoma’s BOK Financial Corp (BOKF) looks interesting. Heartland Financial USA Inc (HTLF) is a one-of-a-kind bank that operates multiple banks in rural and regional markets where competition for deposits is less intense than what community and regional banks find in large urban markets. Texas-based Prosperity is worth considering but requires investors to accept risks associated with a bank that is an active acquirer. I have a high regard for Prosperity management.
M&A: Best Way to Invest in Mid-Caps
History shows that the best way to create alpha in Mid-Caps is to buy the Mid-Caps that sell out to another Mid-Cap.
The list of sellers over the past few years is impressive: Great Western, Peoples United, Compass, CIT, Sterling, Iberia, Mid-South, TCF, Chemical, MB Financial. You also have mergers of equals like Old National Bancorp (ONB) and First Midwest as well as Umpqua and Columbia which is pending. Also pending right now is The Toronto-Dominion Bank (TD) acquisition of First Horizon Corp (FHN).
Herein lies the challenge: Can investors identify the banks most likely to sell? I have done a lot of research of this topic in the past. Perhaps I will work up a future article if time permits.
Columbia-Umpqua
Note that one of my favorite banks, Columbia Banking System Inc (COLB), is among the top ten dividend payers (4.18%). I wrote about COLB in November of last year right after the bank announced its merger-of-equals with Umpqua Holdings Corp (UMPQ).
I indicated in the article that I expected COLB shares to drop into the mid-to-high $20s, which it has ($28.75 as of 9/7). COLB has a good long-term story. The CFO picked up 3,000 shares in May at $28. Umpqua insiders, however, have been sellers of late. One of COLB’s (and UMPQ’s) competitive advantages is its highly favorable funding cost ($0.06 per $100 of earning assets as of Q2 2022).
Synchrony and DFS
My sense is that the selling of SYF, DFS, and COF is overdone. But none of those banks meet my risk profile, so I will avoid.
Western Alliance Bank
I find this bank to be the single most interesting study among the 50 Mid-Caps. My initial research yields some encouraging highlights:
- Extremely bullish CEO commentary in July 2022.
- Management’s bullish forward EPS indicates forward P/E ~7ish.
- Insider buying earlier in summer at prices similar to today.
- Strong RAROE, low valuation.
- Impressively short duration risk in the bank’s large commercial real estate portfolio.
But there are plenty of questions as well. I have completed a deep dive analysis of WAL and may share it with Seeking Alpha readers if I have the time and motivation to do a meaningful write-up.
Cullen Frost
Investors seem to finally understand that CFR is a unique bank with a compelling story. My August 2019 article spelled out the reasons I have owned CFR for a long time. Happily, CFR increased its dividend by 16% a few days ago and now has a forward dividend yield of 2.62%. As already noted, CFR has one of the lowest loan-to-deposit ratios in the nation as well as industry-leading low funding costs. CFR also has incredible liquidity as its cash and cash equivalents amounted to 26% of assets as of 2Q 2022. This fact gives the bank a lot of flexibility as/if rates rise over the next year. It also means there is zero chance CFR will chase deposits as rates rise.
With all that said, CFR looks rich. Upside opportunity muted by current valuation. However, I am not a seller as I see no better way to invest in Texas, the nation’s fastest growing state as measured by GDP, than CFR.
First Interstate
I am wait-and-see. The Scott family seems to be active sellers, but most of their sales are small dollars. If CEO Kevin Riley is reading these comments, please know I am grateful to see he has been a buyer of shares in the open market (most recently, June 2022, 15,899 shares at $37.33).
I try to mitigate bank investment risk by owning great banks of different size, different business models, and covering diverse parts of the country. I continue to like the markets in which FIBK competes. It is impossible to get meaningful bank investment exposure to the Mountain states without investing in either FIBK or GBCI (a really impressive bank by the way).
East West Bancorp Inc (EWBC)
On every metric important to me as a long-term buy-and-hold investor, EWBC looks strong. I rate EWBC a High-Quality bank. It has:
- Niche business model which diversifies the risk of my hold holdings.
- The only Southern CA bank in my data set that earns superior RAROE
- Decent valuation
- Strong core deposits
- Excellent management
- Strong productivity, expense management discipline
- Shareholder-friendly
The current knock on EWBC, if there is a knock, is its exposure to China-US trade. Geopolitical risk is high with EWBC.
It is not expensive.
CAVEAT
Every investor needs to understand their goals and appetite for risk. Having a perspective on valuations is just one element of an investor’s risk appetite.
My Risk Profile is such that I am not trying to beat the market. Capital preservation is important. I am willing to trade high side opportunity for low side protection.
Diversification is my best protection against out-sized risk, but it does not provide perfect protection against worldwide equity weakness.
I hope the data I shared in this article is helpful to readers as you draw your own path to risk-return optimization. Investors need to do their own due diligence before investing.
Be the first to comment