

sduben/iStock via Getty Images
Foreword
About Large Cap Value
YCharts created a Value ranking by putting together complementary strategies that were found during research. It is essentially a value ranking, which looks at the price of a stock relative to a number of measurements that determine intrinsic firm value. Only the largest 10% of companies based on market cap are allowed in this portfolio.
What it is: The Value Score is a composite score. It tells you how much you are getting in terms of profits, cash flows, assets, sales, etc. for the stock price that you pay. It is a relative measurement, so it says nothing about the overall level of the market. Rather, it answers the question: “Given the current market level, which stocks give you the most current value for your dollar of investment?” Tens are the most value, and 1s are the least.
How to use it: Use it to find companies that are selling at a low price relative to their assets and profits.
Limitations of the Value Score: Watch out for companies with a lot of uncertainty or bad prospects for the future (e.g. Pharma companies with expiring patents, industries on the decline, etc.).
About the Ben Graham Formula
The Ben Graham Formula strategy contains ultra-stable stocks that will infrequently lose money if held over a long period of time. It was developed based on a screen in Graham’s book, “The Intelligent Investor.” For those who have read the book, it is the “Defensive Investor” screen. It selects stocks that are large in terms of sales and total assets, have a strong track record of earnings and dividend payments, have a reasonable current ratio and level of long term debt, and have a low valuation given by PE Ratios and Price to Book Value ratios.
– YCharts
While 20 out of this collection of 70 All-Star-Value Dividend stocks are too pricey to justify their skinny dividends, 50 of the 70, by yield, live up to the ideal of offering annual dividends (from a $1K investment) exceeding their price per share.
This list of December All-Star-Value discarded three stocks showing outlandish yield members, namely ZIM, KEN, and PBR. ZIM showed an unsustainable yield and is not included this month. KEN and PBR also showed unsustainable dividends and were removed. TLYS shows no dividend and so is out. Gone, also, is the saga of QIWI, an unavailable yet still-listed Russian stock on the charts. Thus, QIWI is a real war casualty again this month.
Source: YCharts.com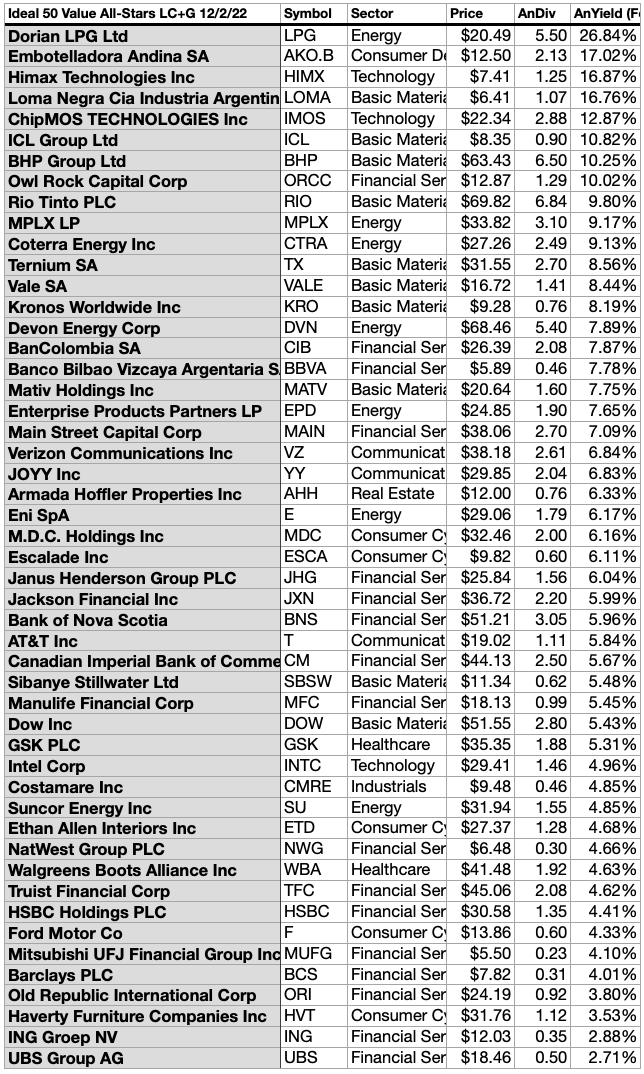
In the current market bounce, the dividends from $1k investments in any of the fifty stocks listed above, met, or exceeded their single share prices as of 12/2/22.
As we are now nine months past the second anniversary of the 2020 Ides of March dip, the time to snap up some of the fifty top-yield All-Star- Value dogs is now… unless another big bearish drop in price looms ahead. (At which time, your strategy would be to add to your position in any of these you then hold.)
Actionable Conclusions (1-10): Analysts Estimate 39.65% To 83.60% Top Ten All-Star-Value Net Gains To December 2023
Three of the ten top picks by yield were verified as also being among the top ten gainers for the coming year based on analyst 1-year target prices. (They are tinted gray in the chart below). Thus, this yield-based forecast for All-Star-Value derived dividend dogs (as graded by Brokers) was 30% accurate.
Estimated dividend returns from $1000 invested in each of the highest-yielding stocks and their aggregate one-year analyst median target prices, as reported by YCharts, created the 2022-23 data points. (Note: target prices by lone analysts were not used.) Ten probable profit-generating trades projected to December 2, 2023 were:
Source: YCharts.com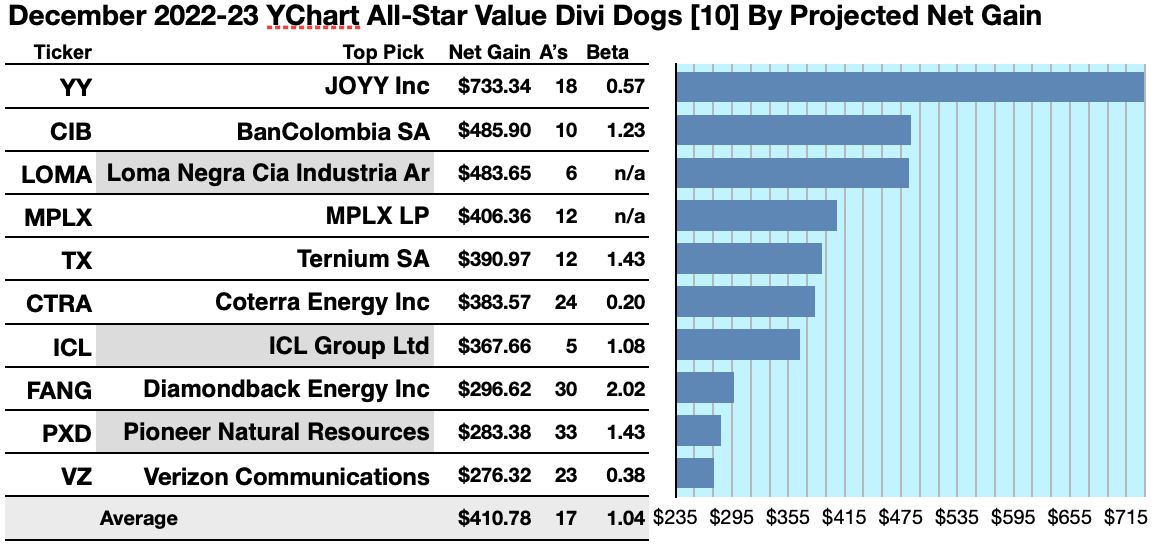
JOYY Inc. (YY) was projected to net $733.34, based on the median of target price estimates from 18 analysts, plus dividends, less broker fees. A Beta number showed this estimate subject to risk/volatility 43% less than the market as a whole.
Bancolombia S.A. (CIB) was projected to net $485.90 based on dividends, plus the median of target price estimates from 10 analysts, less broker fees. The Beta number showed this estimate subject to risk/volatility 23% more than the market as a whole.
Loma Negra Compania Industrial Argentina SA (LOMA) was projected to net $483.65, based on the median of target price estimates from 6 analysts, plus the estimated annual dividend, less broker fees. A Beta number was not available for LOMA.
MPLX LP (MPLX) netted $406.36 based on a median target price estimate from 12 analysts, plus dividends, less broker fees. A Beta number was not available for MPLX.
Ternium S.A. (TX) was projected to net $390.97, based on a median of target estimates from 12 analysts, plus dividends, less broker fees. The Beta number showed this estimate subject to risk/volatility 43% greater than the market as a whole.
Coterra Energy Inc. (CTRA) was projected to net $383.57, based on dividends, plus the median of target price estimates from 24 analysts, less broker fees. The Beta number showed this estimate subject to risk/volatility 80% under the market as a whole.
ICL Group Ltd (ICL) was projected to net $367.66, based on dividends, plus the median of target price estimates from 5 analysts, less broker fees. The Beta number showed this estimate subject to risk/volatility 80% greater than the market as a whole.
Diamondback Energy, Inc. (FANG) was projected to net $296.62, based on a median target price estimates from 30 analysts, plus dividends, less broker fees. The Beta number showed this estimate subject to risk/volatility 102% over the market as a whole.
Pioneer Natural Resources (PXD) was projected to net $283.38, based on dividends, plus the median of target price estimates from 33 analysts, less broker fees. The Beta number showed this estimate subject to risk/volatility 43% greater than the market as a whole.
Verizon Communications Inc. (VZ) was projected to net $276.32, based on dividends, plus the median of target price estimates from 23 analysts, less broker fees. The Beta number showed this estimate subject to risk/volatility 62% less than the market as a whole.
The average net gain in dividend and price was estimated to be 41.08% on $10k invested as $1k in each of these ten stocks. The average Beta showed these estimates subject to risk/volatility 4% greater than the market as a whole.
Source: Open source dog art from dividenddogcatcher.com
The Dividend Dogs Rule
Stocks earned the “dog” moniker by exhibiting three traits: (1) paying reliable, repeating dividends, (2) their prices fell to where (3) yield (dividend/price) grew higher than their peers. Thus, the highest-yielding stocks in any collection became known as “dogs.” More precisely, these are, in fact, best called, “underdogs”.
Top 50 All-Star-Value Picks By Broker Targets
Source: YCharts.com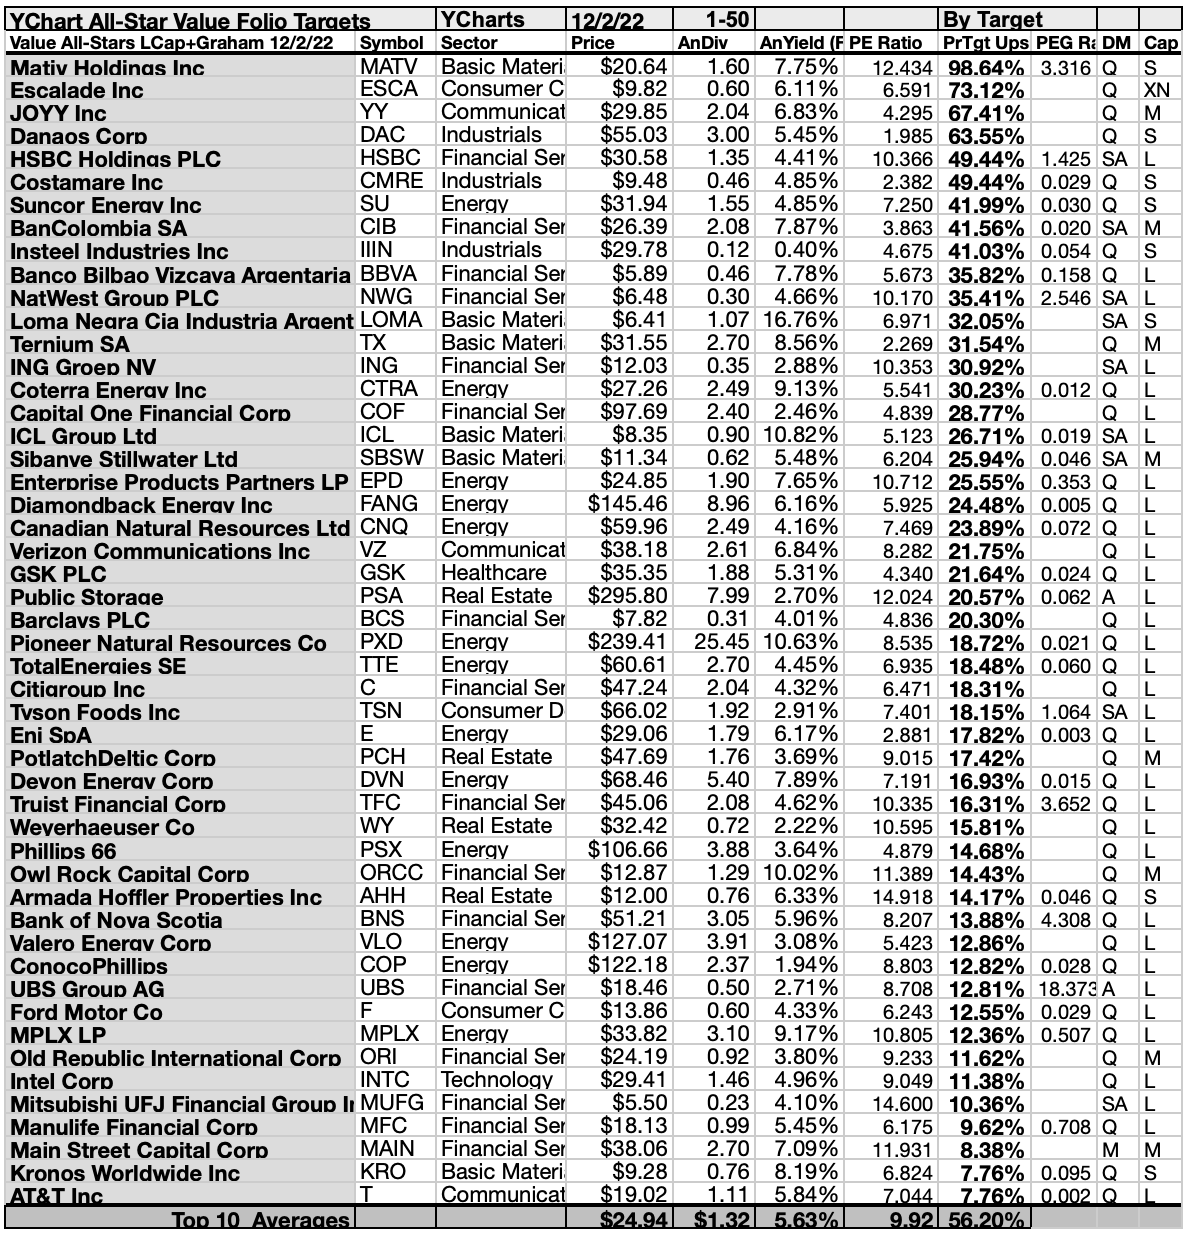
This scale of broker-estimated upside (or downside) for stock prices provides a scale of market popularity. Note: no broker coverage or 1 broker coverage produced a zero score on the above scale. This scale can be taken as an emotional component as opposed to the strictly monetary and objective dividend/price yield-driven report below. As noted above, these scores may also be taken as contrarian.
Top 50 All-Star-Value Picks By Yield
Source: YCharts.com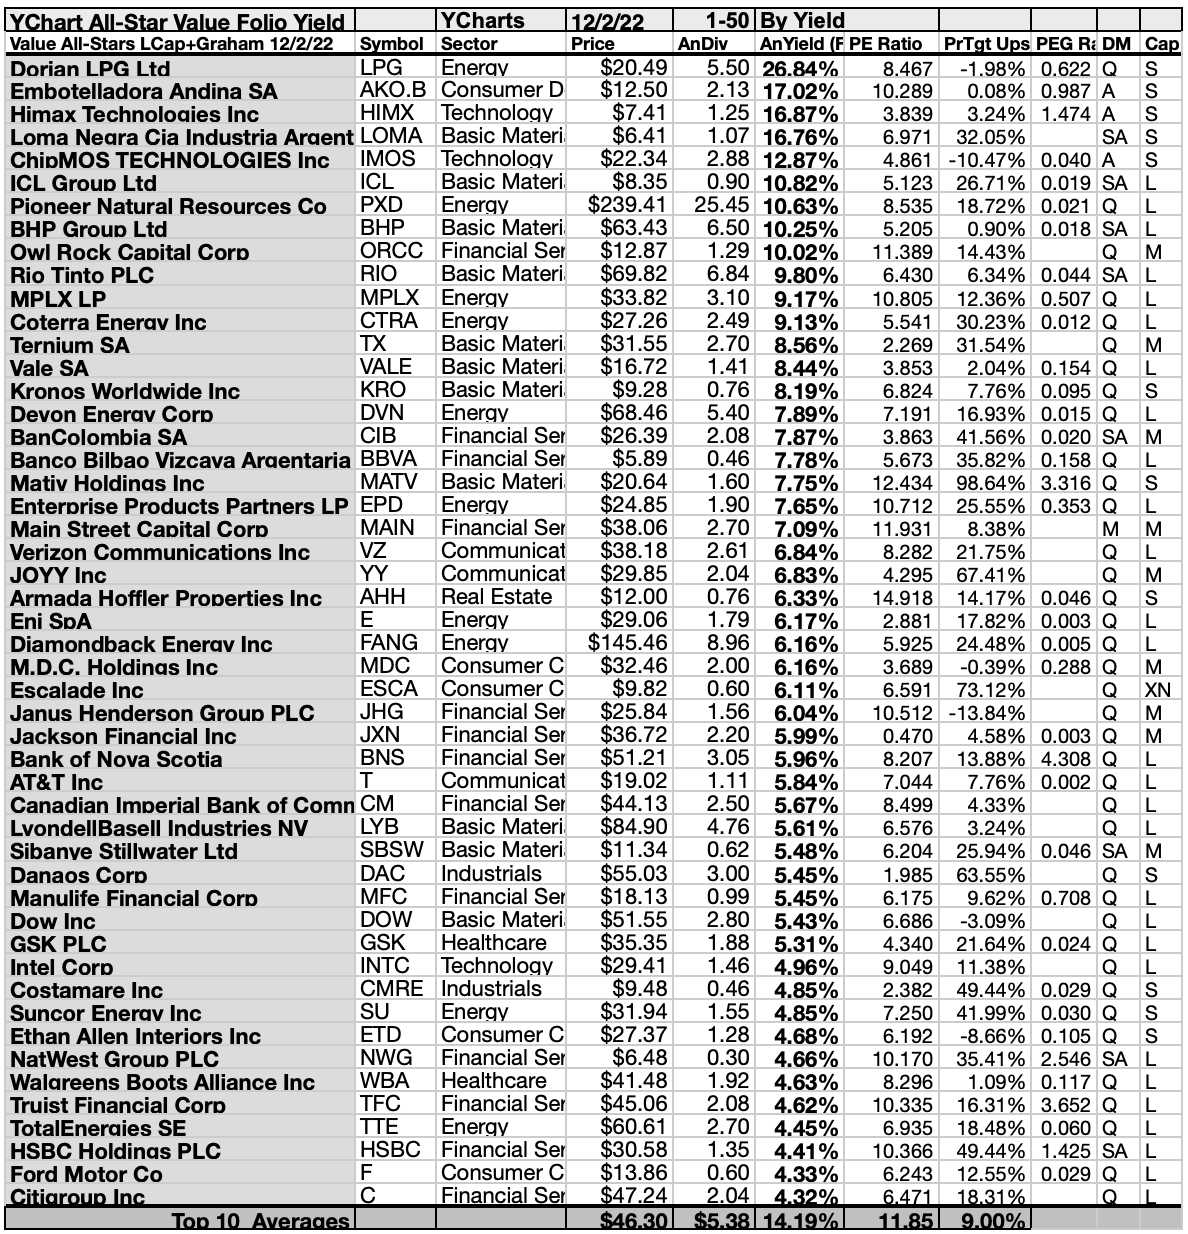
Actionable Conclusions (11-20): Ten Top Stocks By Yield Are The December Dogs of The All-Star-Value Pack
Top ten All-Star-Value stocks selected 12/2/22 by yield represented five of eleven Morningstar sectors. First place was secured by the first of two energy sector representatives, Dorian LPG Ltd. (LPG) [1]. The other placed seventh, Pioneer Natural Resources Co. [7].
Then one consumer defensive member placed second, Embotelladora Andina SA (AKO.B).
The first of two technology members placed third, Himax Technologies, Inc. (HIMX) [4], while the other placed fifth, ChipMOS TECHNOLOGIES Inc. (IMOS) [5].
Then, mid-pack, four basic materials representatives placed fourth, sixth, eighth, and tenth, Loma Negra Compania Industrial Argentina S.A. [4], ICL Group Ltd [6], BHP Group Limited (BHP) [8], and Rio Tinto Group (RIO) [10].
Finally, one financial services representative placed ninth, Owl Rock Capital Corp. (ORCC) [9] to complete this All-Star-Value top ten, by yield, for December.
Source: YCharts.com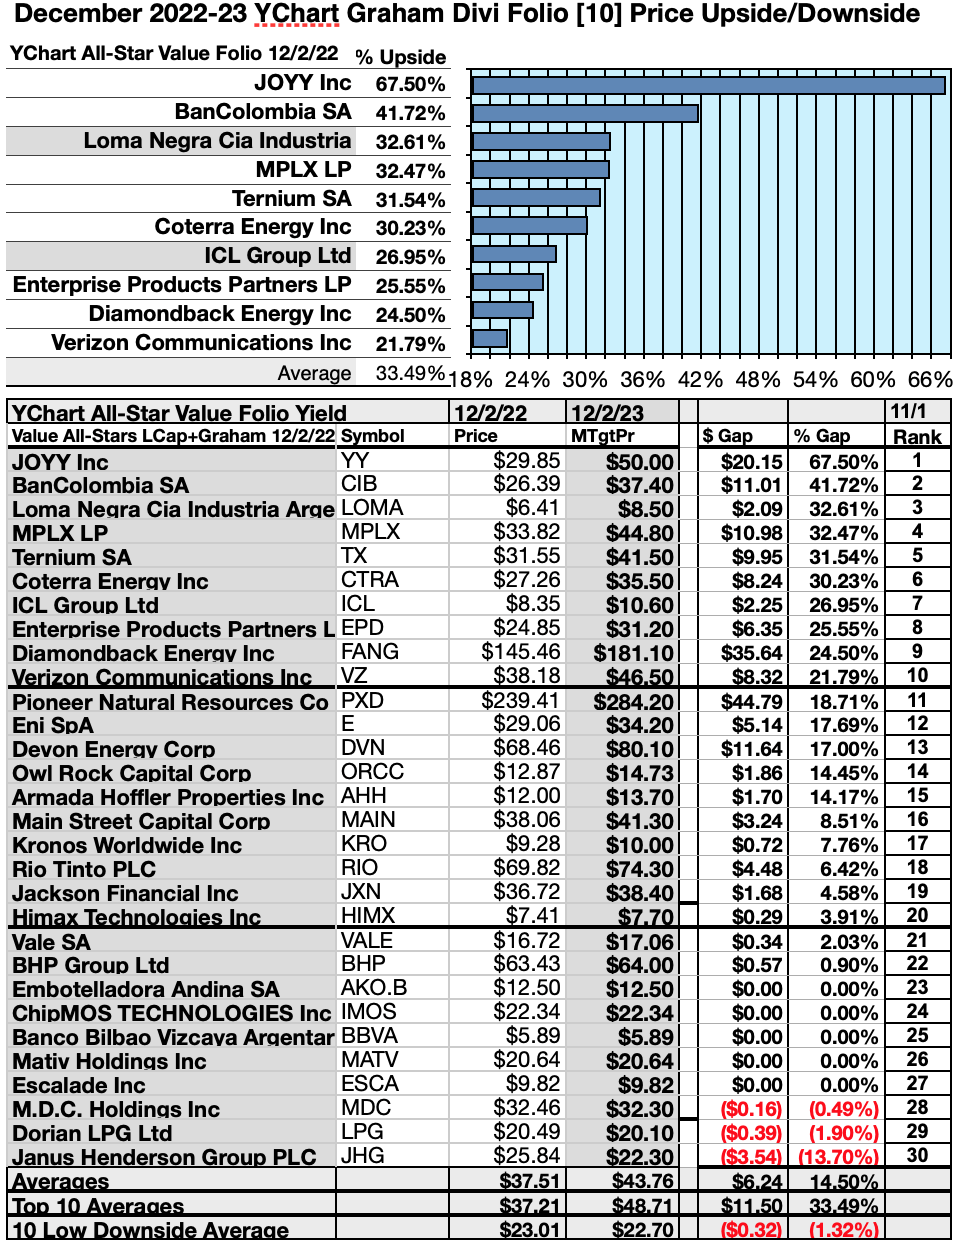
Actionable Conclusions: (21-30) Ten All-Star-Value Dividend Stocks Showed 21.79% To 67.5% Upsides To December, 2023, With (31) Three -0.49% to 13.70% Losers
To quantify top-yield rankings, analyst median-price target estimates provided a “market sentiment” gauge of upside potential. Added to the simple high-yield metrics, analyst median price target estimates became another tool to dig out bargains.
Analysts Estimated A 22.47% Advantage For 5 Highest Yield, Lowest Priced of Top-Ten All-Star-Value Dogs To December, 2023
Ten top All-Star-Value stocks were culled by yield for this monthly update. Those (dividend/price) results provided by YCharts did the ranking.
Source: YCharts.com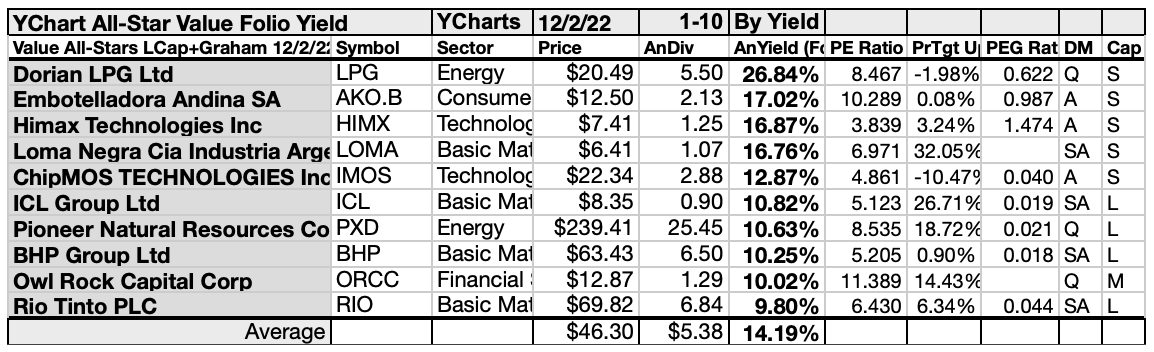
As noted above, top-ten All-Star-Value Dogs selected 12/2/22, showing the highest dividend yields, represented five of eleven sectors in the Morningstar scheme.
Actionable Conclusions: Analysts Estimated The 5 Lowest-Priced Of Ten Highest-Yield All-Star-Value Dividend Stocks (33) Delivering 28.88% Vs. (34) 23.39% Net Gains by All Ten by December, 2023
Source: YCharts.com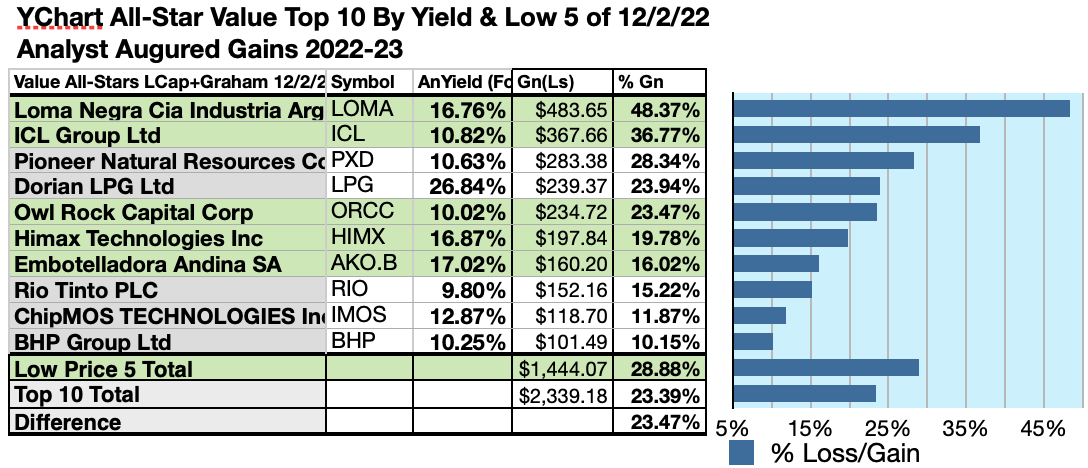
$5000 invested as $1k in each of the five lowest-priced stocks in the top ten All-Star-Value dividend pack, by yield, were predicted by analyst 1-year targets to deliver 25.44% LESS gain than $5,000 invested as $.5k in all ten. The very lowest-priced All-Star-Value top-yield stock, Loma Negra Compania Industrial Argentina S.A., was projected to deliver the best net gain of 48.37%.
Source: YCharts.com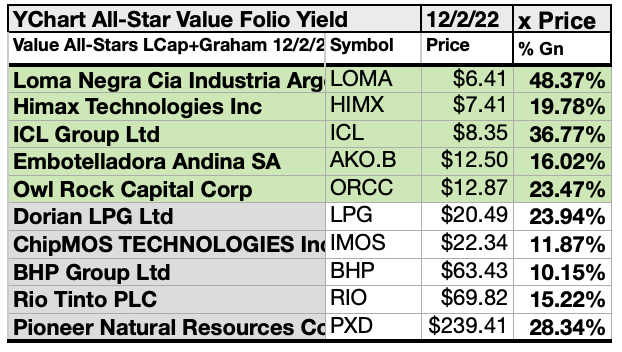
The five lowest-priced top-yield All-Star-Value dividend stocks for December 2 were: Loma Negra Compania Industrial Argentina S.A.; Himax Technologies, Inc.; ICL Group Ltd; Embotelladora Andina S.A.; Owl Rock Capital Corp., with prices ranging from $6.41 to $12.87.
The five higher-priced top-yield All-Star-Value dividend stocks for November 1 were: Dorian LPG Ltd.; ChipMOS TECHNOLOGIES Inc.; BHP Group Limited; Rio Tinto Group; Pioneer Natural Resources Company, whose prices ranged from $20.49 to $239.41.
This distinction between five low-priced dividend dogs and the general field of ten reflected Michael B. O’Higgins’ “basic method” for beating the Dow. The scale of projected gains based on analyst targets added a unique element of “market sentiment” gauging upside potential. It provided a here-and-now equivalent of waiting a year to find out what might happen in the market. Caution is advised, since analysts are historically only 20% to 85% accurate on the direction of change and just 0% to 15% accurate on the degree of change.
Afterword
If somehow you missed the suggestion of the twenty-five stocks ripe for picking at the start of the article, here is a repeat of the list at the end:
Source: YCharts.com
In the current market bounce, dividends from $1K invested in the fifty stocks listed above met or exceeded their single share prices as of 12/2/22.
As we are nine months past the second anniversary of the 2020 Ides of March dip, the time to snap up those twenty-five top-yield All-Star-Value dogs is now… unless another big bearish drop in price looms ahead. (At which time, your strategy would be to add to your holdings.)
Recent vs Break-Even Top Ten All-Star-Value Stock Prices
Since all of the top-ten All-Star-Value Dividend shares are now priced less than the annual dividends paid out from a $1K investment. The following top chart shows the dollar and percent variants to all ten top dogs conforming to (but not exceeding) the dogcatcher ideal.
Those at recent prices are the subject of the middle chart with the break-even pricing of all ten delivered in the bottom chart.
Source: YCharts.com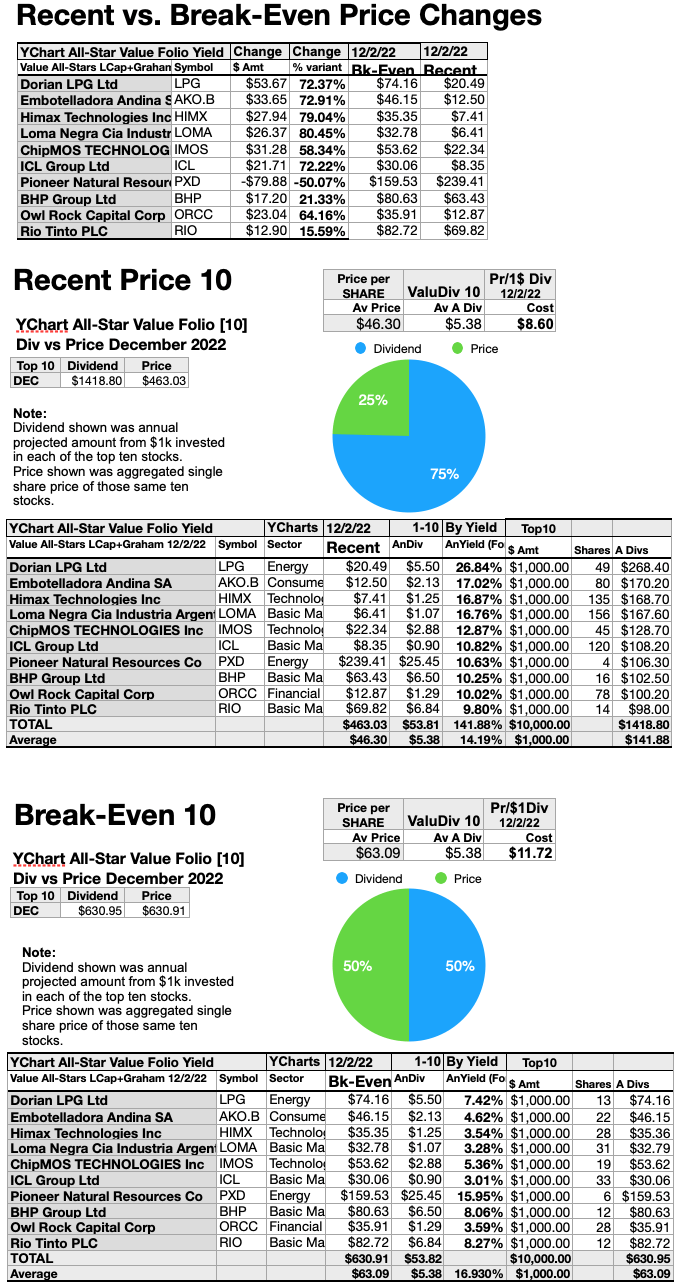
You could look at the top chart as an indicator of how high each stock might rise in the coming year or two. However, it also shows how much the price must rise (in either dollars or percentage) before it no longer conforms the standard of dividends from $1K invested exceeding the current single share price.
The net gain/loss estimates above did not factor in any foreign or domestic tax problems resulting from distributions. Consult your tax advisor regarding the source and consequences of “dividends” from any investment.
Stocks listed above were suggested only as possible reference points for your All-Star-Value Dividend dog stock purchase or sale research process. These were not recommendations.
Disclaimer: This article is for informational and educational purposes only and should not be construed to constitute investment advice. Nothing contained herein shall constitute a solicitation, recommendation or endorsement to buy or sell any security. Prices and returns on equities in this article except as noted are listed without consideration of fees, commissions, taxes, penalties, or interest payable due to purchasing, holding, or selling same.
Graphs and charts were compiled by Rydlun & Co., LLC from data derived from www.indexarb.com; YCharts.com; finance.yahoo.com; analyst mean target price by YCharts. Dog silhouette: Open source dog art from dividenddogcatcher.com
Be the first to comment