

Olivier Le Moal/iStock via Getty Images
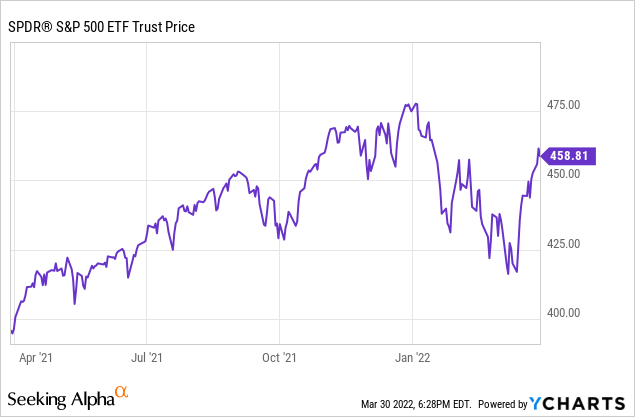
What a difference a month can make. Needless to say, we have been on a roller coaster ride for some time. As we write this, bulls appear to have taken control once again. The S&P 500 closed above the 4600 level for the first time since January 14th. The recent uptick has been due to indications of positive progress in peace negotiations between Russia and Ukraine. Besides, the war in Eastern Europe and the market has had quite a few other issues to contend with and come to terms with. The most important ones have been rising inflation, increasing interest rates, and a somewhat hawkish Fed. However, the market has shown tremendous resilience, and the path for further upward momentum is clear enough unless there is some serious setback in the Ukraine situation.
As always, being long-term investors, we don’t pay too much attention to short-term market noise and keep the focus on the long-term game plan. We should always remind ourselves that there’s only one thing certain in markets, and that’s “uncertainty,” and our portfolios should be structured in such a way that they provide decent and proportionate returns when the market is booming but preserve the capital when times get tough.
As long-term DGI investors, we need to pay attention to the quality of companies that we buy and the price we pay. Naturally, it helps to buy such companies when they’re being offered relatively cheap. The goal of this series of articles is to find companies that are fundamentally strong, carry low debt, support reasonable, sustainable, and growing dividend yields, and also trade at relatively low or reasonable prices. These DGI stocks are not going to make anyone rich overnight, but if your goal is to attain financial freedom by owning stocks that should grow dividends over time, meaningfully and sustainably, then you are at the right place.
The market is not easy to navigate, even during the best of times. At the same time, we do not want to lose our sleep over our investments. So, it’s all the more important that we invest in companies that have many years of dividend history, pay growing and sustainable dividends, and have low or manageable levels of debt. We remain on the lookout for such companies when they are trading cheap on a relative basis to the broader market as well as to their respective 52-week highs. We believe in keeping a buy list handy and dry powder ready so that we can use the opportunity when the time is right. Besides, we think, every month, this analysis is able to highlight some companies that otherwise would not be on our radar.
This article is part of our monthly series, where we scan the entire universe of roughly 7,500 stocks that are listed and traded on US exchanges, including over-the-counter (OTC) networks. However, our focus is limited to dividend-paying stocks. We usually highlight five stocks that may have temporary difficulties or lost favor with the market and offer deep discounts on a relative basis. However, that’s not the only criteria that we apply. While seeking cheaper valuations, we also demand that the companies have an established business model, solid dividend history, manageable debt, and investment-grade credit rating. Please note that these are not recommendations to buy but should be considered as a starting point for further research.
This month, we highlight three groups of five stocks each that have an average dividend yield (as a group) of 4.29%, 5.72%, and 7.05%, respectively. The first list is for conservative and risk-averse investors, while the second one is for investors who seek higher yields but still want relatively safe investments. The third group is for yield-hungry investors but comes with an elevated risk, and we urge investors to exercise caution.
Notes: 1) Please note that when we use the term “safe” regarding stocks, it should be interpreted as “relatively safe” because nothing is absolutely safe in investing. Also, in our opinion, for a well-diversified portfolio, one should have 15-20 stocks at a minimum.
2) All tables in this article are created by the author unless explicitly specified. The stock data have been sourced from various sources such as Seeking Alpha, Yahoo Finance, GuruFocus, and CCC-List (dripinvesting).
Goals For the Selection Process
Note: Regular readers of this series could skip this section to avoid repetitiveness. However, we include this section for new readers to provide the necessary background and perspective.
We start with a fairly simple goal. We want to shortlist five companies that are large-cap, relatively safe, dividend-paying, and trading at relatively cheaper valuations in comparison to the broader market. The objective is to highlight some of the dividend-paying and dividend-growing companies that may be offering juicy dividends due to a temporary decline in their share prices. The excess decline may be due to an industry-wide decline or some kind of one-time setbacks like some negative news coverage or missing quarterly earnings expectations. We adopt a methodical approach to filter down the 7,500-plus companies into a small subset.
Our primary goal is income that should increase over time at a rate that at least beats inflation. Our secondary goal is to grow the capital and provide a cumulative growth rate of 9%-10% at a minimum. These goals are by and large in alignment with most retirees and income investors as well as DGI investors. A balanced DGI portfolio should keep a mix of high-yield, low-growth stocks along with some high-growth but low-yield stocks. That said, how you mix the two will depend upon your personal situation, including income needs, time horizon, and risk tolerance.
A well-diversified portfolio would normally consist of more than just five stocks and preferably a few stocks from each sector of the economy. However, in this periodic series, we try to shortlist and highlight just five stocks that may fit the goals of most income and DGI investors. But at the same time, we try to ensure that such companies are trading at attractive or reasonable valuations. However, as always, we recommend you do your due diligence before making any decision on them.
Selection Process
The S&P 500 currently yields less than 1.30%. Since our goal is to find companies for a dividend income portfolio, we should logically look for companies that pay yields that are at least similar to or better than the S&P 500. Of course, the higher, the better, but at the same time, we should not try to chase very high yields. If we try to filter for dividend stocks paying at least 1.30% or above, nearly 2,000 such companies are trading on US exchanges, including OTC networks. We will limit our choices to companies that have a market cap of at least $10 billion and a daily trading volume of more than 100,000 shares. We also will check that dividend growth over the last five years is positive, but there can be some exceptions.
We also want stocks that are trading at relatively cheaper valuations. But at this stage, we want to keep our criteria broad enough to keep all the good candidates on the list. So, we will measure the distance from the 52-week high but save it to use at a later stage.
Criteria to Shortlist
- Market cap > $10 billion
- Dividend yield > 1.25%
- Daily average volume > 100,000
- Dividend growth past five years >= 0.
By applying the above criteria, we got roughly 500 companies.
Narrowing Down the List
As a first step, we would like to eliminate stocks that have less than five years of dividend growth history. We cross-check our current list of nearly 500 stocks against the list of so-called Dividend Champions, Contenders, and Challengers originally defined and created by David Fish. Generally, the stocks with more than 25 years of dividend increases are called dividend Champions, while stocks with more than ten but less than 25 years of dividend increases are termed, Contenders. Further, stocks with more than five but less than ten years of dividend increases are called Challengers.
After we apply this filter, we’re left with 246 companies on our list. However, so far in this list, we have demanded five or more years of consistent dividend growth. But what if a company had a very stable record of dividend payments but did not increase the dividends from one year to another. At times, some of these companies are foreign-based companies, and due to currency fluctuations, their dividends may appear to have been cut in US dollars, but in reality, that may not be true at all when looked at in the actual currency of reporting. At times, we may provide some exceptions when a company may have cut the dividend in the past but otherwise looks compelling. So, by relaxing some of the conditions, a total of 71 additional companies were considered to be on our list. We call them category ‘B’ companies. After including them, we had a total of 317 (246+71) companies that made our first list.
We then imported the various data elements from many sources, including CCC-list, GuruFocus, Fidelity, Morningstar, and Seeking Alpha, among others, and assigned weights based on different criteria as listed below:
- Current yield: Indicates the yield based on the current price.
- Dividend growth history (number of years of dividend growth): This provides information on how many years a company has paid and increased dividends on a consistent basis. For stocks under the category ‘B’ (defined above), we consider the total number of consecutive years of dividend paid rather than the number of years of dividend growth.
- Payout ratio: This indicates how comfortably the company can pay the dividend from its earnings. We prefer this ratio to be as low as possible, which would indicate the company’s ability to grow the dividend in the future. This ratio is calculated by dividing the dividend amount per share by the EPS (earnings per share). The cash-flow payout ratio is calculated by dividing the dividend amount paid per share by the cash flow generated per share.
- Past five-year and 10-year dividend growth: Even though it’s the dividend growth rate from the past, this does indicate how fast the company has been able to grow its earnings and dividends in the recent past. The recent past is the best indicator that we have to know what to expect in the next few years.
- EPS growth (average of previous five years of growth and expected next five years growth): As the earnings of a company grow, more than likely, dividends will grow accordingly. We will take into account the previous five years’ actual EPS growth and the estimated EPS growth for the next five years. We will add the two numbers and assign weights.
- Chowder number: So, what’s the Chowder number? This number has been named after well-known SA author Chowder, who first coined and popularized this factor. This number is derived by adding the current yield and the past five years’ dividend growth rate. A Chowder number of “12” or more (“8” for utilities) is considered good.
- Debt/equity ratio: This ratio will tell us about the debt load of the company in relation to its equity. We all know that too much debt can lead to major problems, even for well-known companies. The lower this ratio, the better it is. Sometimes, we find this ratio to be negative or unavailable, even for well-known companies. This can happen for a myriad of reasons and is not always a reason for concern. This is why we use this ratio in combination with the debt/asset ratio (covered next).
- Debt/asset ratio: This ratio will tell us about the debt load in relation to the total assets of the company. In almost all cases, this ratio would be lower than the debt/equity ratio. Also, this ratio is important because, for some companies, the debt/equity ratio is not a reliable indicator.
- S&P’s credit rating: This is the credit rating assigned by the rating agency S&P Global and is indicative of the company’s ability to service its debt. This rating can be obtained from the S&P website.
- PEG ratio: This also is called the price/earnings-to-growth ratio. The PEG ratio is considered to be an indicator if the stock is overvalued, undervalued, or fairly priced. A lower PEG may indicate that a stock is undervalued. However, PEG for a company may differ significantly from one reported source to another, depending on which growth estimate is used in the calculation. Some use past growth, while others may use future expected growth. We’re taking the PEG from the CCC list wherever available. The CCC list defines it as the price/earnings ratio divided by the five-year estimated growth rate.
- Distance from 52-week high: We want to select companies that are good, solid companies but also are trading at cheaper valuations currently. They may be cheaper due to some temporary down cycle or some combination of bad news or simply having a bad quarter. This criterion will help bring such companies (with a cheaper valuation) near the top, as long as they excel in other criteria as well. This factor is calculated as (current price – 52-week high) / 52-week high.
- Sales or Revenue growth: This is the average growth rate in annual sales or revenue of the company over the last five years. A company can only grow its earnings power as long as it can grow its revenue. Sure it can grow the earnings by cutting costs, but that can’t go on forever.
Below we provide a table (as a downloadable Excel spreadsheet) with weights assigned to each of the ten criteria. The table shows the raw data for each criterion for each stock and the weights for each criterion, and the total weight. Please note that the table is sorted on the “Total Weight” or the “Quality Score.” The list contains 317 names and is attached as a file for readers to download:
File-for-export_-_5_Safe_DGI_-_April_2022.xlsx
Selection of the Final 30
To select our final 30 companies, we will follow a multi-step process:
We will first bring down the list to roughly 50 names by automated criteria, as listed below. In the second step, which is mostly manual, we will bring the list down to about 30.
- Step 1: We will first take the top 20 names in the above table (based on total weight or quality score).
- Step 2: Now, we will sort the list based on dividend yield (highest at the top). We take the top 10 after the sort to the final list. We only take the top three from any single industry segment because, otherwise, some of the segments, like energy, tend to overcrowd (selected 11 names).
- Step 3: We will sort the list based on five-year dividend growth (highest at the top). We will take the top 10 after the sort to the final list.
- Step 4: We will then sort the list based on the credit rating (numerical weight) and select the top 10 stocks with the best credit rating. However, we only take the top two or three from any single industry segment because, otherwise, some of the segments tend to overcrowd.
- Step 5: We will also select ten names that have the largest discount from their 52-wk highs, as long as they meet other criteria.
From the above steps, we had a total of 61 names in our final consideration. The following stocks appeared more than once:
Appeared two times: ADP, BBY, BLK, LEN, RIO, SWK, TXN (7 duplicates)
After removing seven duplicates, we are left with 54 names.
Since there are multiple names in each industry segment, we will just keep a maximum of three or four names from the top of any one segment. We keep the following:
Financial Services, Banking, and Insurance:
Banking- Regional: (RF)
Financial Services – Others: (BLK), (BEN), (TROW)
Insurance:
Business Services:
(ADP)
Conglomerates:
(IEP)
Industrials:
Chemicals:
(APD)
Materials/Mining/Gold:
Materials:
Mining (other than Gold): (RIO), (SCCO), (BHP)
Gold: (NEM)
Defense:
None
Consumer/Retail/Others:
Cons-defensive:
Cons-discretionary: (LEN), (SBUX), (MGA), (VFC)
Cons-Retail: (LOW), (TGT), (HD), (BBY)
Communications/Media:
(SIRI)
Healthcare:
Technology:
Energy:
Pipelines/ Midstream: (MPLX), (ENB), (MMP)
Oil & Gas: (XOM), (CTRA), (IMO)
Utilities:
(NRG)
REIT:
TABLE-1: List of Top 30 in the order of Total Quality Score (Total Weight)
Author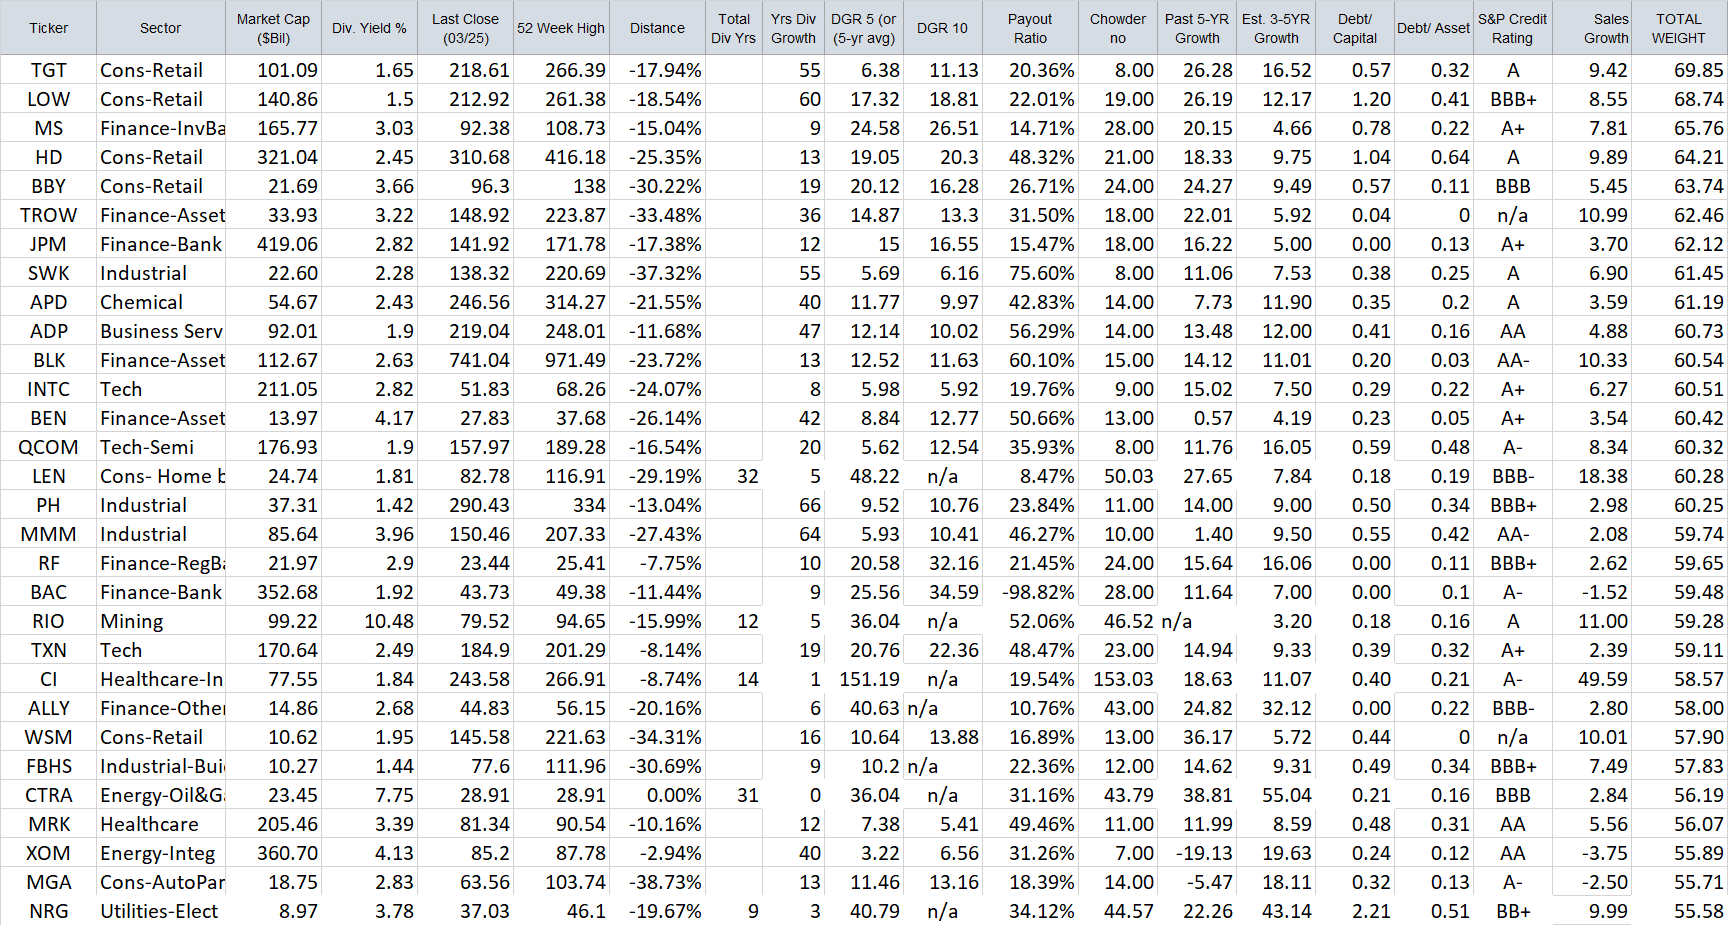
Final Step: Narrowing Down to Just Five Companies
This step is mostly a subjective one and is based solely on our perception. The readers could certainly differ from our selections, and they may come up with their own set of five companies with a target yield, but they should pay attention to keeping the group diversified among different sectors or industry segments. Below, we make three lists for different sets of goals, dividend income, and risk levels. We try to make each of the groups highly diversified and try to ensure that the safety of dividends matches the overall risk profile of the group. Nonetheless, here are our three final lists for this month:
Final A-List (Conservative Safe Income):
Average yield: 4.29%
Table-2A: A-LIST (Conservative Income)
Author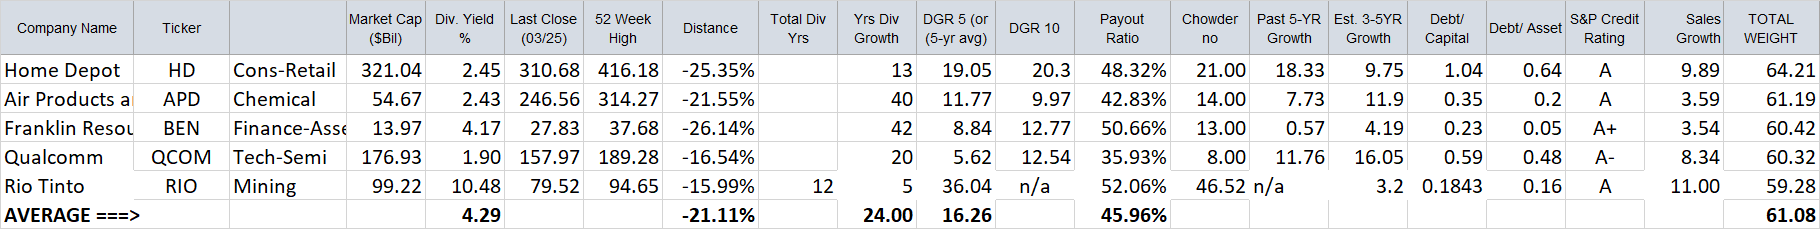
We think this set of five companies (in the A-List) would form a solid diversified group of dividend companies that would be appealing to income-seeking and conservative investors, including retirees and near-retirees. The average yield is very decent at 4.29% compared to 1.3% of the S&P 500. The average dividend growth history is roughly 24 years, and all of the companies have a credit rating of “A-” or better. The average discount from a 52-week high is very high for these stocks at 21%.
We have two dividend aristocrats (APD, BEN) on the list who have paid and increased dividends over 25 years. Two other companies, HD and QCOM too, have consistent dividend records as well.
RIO Tinto: Now, a few words about RIO Tinto. RIO was recommended last month as well. Also, we may like to mention that it was first recommended by this series a few months at much lower prices, and since then, the stock price has moved up by about 20%. So, it is not a bargain as it was then. But we think it is still faired-valued at current levels. It is also a good buy in the inflationary environment that we are in currently. The current bout of Inflation is not transitory, so stocks like RIO may be a good choice as a hedge against inflation. However, investors should be aware that its dividend record is not very consistent, and it pays a semi-annual variable dividend that can change depending on market conditions. That said, RIO has paid dividends continuously for the last 12 years. At the same time, currently, the yield is very high at over 10%. Even though there is no indication of a dividend cut but since it has a variable dividend policy, and if we were to assume that the dividend amount in the year 2023 comes down by 20%, the yield would still be > 8% at the current prices.
The A-List is for conservative and risk-averse investors, and that’s the reason the average dividend yield is reasonable but not very high. However, if you must need higher dividends, consider B-List or C-List, as presented below.
Final B-List (High Yield, Moderately Safe):
Average yield: 5.72%
- (HD)
- (BEN)
- (RIO)
- (ENB)
- (GSK)
Note: Very often, we include a few low-risk stocks in B-List and C-list. Also, oftentimes, a stock can appear in multiple lists. This is done on purpose. We try to make each of our lists fairly diversified among different sectors/industry segments of the economy. We try to include one or two highly conservative names in the high yield list to make the overall group much safer.
Table-2B: B-LIST (High Yield)
Author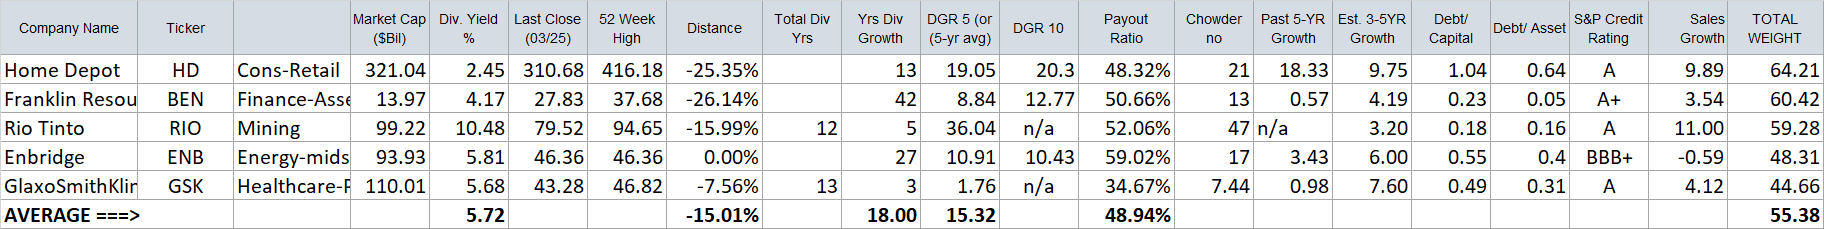
In the B-List, the overall risk profile of the group becomes slightly elevated compared to A-List. That said, the group will likely provide safe dividends for many years.
This list offers an average yield for the group of 5.72%, an average of 18 years of dividend growth history, and quite high past dividend growth. In this list, we selected HD and BEN for the discount they offer compared to their 52-week highs. RIO and ENB were included for high yield and protection against the inflationary environment and high energy prices. GSK was included for sector diversification as well as for high but relatively safe dividends.
Final C-LIST (Yield-Hungry, Less Safe):
Average yield: 7.05%
Notes:
Note 1: Please pay attention that MMP is an MLP (Master Limited Partnership) and issues form K-1 at tax time instead of regular 1099-Div. Please use your due diligence.
Note 2: Oftentimes, a stock can appear in multiple lists. We try to include one or two conservative names in the high yield list to make the overall group much safer.
Table-2C: C-LIST (Yield-Hungry, Elevated Risk)
Author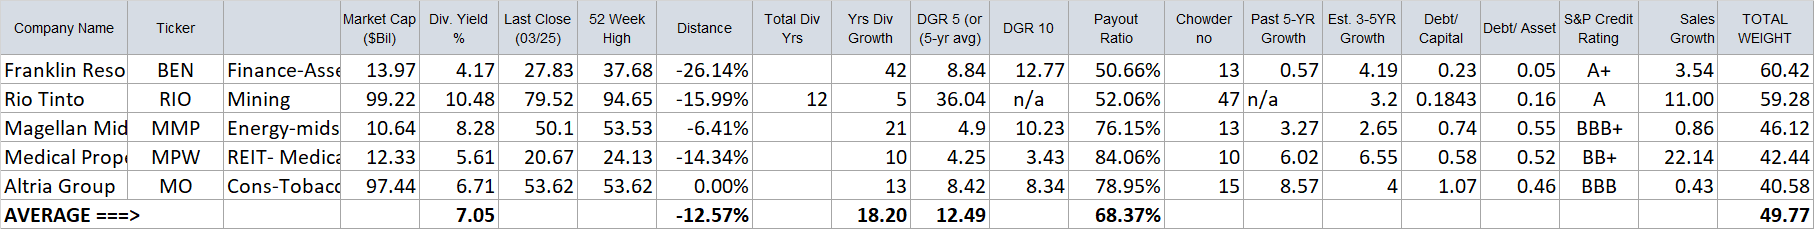
The C-List includes two stocks (BEN and RIO) with high credit ratings (A or higher), whereas the other three have investment-grade ratings. All five names provide reasonably high yields.
MPW is a medical REIT, and its yield is quite attractive at 5.6%. The overall group is very diversified, and that makes it reasonably safe.
Apparently, this list (C-List) is for yield-hungry DGI investors, so we urge due diligence to determine if it would suit your personal situation. Nothing comes free, so there will be more risk involved with this group. That said, it’s a highly diversified group spread among five different sectors. The average yield for the group of five goes up to 7.05%.
We may like to caution that each company comes with certain risks and concerns. Sometimes these risks are real, but other times, they may be a bit overblown and temporary. So, it’s always recommended to do further research and due diligence.
Conclusion
In the first week of every month, we start with a fairly large list of dividend-paying stocks and filter our way down to just a handful of stocks that meet our selection criteria and income goals. In this article, we have presented three groups of stocks (five each) with different goals in mind to suit the varying needs of a wider audience. Even though the risk profile of each group is different, each group in itself is fairly balanced and diversified.
The first group of five stocks is for highly conservative investors who prioritize the safety of the dividend and preservation of their capital. The second group reaches for a higher yield but with only a slightly higher risk. However, the C-group comes with an elevated risk and is certainly not suited for everyone.
This month, the first group yields 4.29%, while the second group elevates the yield to 5.72%. We also presented a C-List for yield-hungry investors with a 7.05% yield. We believe the first two groups of five stocks each make an excellent watch list for further research and buying at an opportune time.
Be the first to comment