

Eoneren/E+ via Getty Images
U.S. indexes began the week largely unchanged as investors held steady ahead of a flood of earnings releases and economic data that were released later in the week. After the close on Monday, Walmart, Inc (WMT) released a profit warning noting that higher prices for food and fuel were causing consumers to pull back on spending. This sent shares down nearly 10% in after-hours trading.
The decline in WMT weighed on the DJIA on Tuesday, which closed 230 points lower, and other retail-specific names, such as Target (TGT), which finished nearly 4% lower on the day. Though the tech-heavy Nasdaq was also down over 200 points, the S&P finished largely unchanged as investors continued to parse through earnings while waiting for the pending rate decision from the Federal Reserve.
Markets rallied higher on Wednesday following better-than-feared earnings results from Microsoft (MSFT) and Alphabet (GOOG) in Tuesday’s after-hours session. The gains in the two contributed to the Nasdaq’s biggest one-day percentage gain in more than two years, up over 450 points at close. While some names, such as Sherwin-Williams (SHW) dragged the broader S&P to more neutral levels, the three indexes rallied higher following the Fed’s rate decision and subsequent commentary from Chairman Jerome Powell.
Stocks continued building on gains on Thursday, despite the release of the Commerce Department’s GDP report, which showed that GDP fell at an inflation and seasonally adjusted annual rate of 0.9% in the second quarter, its second straight quarterly contraction.
Key earnings releases from Amazon (AMZN), Apple (AAPL), and Intel (INTC) in Thursday’s after-hours session sent futures modestly higher, led by a 12% gain in shares in AMZN, offset by a nearly 10% decline in INTC. Heading into Friday, indexes were primed for strong monthly gains, with all three major averages up at least 8% from their 2022 lows in mid-June.
Still, there are five laggards this week that are on the other side of this trend, with most trading at or near their lows following disappointing earnings results. For long-term investors, the pullback in these laggards may warrant additional examination.
Hasbro, Inc (HAS)
HAS is a global play and entertainment company with a portfolio of approximately 1,500 brands, including Nerf, Play-Doh, Power Rangers, and Monopoly, to name a few.
In the full-year ended December 31, 2021, the company reported total revenues of +$6.4B and earned $3.10 per diluted share. In addition, they generated +$685M in free cash flow (“FCF”), a portion of which was paid out as dividends. At present, the annual payout is $2.80/share, which represents a yield of about 3.5% at current pricing. With FCF coverage of 1.4x, the payout appears safe for the foreseeable future.
In the most recent quarterly filing period, HAS reported total revenues of +$1.3B. This was up 1.5% from the same period last year but +$30M shy of estimates. Excluding currency effects, revenues were up 4%. In addition, they reported 14% growth in adjusted operating profit and 200 basis points (“bps”) of margin expansion, contributing to 6% growth in adjusted EBITDA and an earnings beat.
While some viewed the results as mixed, the fundamentals of the company appear solid with a business model that has proved resilient in the past. Down nearly 25% YTD, shares are significantly underperforming the broader S&P 500 index and close peer, Mattel (MAT), who was up about 2% YTD through Wednesday. At its lows, HAS is worth further consideration.
YCharts – YTD Comparative Returns of MAT and HAS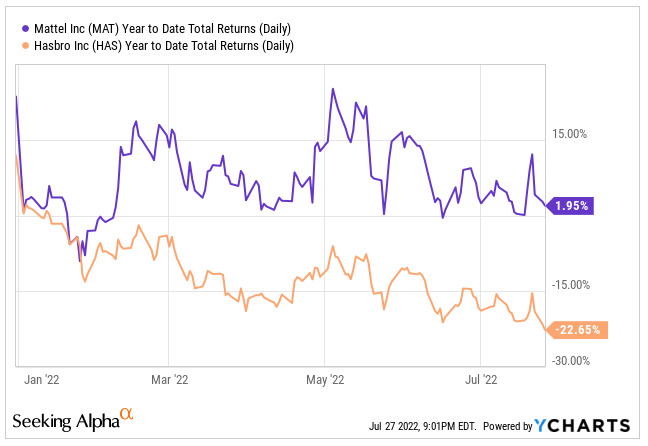
Verizon Communications Inc. (VZ)
VZ is a world leader in providing communications, technology, information, and entertainment products and services to consumers, businesses, and government entities. While the company has a dominant market share, their stock price has remained stuck in a narrow range for a number of years, trading as low as $41 prior to 2014 to a high of $62 just prior to the start of the COVID-19 pandemic.
YCharts – VZ’s Long-Term Share Price History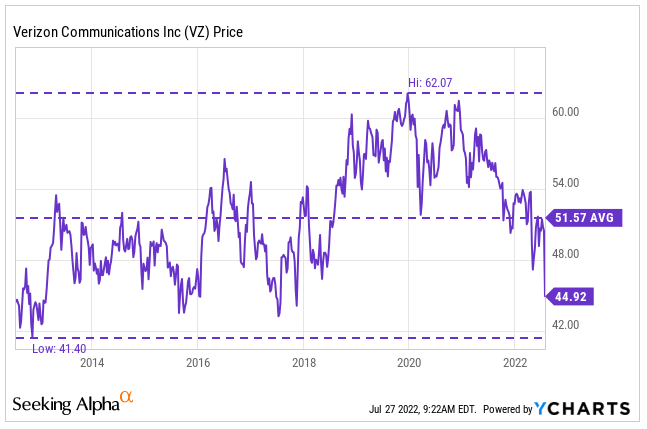
Presently, shares are down to multi-year lows following a disappointing earnings release. In the report, VZ reported a gain of 12k postpaid phone connections. In contrast, rival AT&T (T) reported a gain of 813k connections over the same time span.
In addition, the weaker than expected additions compelled management to raise rates for some mid-price plans in June. With consumers already pinched from rising food and energy costs, there is a heightened risk of increased churn in the months ahead.
Weak guidance that called for wireless-service revenue growth of 8.5% to 9.5% in 2022, down from its earlier forecast of a 9% to 10% increase, also added to investor pessimism.
Down to new 52-week lows at prices last seen almost five years ago, there is certainly room for upside in shares of this beaten down component of the DJIA. With a dividend yield near 6% and a solid track record of consistent growth, there is even further incentive for income-focused investors. A second look into the earnings release would be worth the effort for any investor seeking a quality DJIA component for their long-term portfolios.
The Sherwin-Williams Company (SHW)
SHW develops, manufactures, and sells paint, coatings, and related products to a wide group of end users primarily in North and South America, with additional operations in the Caribbean region, Europe, Asia, and Australia. Some notable brands and tradenames of the company include Sherwin-Williams, Cabot, HGTV HOME by Sherwin-Williams, PaintSheild, SuperDeck, and Sher-Wood, among many others.
Over the years, SHW has had a long track record of delivering market-beating shareholder returns, with an annualized 10-year total return of 20% compared to the S&P’s 13%. In addition, the company has consistently increased their dividend at double-digit growth rates. Over the last five years, for example, the dividend has grown at a compound annual growth rate (“CAGR“) of 15%.
YCharts – Annualized 10-Yr Returns of SHW Compared to S&P 500
YTD, however, shares are down 27% against a decline of 17% in the broader index.
YCharts – YTD Comparative Returns of SHW and S&P 500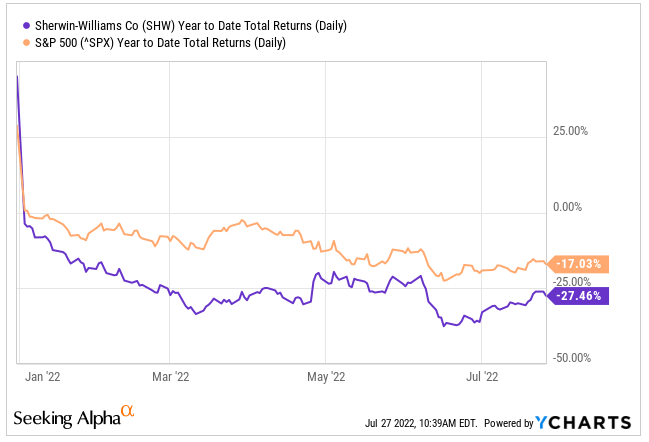
Shares came under heightened selling pressure on the day of their earnings release, which, though not a total disappoint, did come with the pairing of full-year guidance. This sent shares tumbling 12% to new 52-week lows. At 25x forward earnings, shares aren’t the largest value addition. Nevertheless, a double-digit decline may present an opportunity to average down on existing holdings.
The Kraft Heinz Company (KHC)
KHC is the third largest food and beverage company in North America and the fifth largest in the world, with eight +$1B brands. Some brands included in their portfolio include Oscar Meyer, Jell-O, Kool-Aid, and Kraft Mac & Cheese. These household names are just a few among the numerous global brands owned by KHC.
In the most recent quarterly filing period, KHC reported total net sales of +$6.6B. While this was down about a percent from last year on an overall basis, organic net sales were up 10.1%, driven by favorable pricing-related tailwinds. This resulted in a revenue beat of +$190M. In addition, net earnings also came in better than expected, beating by $0.02/share.
Though higher prices contributed favorably to reported sales, volumes were down by 2.3%. Supply-chain related constraints also impacted sales volume during the quarter, according to management.
While the overall release contained numerous positives, including strong guidance that featured upward revisions to full-year organic sales to a high-single-digit percentage increase versus the prior year period, as compared to previous expectations of a mid-single-digit percentage increase, investors sold off shares following the release, perhaps due to declining FCFs, which were down 78% from the prior year.
YTD, shares are essentially unchanged but are underperforming the broader S&P. At about 13.9x forward earnings, KHC is trading near their five-year averages but at a discount to some other names in the industry, such as The Hershey Company (HSY) and General Mills (GIS), who are trading at 27.6x and 18.7x, respectively. Following the pullback, shares certainly appear worthy of a second look.
Seeking Alpha – KHC’s P/E Ratio Compared to Competitors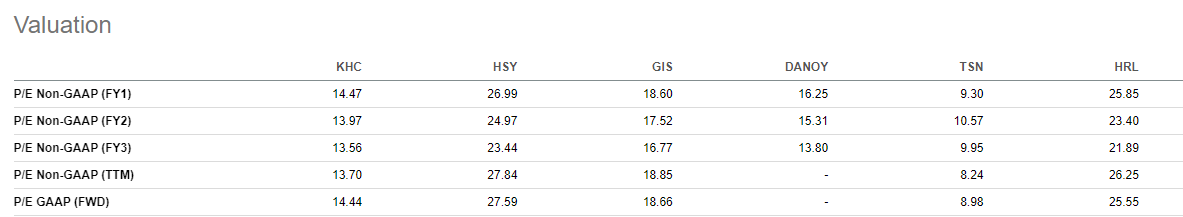
Garmin Ltd. (GRMN)
GRMN offers a broad range of products and solutions utilizing GPS and other global navigation satellite systems designed for people who live an active lifestyle. Their devices are compatible with many applications, including fitness, outdoor recreation, aviation, and marine, among others.
The company’s annual sales were approximately +$5B at the end of 2021, with net earnings of about +$1.1B. In addition, they generated positive operating cash flows of +$1B and FCF of +$700M that covered their annual dividend payment by 1.4x.
In the quarter ended March 31, 2022, GRMN reported total net sales of +$1.2B. This was down 6% from the prior year and +$130M short of estimates. Additionally, margins were pressured, with operating margins down 440bps from the same period last year.
Declines in the Fitness segment dragged results during the current period, down 34% YOY, led by decreased sales of advanced wearables and cycling-related products. Despite the underperformance, the company still introduced new products, such as their refreshed line of Forerunners.
Q1FY22 Investor Presentation – Summary of Q1FY22 Operating Results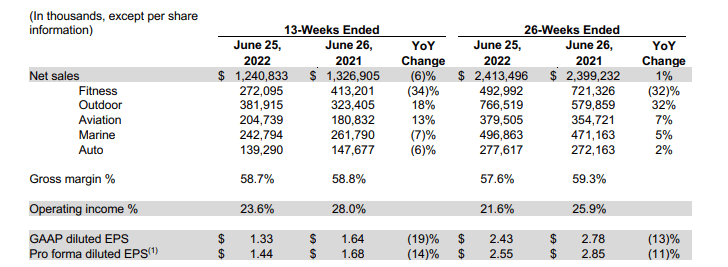
Though the company is facing continued macro-related headwinds, they do have a diversified business model with many different product offerings. This keeps risk levels within reason. While the Fitness segment was down 34%, for example, a 31% gain in Outdoor and Aviation largely offset those losses. Additionally, management retained guidance for revenue growth for the year, which is expected to come in at 5%. With shares at new lows and their earnings release behind them, investors may benefit from a deeper dive into GRMN.
Conclusion
A busy week in the U.S. market comprised of a flood of earnings releases and economic data sent many shares significantly higher or lower, depending on investor sentiment following these catalysts. Four of this week’s laggards reported earnings or provided guidance that disappointed investors. And their shares were punished, accordingly.
For some, however, the pullback appears overdone. VZ, for example, is now trading at multi-year lows with a dividend yield near 6%. For others, the decline may have been warranted, given their current valuations, such as SHW, who is still trading at 25x forward earnings even after their one week decline of about 5%.
Still, each laggard this week has characteristics that should enable an eventual rebound, namely their market position as industry leaders and their ability to generate strong cash flows and to return any excess to shareholders via dividends or buybacks. As such, a further look into any of this week’s laggards would be time well spent.
Be the first to comment