

phototechno/iStock via Getty Images
U.S stocks began the compressed holiday week on a sour note as investors assessed a multitude of uncertainties, including strict COVID mitigation efforts in China, continuing upheaval in Europe, and rapidly increasing interest rates, with the yield on the 10-year benchmark hitting 2.779% on Monday, its highest since 2019.
Indexes were further pressured on Tuesday following data that showed inflation rising to 8.5% in March. This was followed by the reiteration from various Fed governors of the need to aggressively take on inflation, signaling interest rate increases in increments of half a percentage point at subsequent meetings. Data within the report, however, suggested that inflation could begin to cool off, with the core reading rising at the slowest pace in six months, driven by a 3.8% decline in used vehicle prices. This positive observation offset some of the losses for the day.
Markets rebounded on Wednesday as the first batch of earnings were released from the airlines and the banks. Airline stocks rallied after a strong release from Delta Air Lines (DAL), while banks declined after underwhelming results from JPMorgan (JPM). Strong bookings for airfare and commentary from JPM indicate the underlying health of the consumer is strong, but vulnerable to heightened risks in the economy, such as from rising prices. This exposure is not only on consumer goods but also on producers, as indicated by the release of the producer price index, which rose by 11.2% from the prior year.
Equities appeared on track to end the shortened week on a mixed note, with investors left to digest a slew of various reports, including retail sales, consumer sentiment, jobless claims, and more earnings from the big banks. Jobless claims ticked up slightly but were still at historical lows. Furthermore, retail sales increased during March, but the gains were primarily driven by higher gasoline prices. Finally, rates on mortgages hit 5% for the first time since 2011. Despite the weak data, the DJIA was up at mid-day trading and the S&P was little changed.
Among individual stocks, shares in Twitter (TWTR) saw increased activity from Elon Musk’s decision not to join the board of TWTR on Monday and his subsequent offer on Thursday to buy the company outright.
The week offered potential buying opportunities on many stocks. For long-term, income-focused investors who seek upside at reasonable risk, there are five stocks this week that would fit well on the watchlist of any diversified portfolio.
Corning Incorporated (GLW)
GLW is a leading innovator in materials science that operates in five reportable segments: Display Technologies; Optical Communications; Specialty Materials; Environmental Technologies; and Life Sciences.
In 2021, the company reported +$14.1B in total net sales, nearly 60% of which were attributable to the Display Technologies and Optical Communications segments. Compared to 2020, total net sales were up over 20% and net income margins were also higher, despite the inflationary operating environment.
GLW Sales Disaggregation – Form 10-K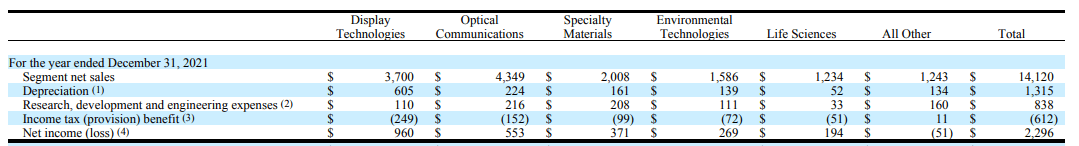
Within the Display Technologies segment, GLW is the largest worldwide producer of glass substrates for flat panel display glass. Furthermore, the company maintains a leadership position in the principal products of their Optical Communications Segment, which include carrier and enterprise networks. Their size and scale in these two largest segments are a competitive advantage when compared against their peers.
At the end of 2021, GLW had +$2.1B in cash on hand, which represented 30% of total current assets. Additionally, the company’s debt load is low at less than 2x EBITDA and with no significant near-term maturities. The financial flexibility enables the company to deploy cash to growth opportunities and return any excess to shareholders via buybacks and dividends.
The current annual dividend is $1.08, and it has been growing at a 5-year CAGR of 12%. In addition, the payout accounts for less than 50% of net income and is fully covered by both operating and free cash flows. Even when including buyback activity, total payouts are still fully covered and appear safe for the foreseeable future.
Author’s Summary of GLW’s Cash Flow Statement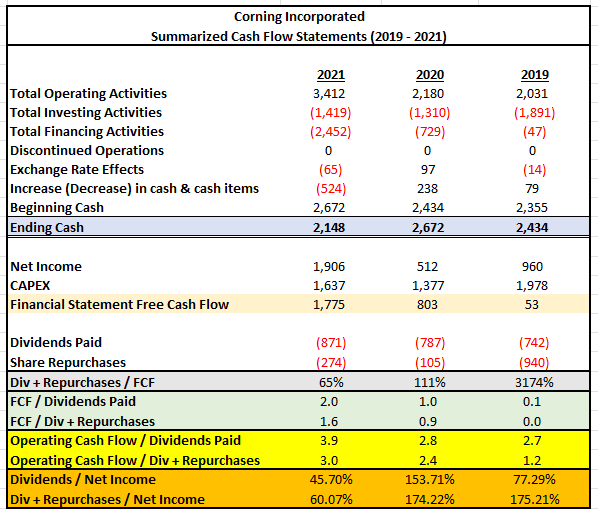
GLW is currently trading at 14x forward earnings versus a historical average of 17.5x. Furthermore, their dividend is currently yielding 3.2%, which is on the higher end of past payouts. At normalized multiples, shares should be trading at around $42, which would indicate upside of over 20%.
JPMorgan Chase & Co (JPM)
Shares in JPM declined to a new 52-week low after reporting on Q1FY22 earnings. Some of the negative aspects of the report include lower than expected loan growth and lower investment banking fees, which partly contributed to the 42% decline in net income from the same period last year. Additionally, investors were warned that rising inflation and continuing geopolitical conflicts are major threats to the U.S. economy.
All was not negative, however. Net interest income was up 8% from last year, and this is expected to rise significantly in future periods along with interest rates. Furthermore, trading revenue was down just 3% from a record quarter in the prior year. The drop in net income also needs to be put into context with the significant noncash adjustments in the prior year, such as the large benefit the company received from the release of reserves. This compares to the build-up in the current year relating to exposure to Russia and the slightly higher chance of a recession in the U.S.
JPM Total Revenue Summary – Q1FY22 Earnings Release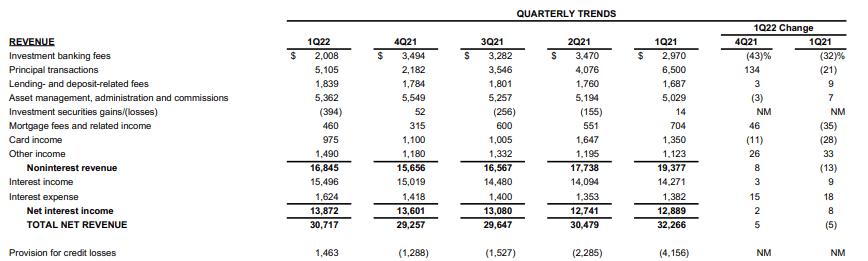
Over the past ten years, JPM’s performance has generally tracked the broader S&P, but has had periods of significant outperformance.
YCharts – JPM Annualized 10-YR Returns Compared to S&P 500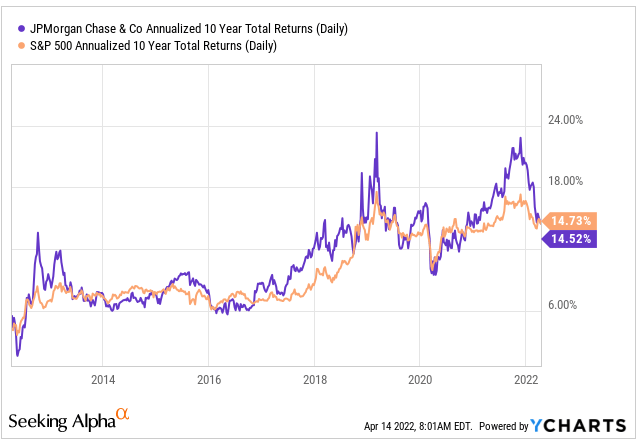
Over the past three months, however, JPM is down nearly 25% versus a decline of only 4% for the S&P.
YCharts – JPM 3-MTH Total Returns Compared to S&P 500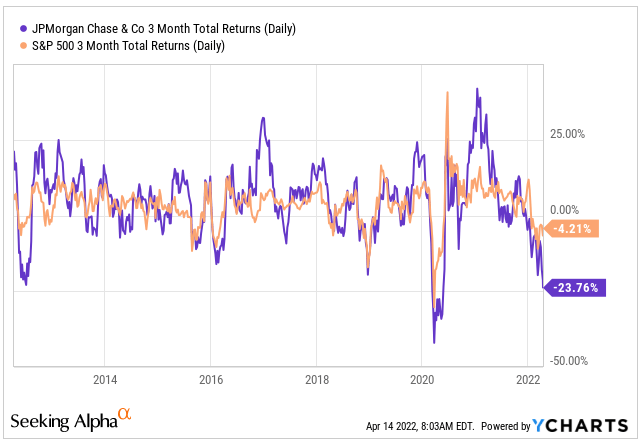
Performance against the KBW ETF, which includes other relatable bank holdings has also lagged by a wide margin over the past three months.
YCharts – JPM – 3-MTH Total Returns Compared to KBW ETF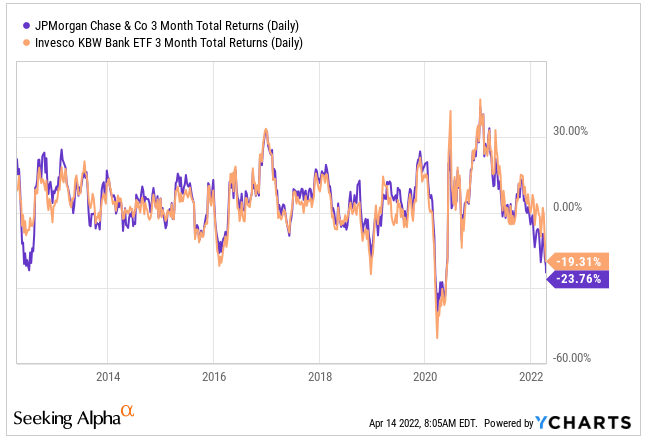
This is despite consistent outperformance over the past five years.
YCharts – JPM – Annualized 5-YR Total Returns Compared to KBW ETF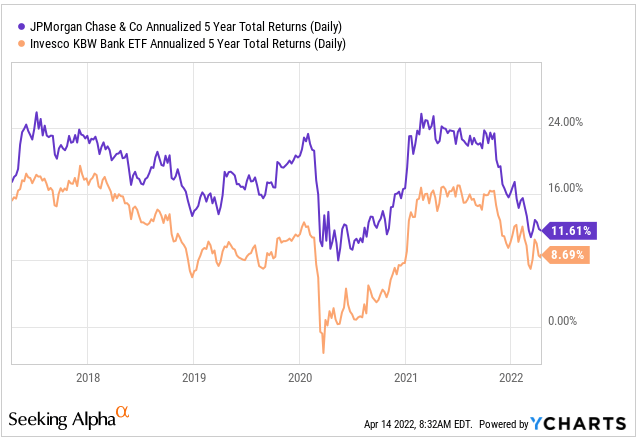
Based on the RSI, it appears the decline in JPM is overdone, with shares rapidly returning to oversold territory.
YCharts – JPM RSI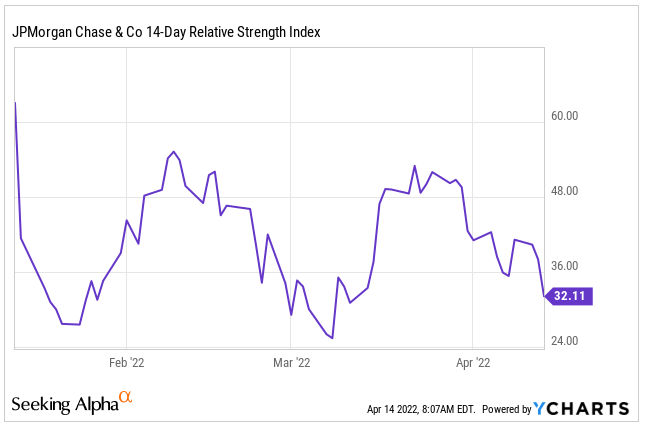
An economy that avoids recession will be a benefit to JPM in an environment with rising interest rates. Furthermore, loan growth should improve as consumers spend through their savings. Additionally, home and auto loans, both of which declined in the current period, should begin to increase as inventory catches up to demand. This will further benefit JPM’s core business. At its 52-week lows in oversold territory, JPM certainly is worth a second look.
Omega Healthcare Investors, Inc (OHI)
OHI is a REIT in the long-term healthcare industry that focuses on skilled nursing facilities (SNFs), assisted living facilities (ALF), and independent living facilities (ILF), among others. Their core portfolio consists of long-term leases and mortgage agreements. Their leases to their operators are structured as “triple-net”, which relieves the company of property-related expenses. Their mortgage agreements generate revenue from fixed rate mortgage loans, which are secured by first mortgage liens and personal property of the mortgagor.
At the end of December 31, 2021, the company had a total operating asset portfolio of 939 facilities with approximately 96,000 operating beds. These assets are spread out among 42 states and the United Kingdom. Within the U.S., OHI is geographically diversified but has nearly 25% of its facilities in Florida and Texas. Overall occupancy continued to trend up in 2021, reaching a high of 75.8%, which was up from their low of 72.3% in January of 2021. Importantly, 21% of their facilities were at or above pre-COVID occupancy levels, which indicates full occupancy recovery is attainable in the future.
Shares in the company were trending steadily higher until 2020. Since then, it hit a low of about $15 and is currently trading about 40% below their highs prior to COVID. Additionally, shares are trading below their five-year average of $33.
YCharts – OHI Price History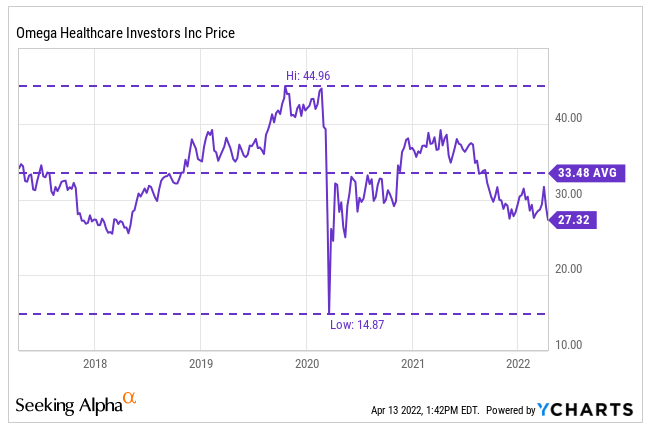
The past month has been a volatile period for the stock. At one point, shares in the company rallied to the point of overbought territory, as indicated by the RSI, and then quickly dropped to its current level, which is on the cusp of being considered oversold.
YCharts – OHI RSI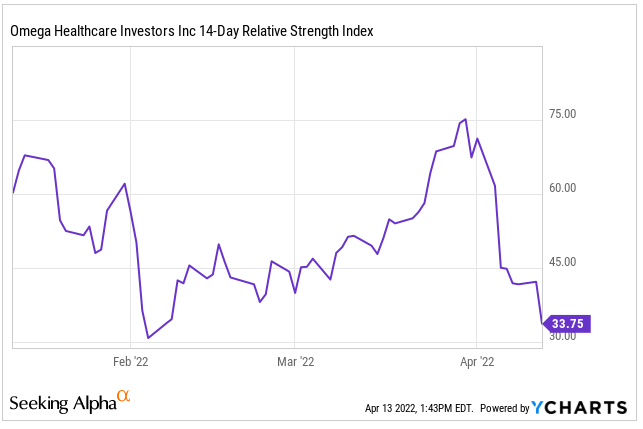
OHI has been severely affected by the labor shortage, and this has negatively impacted the operations of many of their facilities. In addition, the company is working through liquidity and restructuring issues with several of their operators. These concerns have kept shares at their lows, despite the favorable long-term outlook for skilled nursing facilities.
OHI is well-positioned to weather the short-term challenges. The company has a conservative capitalization policy that includes +$1.45B available in their credit facility and no material maturities until 2023. In addition, the company currently pays an annual dividend of $2.68, which is a yield of nearly 10% at current pricing. At a forward P/FFO multiple of 10x, this REIT is worth a look.
Pentair (PNR)
PNR is a residential and commercial water treatment company that operates in two reportable segments: Consumer Solutions and Industrial & Flow Technologies.
In 2021, the company reported +$3.8B in total net sales, which was 25% greater than 2020 and nearly 30% greater than 2019. During the year, over 60% of sales were attributable to the Consumer Solutions segment. The focus of this segment is the design, manufacturing, and sale of residential and commercial pool equipment and accessories and water treatment products and systems.
PNR Segment Summary – Form 10-K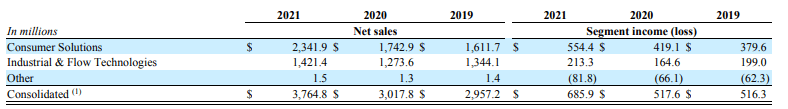
While the company experienced challenging operating conditions and supply-related disruptions, gross profit and operating margins were largely in-tact due to favorable pricing related actions. Operating margins in 2021 were about 17% versus 15.3% in 2020 and 14.6% in 2019. Additionally, margins on gross profit came in at 35%, which was in-line with prior years.
PNR Operating Income Summary – Form 10-K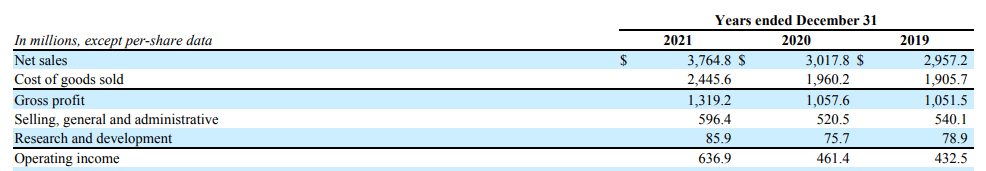
Shares of PNR ran up significantly from their lows in 2020 to a high of $80 in the summer of 2021. Since then, it has been on a downward turn. It is down 3% over the past month and down nearly 30% over the last six.
YCharts – PNR Price History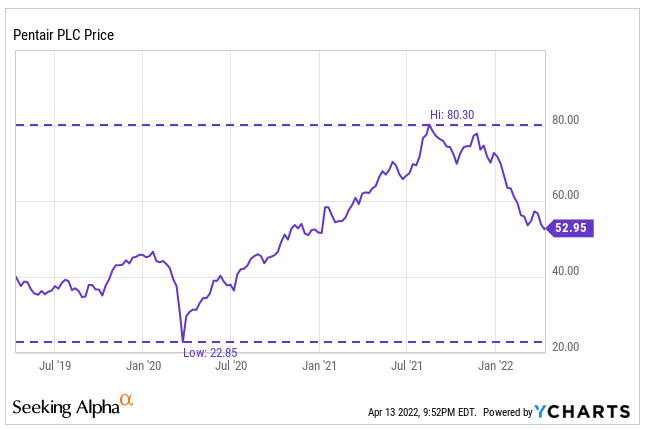
While it may seem as if the price ran up too fast, too quickly, the company’s earnings justified the price. Additionally, the pool industry is expected to post steady growth and is also expected to benefit from the increasing amounts of migration from colder areas of the U.S. to warmer locations.
In 2022, the company is expecting adjusted EPS of between $3.70 and $3.80, which would be up 9-12% from 2021. At a 17x multiple, which is slightly lower than their five-year average, shares would be worth between $63 and $65, representing upside of at least 15% from current pricing.
Masco Corporation (MAS)
MAS is a global leader in branded home improvement and building products. The company’s notable brands include BEHR paint and Delta bathroom fixtures, among others.
In 2021, the company reported +$8.4B in net sales. Historically, over 50% of net sales are attributable to Plumbing Products. In 2021, sales were over 60% in this segment, but slightly under that in the prior two years. From a geographical perspective, nearly 80% of total sales are generated within North America.
MAS Revenue Disaggregation – Form 10-K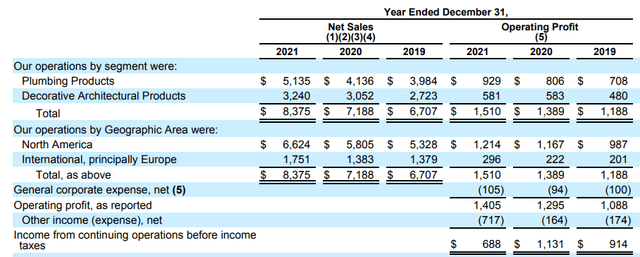
The company’s strong balance sheet includes over $900M in cash on hand and total liquidity that comfortably exceeds their short-term obligations. From a longer-term perspective, their three quarters of their term debt is due in the years after 2026 and the amounts due prior to then are spread out evenly and lower than the company’s cash on hand.
In 2021, MAS increased their dividend by 68% and another 20% in 2022. This comes on top of sizeable share repurchases. The annual dividend has now been grown for eight years at a five-year CAGR of 20%. The dividend is fully covered by cash flows and is likely to grow further in future periods.
Author’s Calculations of Various Implied Prices for MAS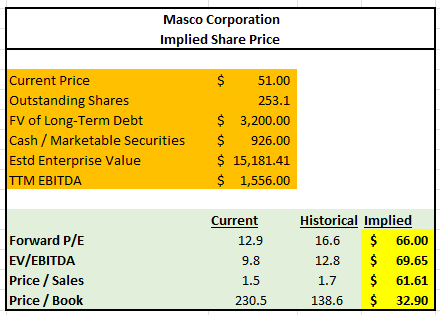
Despite strong fundamentals, MAS is currently trading at their 52-week lows on strongly bearish sentiment. There are valid concerns regarding the impacts of rising rates on the housing market, but the long-term outlook for the home improvement industry is favorable. At present, the valuation of MAS is at a discount to their five-year average on most pricing multiples. On a forward P/E basis of 16.6x, shares should be worth about $66, which would be nearly 30% above current levels.
Conclusion
Established companies with solid fundamentals have historically performed well over the long term. Any declines in the value of these companies are, therefore, worth further examination. JPM and MAS are two companies that warrant extra attention, given their significant underperformance.
While further analysis must be performed to obtain a more complete picture of the five companies mentioned above, an attractive opportunity exists for the companies to be added to the watchlist of any long-term diversified portfolio.
Be the first to comment