

Nattakorn Maneerat/iStock via Getty Images
This article was published on Dividend Kings on Wed, February 8th, 2023.
—————————————————————————————
My favorite TV show is Star Trek. I’ve watched every episode of every series twice.
Star Trek‘s optimistic view of a future in which science and technology, combined with compassion and tolerance, lead to a future utopia without poverty, war (among humans and our allies), or material suffering is one I deeply love.
I love it so much that I modeled my life around Star Trek and its optimistic humanistic philosophy.
Why did I go into Army medicine? Because the U.S. military is the closest thing to Star Fleet that exists. The U.S. military, while imperfect (so is Star Fleet), is fundamentally:
- 2.5 million idealistic patriots living in a utopia
- where there is no poverty, and everyone has access to education, and healthcare, and can strive to better themselves
- where everyone is united by a common set of values
- and works towards a common mission
- of protecting truth, democracy, and the American way.
I trained for three years to become an Army surgeon, following in the footsteps of Star Trek‘s Dr. McCoy and Dr. Beverly Crusher.
I was going to spend my life healing and saving the lives of America’s greater heroes. At the time, I could think of no better way to apply my intelligence, passion, and strong work ethic.
After injury forced me to medically retire from the Army Medical Services Corp, I found a new mission in life, consistent with my utopian Star Trek values.
I would devote my life to helping people like you achieve their financial dreams, even if you’ve suffered massive and even catastrophic setbacks.
Tough Times Never Last, Tough People Do
After my ex-wife and I lost five children to miscarriage and stillbirth, something that destroyed our marriage and ruined us financially, I was dead broke.
In fact, I was $50,000 in debt, homeless, and without the life mission that I had spent almost three decades pursuing.
But thanks to the love of my family, friends, my dog, and Star Trek, I rose like a Phoenix from the ashes to soar to new heights.
When I first began my new career as a financial analyst, I was making $6,000 per year, and literally living on mustard and pickle juice.
This was my version of Mark Cuban’s famous “ketchup sandwiches.”
But thanks to a lifelong love of studying the economy (my degree in college) and the stock market, I was able to help co-found the Dividend Kings and Wide Moat Research with amazing colleagues like Brad Thomas and Chuck Carnavale.
Together we built an amazing team, and now I’ve gone from dead broke to the happiest and most fulfilled I’ve ever been. More than even after the first year of Army medical school, when I finished in the top 10% of my class and nothing seemed impossible.
My New Mission In Life: Helping You Retire Rich While Saving Lives All Over The World
As wonderful as helping thousands of regular people recover from financial mistakes and make their retirement dreams come true is, I was missing something in life.
Army surgeons don’t just make the world a better place, they literally save lives.
In 2021, a friend of mine named Greg, a doctor from Boston, introduced me to effective altruism. Doing the best for the most people through evidence-based giving. This is how Greg described effective altruism to me three years ago.
“It’s literally Vulcan-like spreadsheet philanthropy that can let you save more lives than any Army surgeon over time.”
Greg wasn’t kidding; here is the power of effective altruism.
According to charity analyzer GiveWell, HKI is the single lowest-cost way for regular people to save a life.
By donating $1.26 concentrated vitamin A supplements two to three times per year from the age of six months to five years, we can prevent blindness and other severe medical issues in young children in Asia and Africa.
Each year 100,000 to 200,000 young children die from Vitamin A deficiency, and a mere $700 million per year would be enough to prevent it.
And this is hardly the only amazing charity that I’ve discovered over the years, as I’ve embraced effective altruism and a new mission to:
- feed the hungry
- save lives
- lift people out of poverty and spur economic development in emerging countries
- offset carbon emissions for my family (and many others)
- help other people donate to the most effective charities in the world.
For example, GiveDirectly is the world’s leading cash transfer charity and had done dozens of studies on the effectiveness of cash giving to lift people out of poverty.
- $40 per month can lift a person out of poverty
- $1 donated = $2.6 in economic impact.
GiveDirectly, Moody’s, Princeton, University of Michigan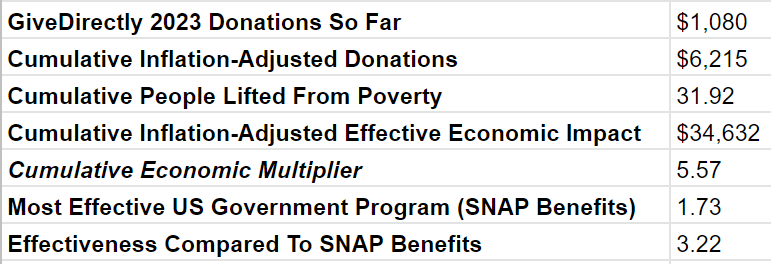
And though 1:1 matching programs, I’m able to double my impact, so that $1 donated results in $5.2 in economic impact in poor nations.
That’s 3.2X more effective than the most effective U.S. government program, which according to Moody’s is the SNAP program (food stamps).
Giving Multiplier takes donations from matching donors like me, and uses them to fund matching programs that combine people’s favorite charities with the world’s most effective ones.
For example, if someone donates $100 and is willing to split it 50/50 between their local animal shelter and Helen Keller International, Giving Multiplier will boost that donation by 50%.
This charity’s research indicates that for every $1 I donate, $1.5 ends up going to effective charities.
And as importantly, they teach brand new people about the power of effective altruism and 40% of donors join me in funding their match program.
- creating a self-sustaining chain of exponentially more effective giving.
The Life You Can Save is one of the best charities for directing others to where they can make the biggest impact.
The Life You Can Save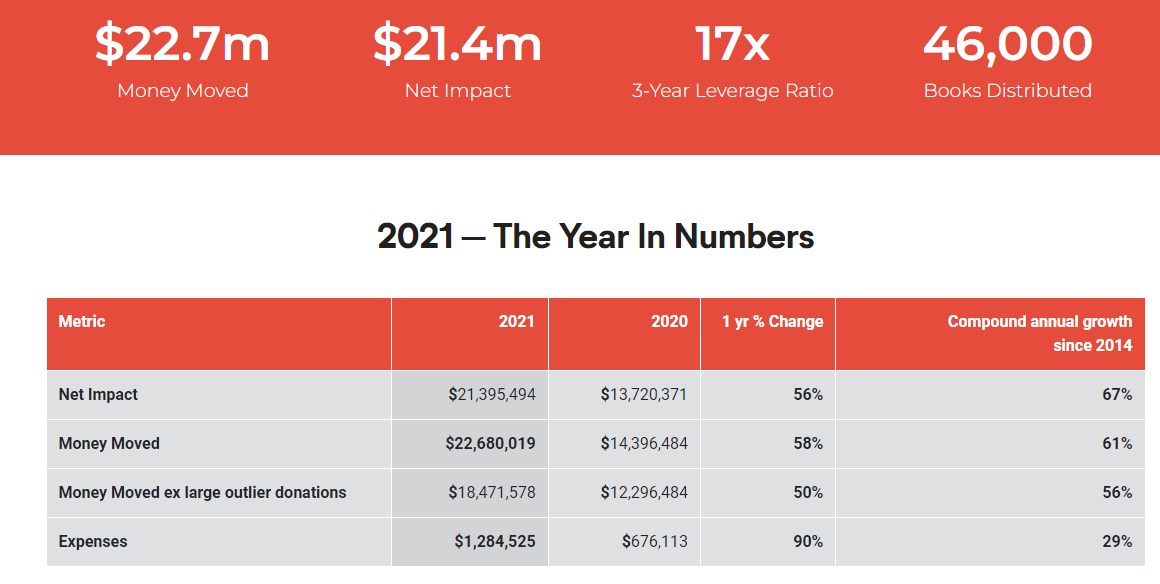
The Life You Can Save began in 2014 and that year they helped direct $400,000 to effective charities. By 2021, it had grown to $23 million in money moved, and generated a leverage ratio of 18 (17 over the previous 3 years).
That means for every $1 donated, $18 ends up going to effective charities.
The Clean Air Task Force is the most effective way to offset carbon and reduce climate change according to research from Founder’s Pledge, another charity evaluator.
- $1.26 per ton
- the average U.S. family could offset all their emissions for $85 per year.
I also have a personal charity I support, my local Cub Foods meal donation program. For every meal I eat, I donate two meals to hungry local Minnesotans.
I’ve been so poor that I literally ate mustard and pickle juice for 3 months. Now I have an ultimate goal of feeding 12 people every time I eat.
Why 12 people? Philosophically, this idea appeals to me. Why? Because Jesus never ate alone, and there were 12 apostles that he fed at every meal.
And logically, I can donate up to $13,500 per year with 7.4% cash back on credit cards, and tax it off my taxes.
- 54% effective cash back on feeding 1,250 Minnesotans per year.
I can then donate those tax/credit card savings through a 1:1 match with GiveDirectly creating $14,580 in effective donations.
- lifting 31 people out of poverty
- and having $37,098 in economic impact in Africa
Feed the hungry, lift people out of poverty, boost economic growth in poor countries, save young children’s lives, reduce climate change, and help funnel a fortune to the world’s most effective charities.
This is how I can go from just helping people live better lives to literally changing the world and helping others achieve the Star Trek utopia that the Army and dividend blue chips have let me and my family enjoy today.
Giving What We Can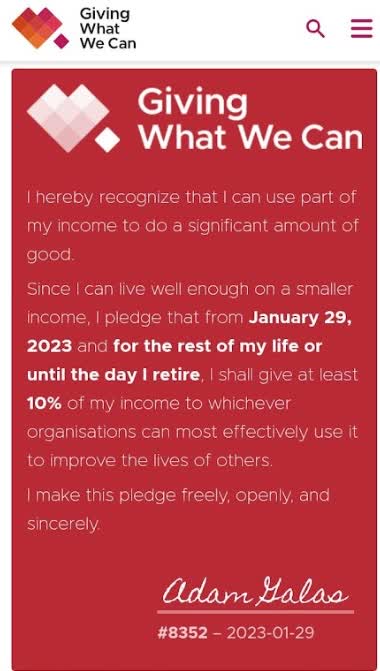
I’ve signed the Giving What We Can pledge to donate at least 10% of my income for the rest of my life to effective charities.
And I’m not alone.
Giving What We Can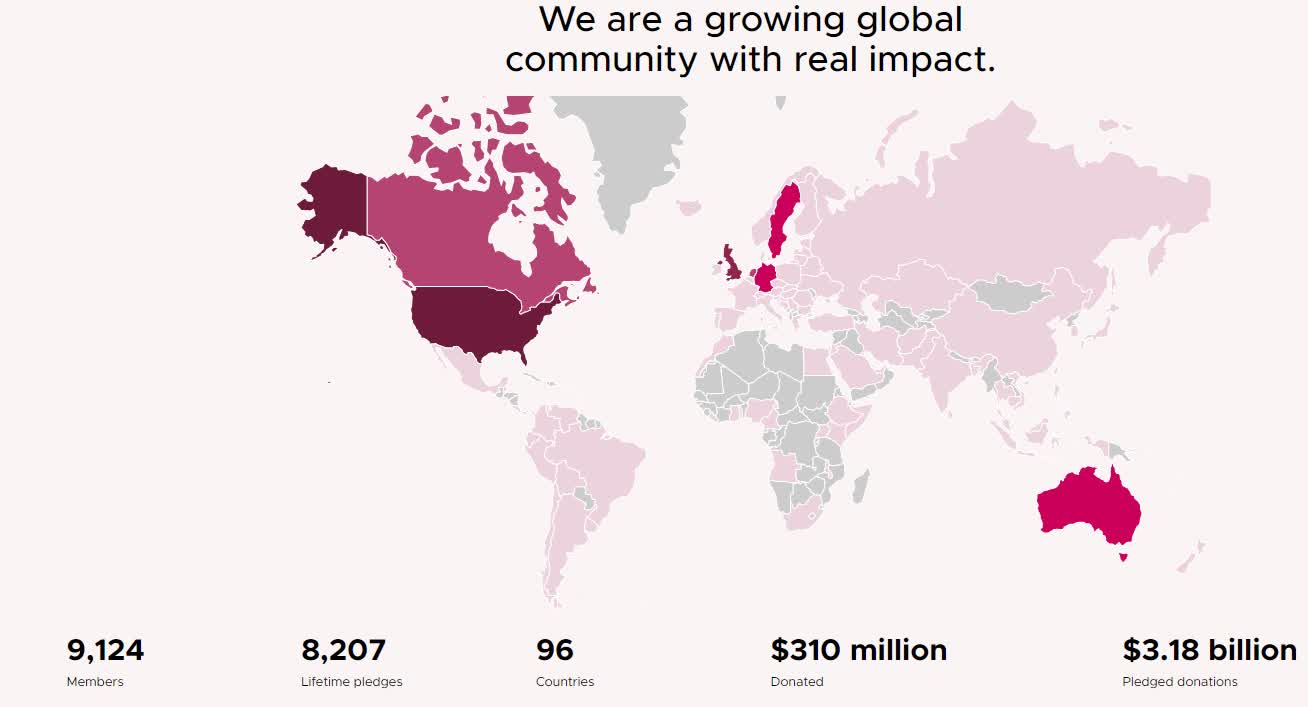
I’m now one of over 9,000 effective altruists who have pledged over $3 billion and already donated over $300 million to the world’s most effective charities.
This is a lifetime pledge, and right now I can’t afford to hit that 10% income goal (due to family medical bills). But over the coming years and decades, I’m going to give a lot more than 10%, in fact, I’ll give over 100%.
And here’s how.
Earn To Invest To Give: The Philosophy That Forever Changed My Life
If I were hit by a bus tomorrow, I can die happy knowing that I’ve not only helped thousands of people achieve their financial dreams but I’ve also:
- donated 205 meals to the hungry
- saved 2.34 young children
- lifted 32 people out of poverty
- boosted the African economy by $34,632 (adjusted for inflation)
- offset 39 tons of carbon
- helped funnel $2,693 to effective charities.
I have a spreadsheet that tracks all my cumulative giving and its effects, based on the best research available.
- Vulcan-like spreadsheet philanthropy at its finest.
But my Star Trek-inspired dreams are far bigger than that. This year alone I’m donating $24,000, and that is going to grow exponentially over time.
How big? Conservatively my charity spreadsheet estimates that in 2034 I’ll donate $184,000 to effective charities and hit a cumulative inflation-adjusted $1.1 million.
- not bad for a 47-year-old.
And that’s the most conservative estimates. Why? This is where earning to give and my personal version, earning to invest and give, comes in.
Earning to give is the philosophy taught by 80,000 Hours, which is a spinoff from Giving What We Can.
The idea is simple. The average person will work 80,000 hours in their careers, and if you want to make the most difference, you don’t necessarily have to work for a charity.
Imagine a doctor, like Greg, who chose to become an oncologist rather than just a family practitioner. The extra income he makes allows him to donate 50% of his pre-tax income of $430,000 to his favorite charity, Helen Keller International.
Here’s what Greg shared with me, about how he chose his career. Studies show that on average, a family doctor will save about 4 lives per year.
Over a 40-year career, that’s 160 lives saved. Amazing! What a hero!
But an oncologist will save even more lives, because he’s treating cancer.
But more importantly from the perspective of global life savings is this math.
- $3,500 saves one young child through HKI.
A family doctor in Boston averages $290,000 per year.
- after taxes about $174K
- 50% of pre-tax income donated = $145K
- leaving $129,000 to live on (comfortable but modest lifestyle)
- $187,000 actually because of the tax deductions.
That $145,000 equals 41 lives saved by donating to HKI.
- 1,652 lives saved + 160 from being a family doctor = 1,812 lives saved
For context, Oskar Schindler, from “Schindler’s List” fame saved 1,100 lives and is among Israel’s most honored heroes of WWII.
Had my friend Greg just been a family doctor and donated 50% of his income to HKI, he would have saved 700 more lives.
But Greg chose oncology for the sole reason that he could make $430,000 per year, and donate $215,000 per year to HKI.
- $258K after tax
- $43K after donation + $86K tax savings = $129K per year to live on.
And now look at how many lives Greg can save.
- 61.4 lives per year
- 2,456 lives over a 40-year career
- 3,070 lives over his planned 50-year career.
Not even counting the lives he’s saving as an oncologist Gregg is on track to save over 3,000 lives, a small town’s worth of young children.
Imagine if someone rescued a jet with 300 young children. That person would be a national hero. Coast-to-cost coverage on every channel, and they might literally get to meet the President for their heroism.
Now imagine someone rescued 10 jets full of young children from crashing. Holiday would probably make a movie about their lives.
It would be a feat akin to a real-life super hero, like the Avengers.
But that’s exactly what Greg is doing with his life, by applying his intelligence, values, and work ethic as a doctor, to changing the world.
But as great as Greg’s plan is, here’s an even better one.
Earn To Invest And Give: How Almost Anyone Can Change The World
Ben Franklin left $2,000 to the cities of Philadelphia and Boston in his will. But there was a catch. All of the money had to be donated to local charities after being invested into a diversified portfolio for 100 years.
After 100 years, 50% would be de distributed to local charities, and after 200 years, the rest.
By the time the 200 years were up, $13 million went to charities in both cities…each.
$2,000 turns into $26 million over 200 years.
Back in the early 1800s, index funds didn’t exist, so the charitable trust Franklin set up was mostly invested in bonds.
- had it been invested in the U.S. stock market that $2,000 would have turned into $4 billion.
How much is $4 billion to cities like Philadelphia and Boston?
- in 2022 Philadelphia’s city budget was $5.8 billion
- in 2022 Boston’s city budget was $4.0 billion.
That’s the idea behind my family hedge funds earned to invest in giving strategy.
My share of the fund is scaling up to 5% of annual donations, which is about 50% of the inflation and tax-adjusted gains.
Over time, my donations, which are right now coming out of my income, will grow into millions, then billions, and after I turn this into a perpetual charitable trust, into trillions in cumulative inflation-adjusted giving.
Do you know what the biggest philanthropist in history was? Andrew Carnegie, in today’s dollars, donated $438.5 billion.
The man who dies rich dies disgraced.” – Andrew Carnegie.
Eventually, my ZEUS foundation will surpass Mr. Carnegie.
- Conservatively in the year 2,369
I have a secondary goal, to become the first (or one of the first) people to ever donate $1 trillion in inflation-adjusted terms.
If you donate thousands, you can make a difference in your community.
If you donate millions, you can change a lot of lives.
If you donate billions, you can change the world.
But if you donate $1+ trillion over time, you can change everything.
Ok, so this sounds amazing, a wonderful life mission to become a real-life superhero and help as many people as possible achieve their own Star Trek utopia.
But didn’t I promise you five life-changing dividend exchange-traded funds (“ETFs”)? Indeed I did, and here is someone like Greg, or just anyone who wants to achieve financial freedom, who can change their lives and even the world.
5 Dividend ETFs That Could Change Your Life And The World
(Sources: DK Research Terminal, Morningstar.)
I’ve linked to articles exploring each ETFs pros and cons and why they make up 33% of my family hedge fund, the Dividend Kings ZEUS Income Growth portfolio.
But here is the bottom line:
- 935 of the world’s best blue-chips
- small, midcap, large-cap, growth, value, core
- 1.8% yield vs 1.7% S&P 500
- 12.0% growth vs. 8.5% S&P 500
- 13.8% total return potential vs 10.2% S&P 500.
For context, there are about 600,000 publicly traded companies on earth.
Vanguard estimates about 10,000 are blue-chip quality.
And MSCI estimates that about 1,000 are world-beater blue-chips.
These five dividend ETFs represent almost all world-beater blue-chips and offer the same yield as the market but about 4% higher long-term return potential.
That sounds incredible! Better than even Warren Buffett’s recommendation that almost everyone just buy the S&P 500.
What evidence do we have that this is actually possible?
Total Returns Since 2017
Portfolio Visualizer Premium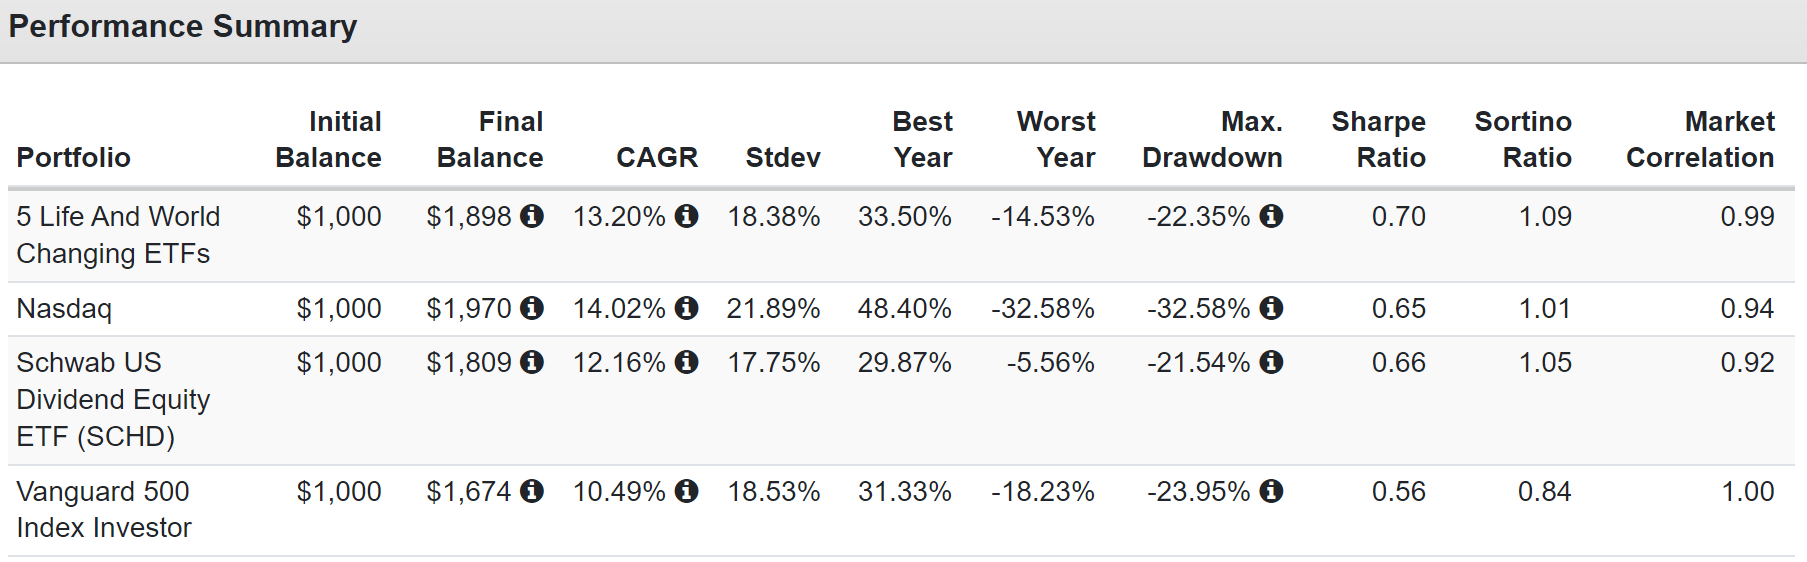
OMFL has only been around for five years, so we only have five years of historical data for this dividend ETF portfolio. But over that time, it’s outperformed SCHD and put the market to shame.
Portfolio Visualizer Premium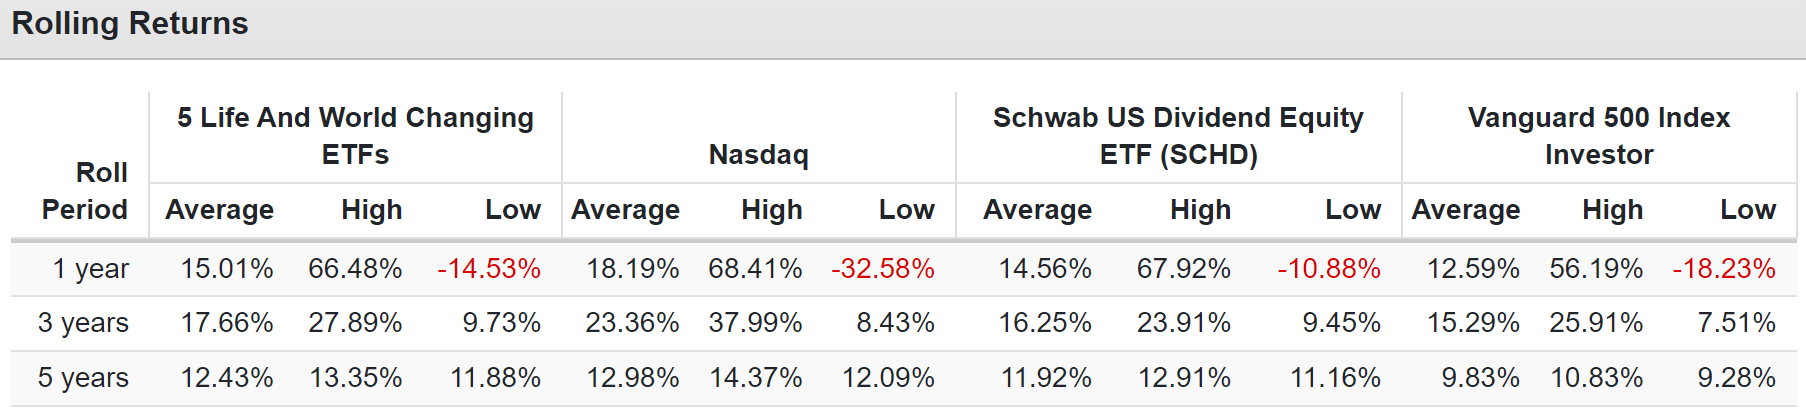
We’re not just talking about around 14% potential total returns, we’re also talking about 14% historical returns that are about 3% higher than the S&P 500.
Do you know how many ETFs have been able to deliver better Sortino ratios than the Nasdaq over the last five years?
- Sortino ratio: negative volatility-adjusted returns.
Almost none, but these five did.
But wait a second? Don’t three of these ETFs have highly variable dividends? Yes, but look what happens when you combine all five together.
17% Annual Income Growth And Dividends That Rise Every Year
Portfolio Visualizer Premium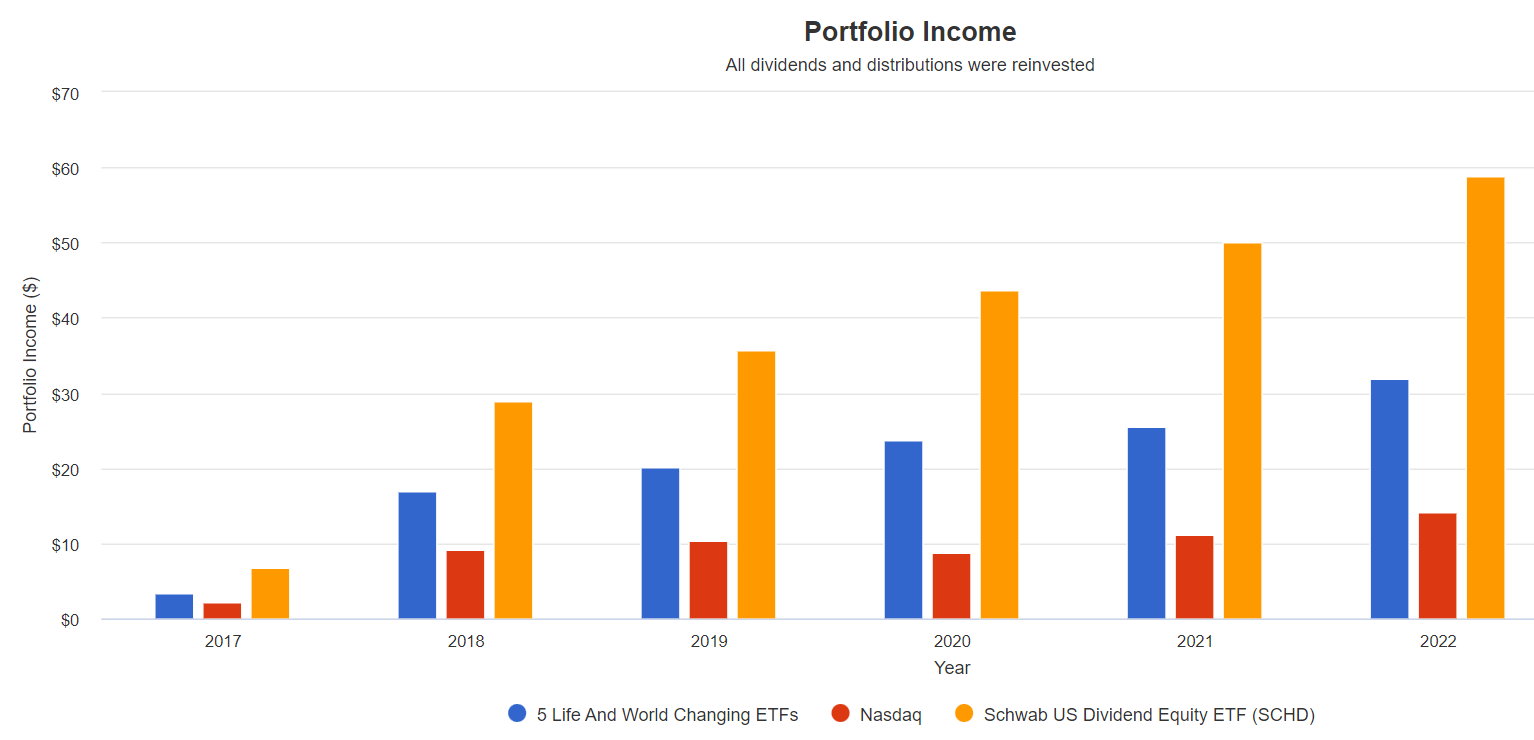
In the future, analysts think these five ETFs can deliver 12% to 15% annual income growth and over the last four they delivered 17% income growth with not a single down year (unlike the Nasdaq).
- SCHD delivered 19% income growth, including 18% growth in 2022
- which is why it’s one of the five life-changing ETFs I own
- Nasdaq delivered 12% annual income growth, exceptional but we beat it.
So what could this mean for someone who wants to own the world’s best dividend stocks?
Inflation-Adjusted Consensus Total Return Potential: $1,000 Initial Investment
| Time Frame (Years) | 7.9% CAGR Inflation-Adjusted S&P 500 Consensus | 11.5% CAGR Inflation-Adjusted 5 Super ETFs Consensus | Difference Between Inflation-Adjusted 5 Super ETFs Consensus And S&P Consensus |
| 5 | $1,465.25 | $1,726.45 | $261.20 |
| 10 | $2,146.96 | $2,980.62 | $833.66 |
| 15 | $3,145.84 | $5,145.88 | $2,000.04 |
| 20 | $4,609.44 | $8,884.09 | $4,274.65 |
| 25 | $6,753.99 | $15,337.90 | $8,583.91 |
| 30 (retirement time frame) | $9,896.29 | $26,480.07 | $16,583.78 |
| 35 | $14,500.55 | $45,716.44 | $31,215.89 |
| 40 | $21,246.95 | $78,927.00 | $57,680.05 |
| 45 | $31,132.11 | $136,263.27 | $105,131.16 |
| 50 | $45,616.37 | $235,251.29 | $189,634.92 |
| 55 | $66,839.43 | $406,148.83 | $339,309.40 |
| 60 (investing lifetime) | $97,936.56 | $701,194.35 | $603,257.80 |
| 100 Ben Franklin “Invest To Give” time frame | $2,080,852.87 | $55,343,167.97 | $53,262,315.11 |
(Source: DK Research Terminal, FactSet, Morningstar.)
Over a standard retirement time frame, these 5 ETFs could turn $1 into $26.5, adjusted for inflation.
Over an investing lifetime, they could turn $1 into $701, adjusted for inflation.
And over Ben Franklin’s “invest to give” time frame of 100 years, they could turn $1 into $55.3 million.
Don’t think that 2% to 3% better annual returns matter? Over decades and centuries, they can change your life and even the world.
Why Invest To Give Is The Most Effective Philanthropy Of All
Here’s how to turn an earn-to-give lifestyle into the most effective form of charity in the world. Let’s use Greg as our example. Say he donated 50% of his usual charity and invested the other 50%.
And then every 10 years he donated 50% of the stock portfolio to charity.
Remember that Greg plans to keep working for 50 years, donating a total of $10.8 million, adjusted for inflation, to Helen Keller International.
- saving over 3,000 young children’s lives
- Ten airliners worth of young kids.
Let’s see how investing to give would let Greg still save lives today, but far more in the coming decades.
Invest To Give Saves 4X As Many Lives Over 50 Years
| Year | Cumulative Inflation-Adjusted Donations From Earn To Give | Cumulative Inflation & Tax-Adjusted Donations From Portfolio | Cumulative Inflation & Tax-Adjusted Invest To Give Donations | Lives Saved With Earn To Give | Lives Saved With Invest To Give |
Additional Lives Saved |
| 10 | $2,150,000 | $2,001,358 | $3,076,358 | 614 | 879 | 265 |
| 20 | $4,300,000 | $6,311,307 | $8,461,307 | 1,229 | 2,418 | 1,189 |
| 30 | $6,450,000 | $13,284,248 | $16,509,248 | 1,843 | 4,717 | 2,874 |
| 40 | $8,600,000 | $23,328,983 | $27,628,983 | 2,457 | 7,894 | 5,437 |
| 50 | $10,750,000 | $36,917,073 | $42,292,073 | 3,071 | 12,083 | 9,012 |
(Sources: DK Research Terminal, FactSet, Morningstar, Ycharts, Dave Ramsey Investing Calculator.)
Remember that Greg has committed to donating 50% of his pre-tax income each year. So investing to give wouldn’t change his lifestyle.
And even factoring in the tax implications (including the 30% of stocks that can be donated to charity and taken off your taxes) invest to give results in 4X more lives saved than his current plan of earning to give.
That’s an extra 9,012 lives over 50 years or a total of 12,083.
- 40 jetliners full of kids
- an entire small city.
If saving 3,000 children over your life makes you a real-life super hero, what does saving 12,000 children make you? The best version of yourself that you can be if saving lives is your primary mission in life.
And this is just 50 years of invest to give. Imagine what you could accomplish with a perpetual charitable trust (which doesn’t have to pay taxes) over 100 years. 200 years? Or even 300 years?
Bottom Line: These 5 Dividend ETFs That Could Change Your Life And The World
What if you’re not a stick picker at all? What if you have no interest in selecting individual companies and tracking them over time?
Then dividend ETFS like SCHD, VIG, SCHG, SPGP, and OMFL might be just what you need to change your life or even the world.
Whether you’re saving for college, a new car, a house, or retirement, these five ETFs offer you something that is far superior to the S&P 500 that Buffett recommends.
- 1.8% very safe yield that grows every year (at 17% historically and 12% to 15% consensus in the future)
- almost 14% long-term and historical returns compared to the market’s 10.2%
- 935 of the world’s best companies (far superior diversification to the S&P)
- small, mid, and large caps (better diversification than the S&P).
Rebalance these 5 ETFS once per year, which takes 5 minutes, and you have the ultimate “set and forget” retirement portfolio.
Need more yield? Then make the portfolio 50% SCHD, and then it yields 2.3%, more than the dividend aristocrats.
And if you’re interested in making the biggest possible positive impact on the world, then consider Ben Franklin’s “invest to give” strategy combined with the most effective charities on earth.
Do you know what Ben Franklin’s $2,000 donation to Philadelphia and Boston charities would have been worth had his trust been able to compound at 13.8% instead of 4.9% with bonds?
Remember that had the Franklin trust had access to the S&P, the final donation would have been $4 billion.
And had these 5 ETFs existed back then? Then that $2,000 donation would have become a final 200-year donation of $97.4 billion.
- enough to run the cities of Philadelphia and Boston for 10 years.
This is the power of blue-chip dividend compounding over time.
Legacy Research
For 50 years, the world’s best dividend growth blue-chips have been delivering about 13% annual returns or about 10% after inflation.
- double your money in real terms every 7.2 years
- 17.4X real returns every 30 years
- 304X real returns over an investing lifetime.
50 years ago, there was no simple, low cost and convenient way to invest in the world’s 935 best dividend blue-chips. Today there is.
And that’s how almost anyone who can put aside a bit of saving each month can reach their financial dreams, no matter how small or how great, and without ever picking a single individual company.
My mission in life is to help regular people like you achieve financial independence and your own Star Trek utopia.
- a post-scarcity world full of such material abundance that money loses all meaning
- a life lived for self-improvement and maximizing your potential, and living your dreams, not chasing more of the all-mighty dollar.
And I’ve been blessed with incredible success. This is thanks to family, friends, the U.S. Army, and all you wonderful readers at Seeking Alpha, iREIT, and Dividend Kings. Thanks to all of you, I live in a Star Trek utopia.
My family will never want anything and never fear being poor. Poverty no longer exists for the Galas family.
And thanks to these five dividend blue-chip ETFs, combined with 12 other world-beater blue-chips, we not only get to live in utopia, but we also get to help bring utopia to all humankind.
Be the first to comment