

ekinyalgin/iStock via Getty Images
Stocks that crash hard are either cheap for a reason or an incredible bargain-hunting opportunity. Telling the difference between the two can be the difference between losing or making a fortune.
Buying large blue-chips is not a guarantee that you can avoid falling victim to a value trap.
Charlie Bilello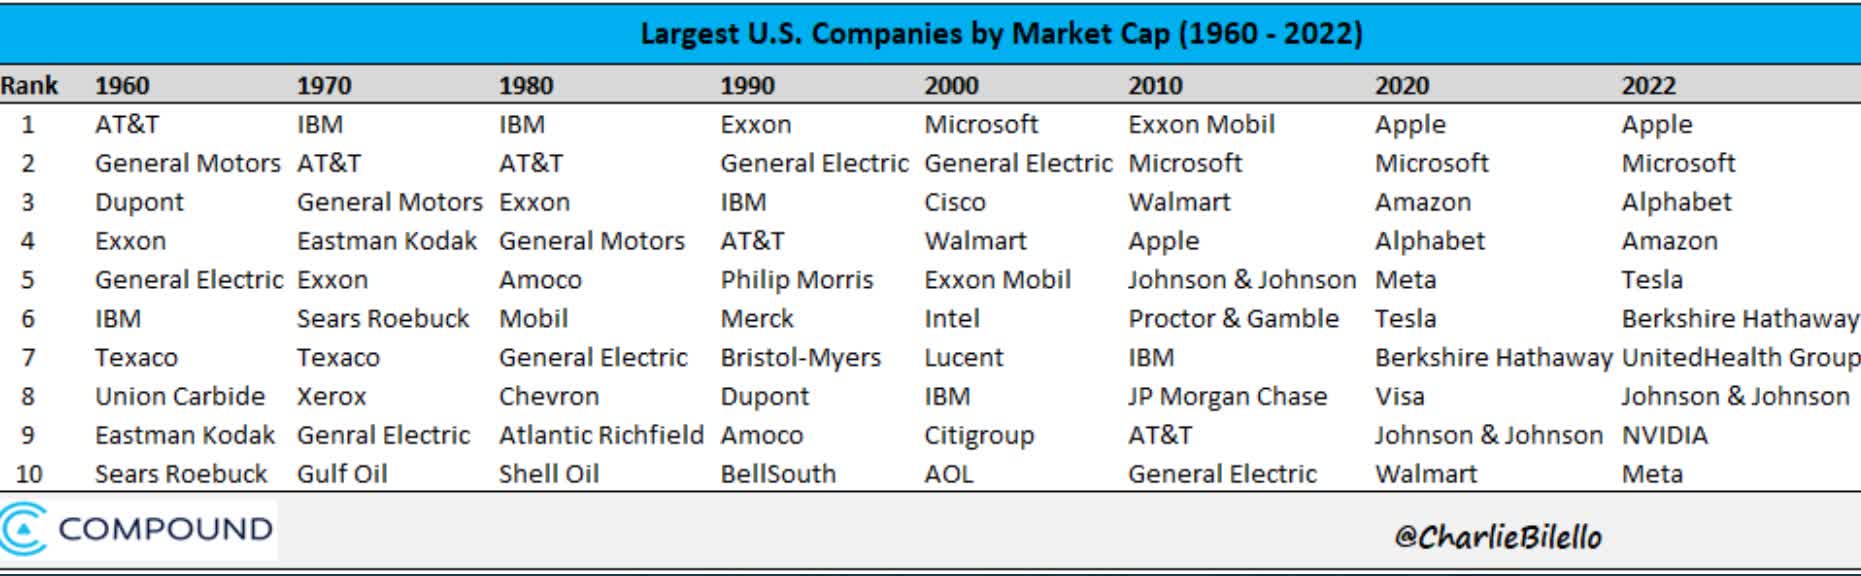
Sears was once the sixth largest company in America and is now bankrupt.
AT&T (T) was for decades one of the most dominant companies in the US, and is now a failed aristocrat that hasn’t delivered positive returns in 21 years.
General Electric (GE) is a former dividend aristocrat and, in the late 1990s, was the most valuable company on earth.
Ycharts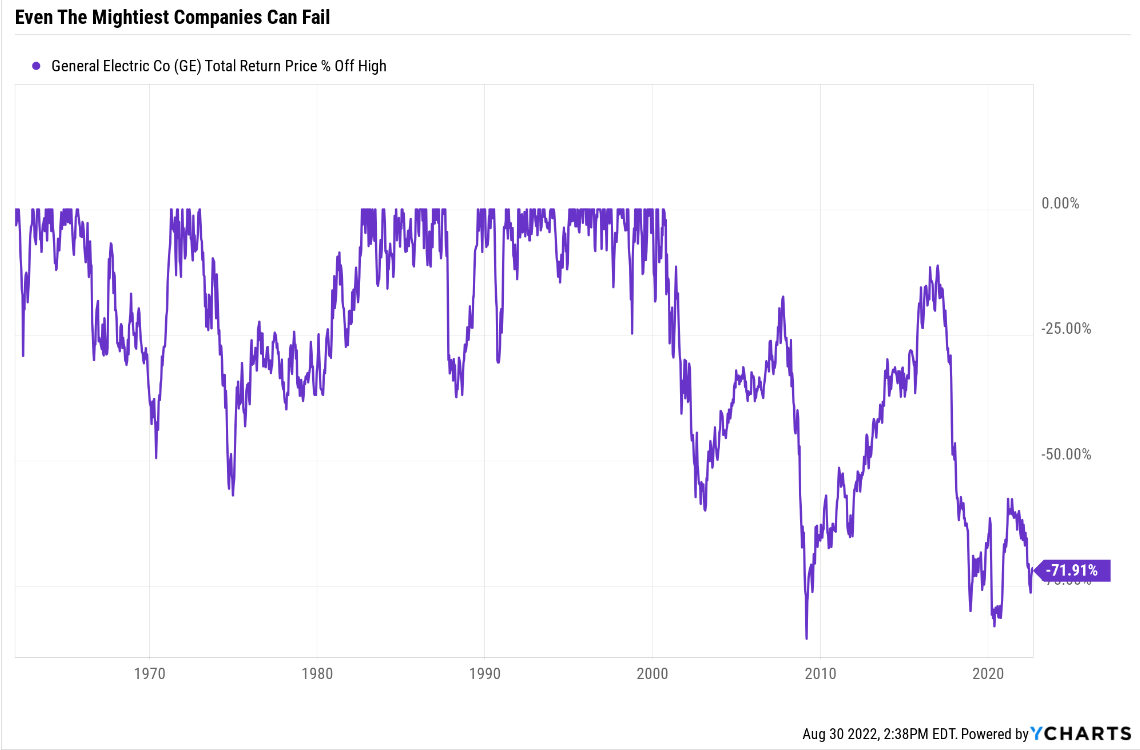
Today GE, including 22 years of dividends, is down 72% off its highs.
This brings me to the topic of 3M (NYSE:MMM), which I recently did a special video report on for Dividend Kings members. This was due to several requests to double-check that this legendary dividend king isn’t the next GE, AT&T, or Sears.
After carefully examining the latest evidence and data and consulting with our 30-expert consensus panel, I can tell you that 3M is not a value trap. It’s a table-pounding, Buffett-style “fat pitch” ultra value buy.
But that doesn’t necessarily mean that it’s the best high-yield blue-chip you should buy today.
So let me show you the three biggest reasons why it’s the best time in 12 years to buy 3M… but also why Allianz (OTCPK:ALIZY), Enbridge (ENB), and V.F. Corp (VFC), are three exceptional very strong buy high-yield alternatives for anyone not comfortable with 3M’s risk profile.
Reason One: 3M’s Crash Is Due To A Perfect Storm Of Short-Term Factors
Ycharts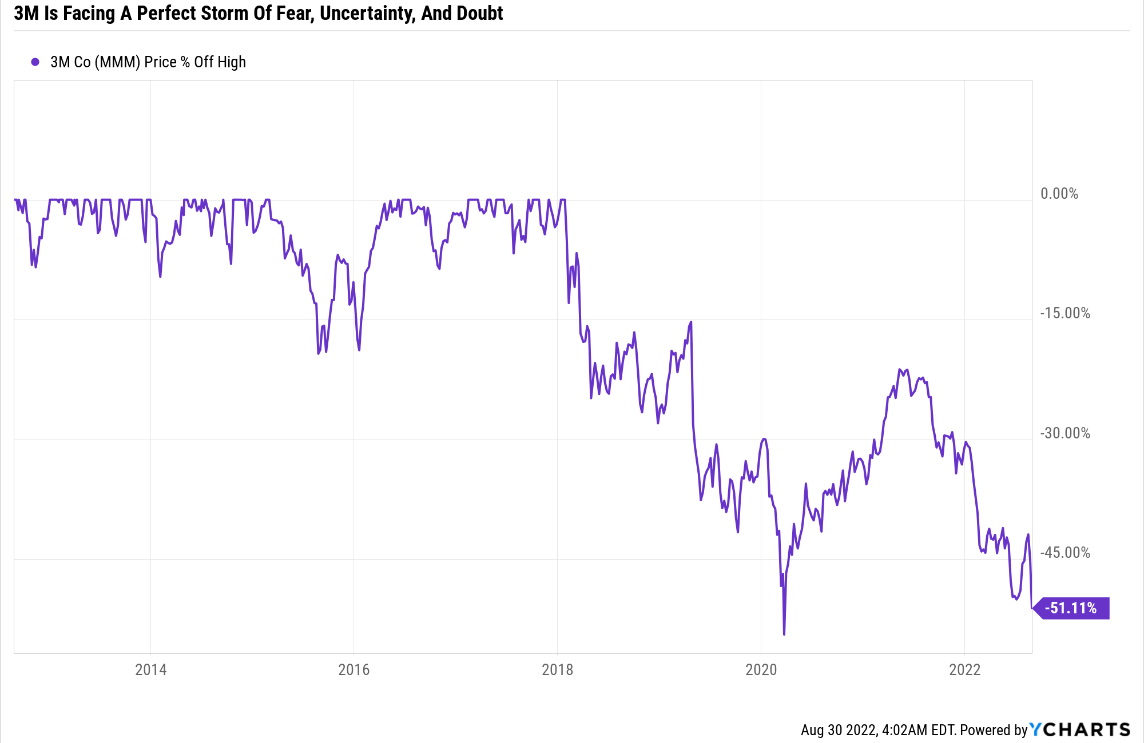
3M is in one of the most severe bear markets in history, which began in 2018 at the peak of the tax cut/infrastructure spending euphoria.
This Is Why You Don’t Overpay Even For Ultra SWAN Dividend Kings
(Source: FAST Graphs, FactSet Research)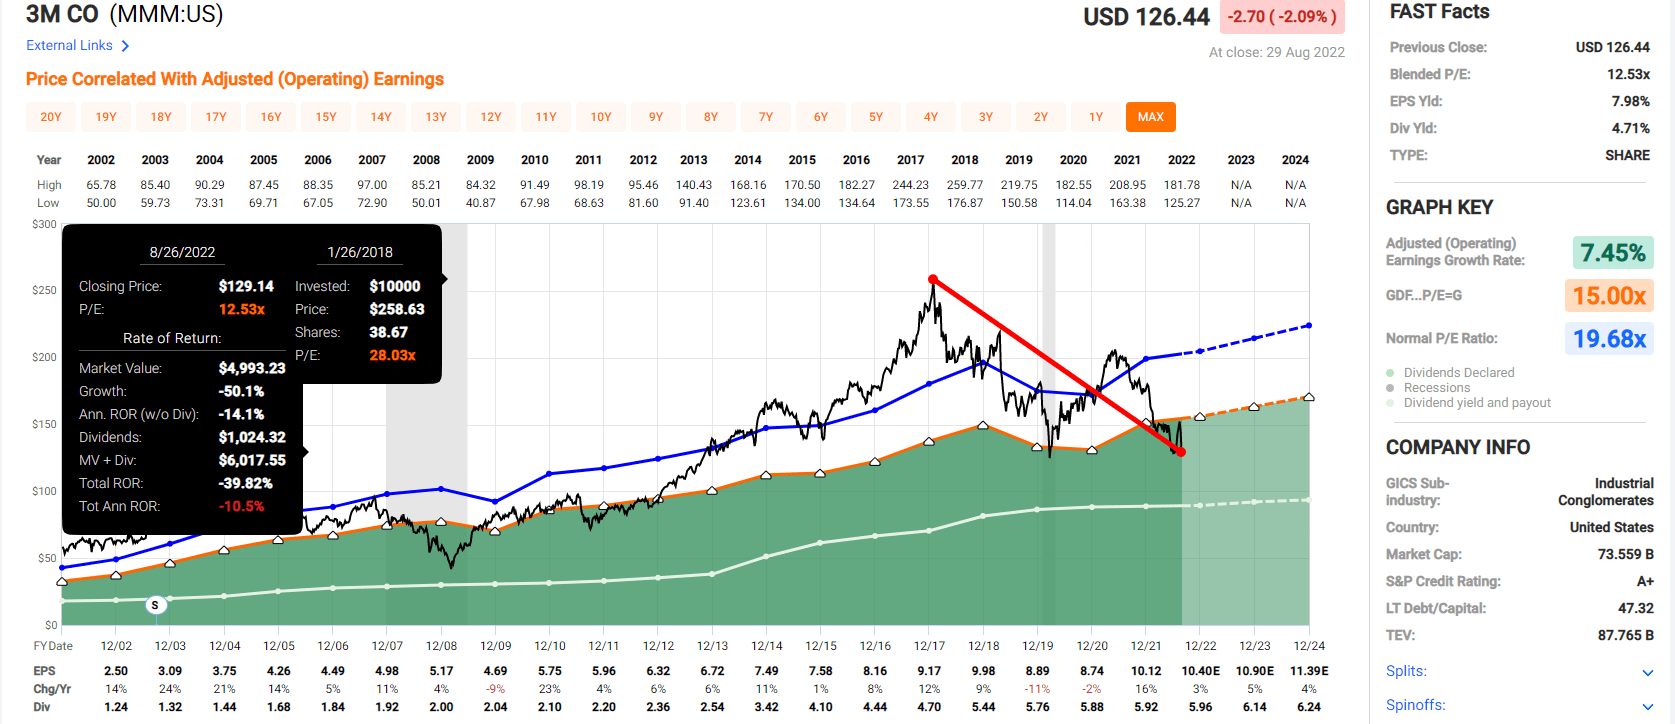
At its peak, 3M was trading at 28X earnings compared to its historical market-determined fair value of about 19X.
- about 50% historically overvalued
- the same premium of the S&P 500 on March 24th, 2000, the peak of the tech bubble
- the biggest bubble in US market history
Or, to put it another way, buying 3M in early 2018 was as logical as buying the S&P 500 at the peak of the tech bubble.
3M went from being priced as if nothing could go wrong to now being 36% historically undervalued; an Ultra Value buy priced as if nothing will go right again.
What is the market worried about now? What fear, uncertainty, and doubt has built the Wall of Worry that 3M must climb over?
- rising recession risk (94% probability of one within 13 months according to the bond market)
- general negative market sentiment (the 2022 bear market)
- 3M’s turnaround is complex, with 2 spin-offs and the company trying a 3rd
- several years of slow growth
- the legal liability concerns surrounding 230,000 earplug-related claims
This deep dive report on 3M goes through the legal liability risk in detail, but here is a brief summary.
Bloomberg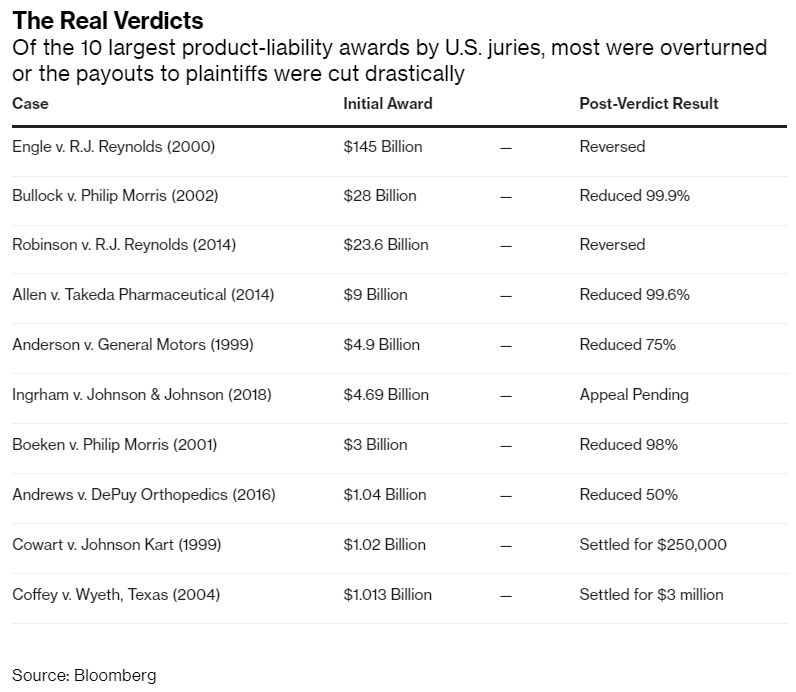
First, it’s important to understand that huge headline-grabbing punitive damages are almost always overturned or reduced by large amounts.
Second, the settlements companies reach tend to run 15 to 30 years.
- Thus allowing companies to service these claims easily
However, in the case of 3M, the uncertainty is around how big these liabilities could be.
- estimates range from $3 billion from Morningstar
- all the way to $230 billion (for both earplugs and PFAS), according to Bloomberg and JPMorgan
Even over 30 years, $230 billion in legal liabilities could put 3M’s 64-year dividend growth streak at risk.
- it’s why the company has raised its dividend by 1% annually over the last two years
Fortunately, 3M had a plan for neutralizing this risk, the Texas Two Step.
This is a highly controversial legal maneuver popular with some companies in Texas.
A company like JNJ or 3M, with potentially many billions in legal liabilities from thousands of lawsuits, will create a new subsidiary (Aearo Tech in the case of 3M).
All the potential liabilities are transferred to the new subsidiary, which then files for bankruptcy. The parent company provides a set amount to settle all claims, which a judge must approve.
3M was trying to settle its 230,000 outstanding earplug lawsuits for $1 billion, about $1.5 billion less than the lowest analyst estimate ($2.15 billion).
U.S. Bankruptcy Judge Jeffrey J. Graham ruled against a temporary stay of suits accusing the company and a bankrupt subsidiary, Aearo Technologies, of selling allegedly defective combat earplugs that didn’t prevent hearing loss…
3M and Aearo said they disagreed with the ruling and that Aearo planned to appeal.
Aearo on July 26 filed for Chapter 11 bankruptcy shortly after assuming liability for roughly 230,000 pending claims against it and 3M. Lawyers for the soldiers have claimed that bankruptcy law wasn’t intended for profitable companies.
Juries so far have awarded more than $265 million in compensatory and punitive damages in 16 trials, with plaintiffs winning 10. A federal judge said 3M hadn’t indicated during the trials “that any entity other than itself was responsible” for the claims. 3M has denied that the combat earplugs were defective.” – Seeking Alpha
This, as well as the Jerome Powell’s “anti-pivot” speech at Jackson Hole, is why 3M plunged 10% in a day on August 27th.
What happens next? Aearo will appeal and try to get an appeals judge to allow them to try the Texas two-step, thus ending the legal uncertainty.
What if 3M succeeds on appeal? Then the 230,000 soldiers suing 3M will also appeal that decision, which could make its way to the Supreme Court in a lengthy multi-year process.
3M would likely have to continue raising its dividend at a token 1% per year and limiting buybacks, building up a cash reserve just in case it lost.
This long potential period of peak uncertainty is why Wall Street hates 3M so much.
Not helping matters much is that 3M is in a multi-year turnaround.
3M’s Long And Winding Turnaround Path
CEO Michael Roman took over in mid-2018, and initially, 3M missed on earnings and estimates for several quarters.
- Roman is a 30 year veteran of 3M and was its former COO
- he orchestrated the cost-cutting and turnarounds that made 3M into such a legendary dividend blue-chip
Under his leadership, 3M has not actually been missing estimates as much as many investors believe.
(Source: Seeking Alpha)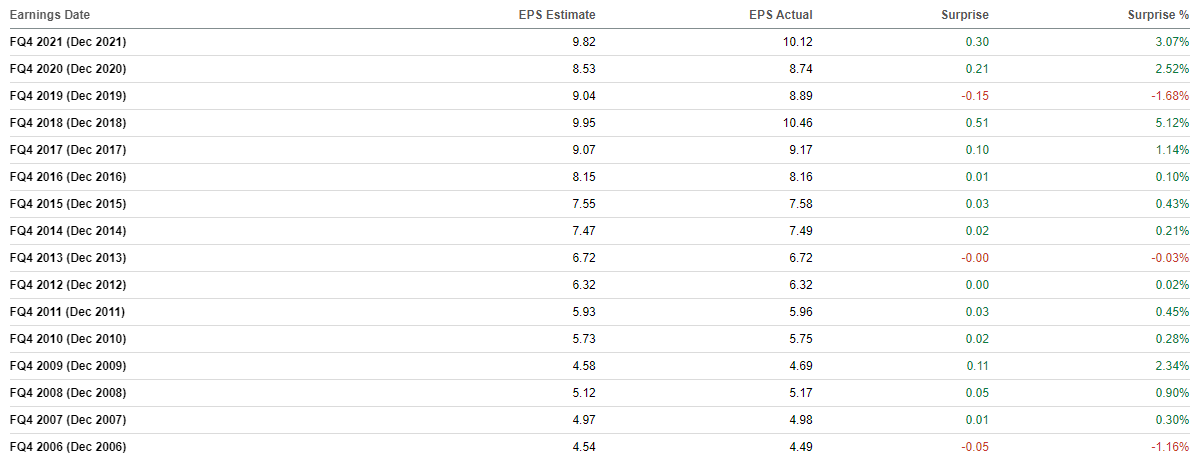
However, growth has slowed to 2% CAGR, including several years of negative growth.
Much of this was due to secular trends Roman wasn’t responsible for.
- the trade war
- the pandemic
- now supply chain disruptions, and high inflation
It’s his job to deal with these challenges, and analysts, rating agencies, and the bond market are confident he will be able to.
3M Medium-Term Growth Consensus
| Metric | 2021 Growth | 2022 Growth Consensus | 2023 Growth Consensus (Recession) | 2024 Growth Consensus | 2025 Growth Consensus |
2026 Growth Consensus |
| Sales | 9% | 1% | 3% | 3% | 6% | 2% |
| Dividend | 1% | 1% (Official) | 3% | 3% (66-Year Dividend Growth Streak) | NA | NA |
| EPS | 16% | 3% | 5% | 4% | 8% | 2% |
| Operating Cash Flow | -9% | -9% | 17% | 5% | NA | NA |
| Free Cash Flow | -12% | -15% | 22% | 9% | NA | NA |
| EBITDA | 6% | 2% | 4% | 6% | NA | NA |
| EBIT (operating income) | 8% | 3% | 4% | 6% | NA | NA |
(Source: FAST Graphs, FactSet Research)
The 2023 recession will naturally result in slower sales, and through 2026 3M isn’t expected to return to its historical 7.5% CAGR growth rate (over the last 20 years).
Dividend growth is expected to accelerate starting next year, though to just 3%.
Part of the efforts to return 3M to historical growth rate includes two spin-offs, the complexity of which has not been helping investor sentiment about the company.
What You Need To Know About 3M’s Spin-Offs
There are two spin-offs 3M is planning.
The first is a voluntary one in which shareholders will have to choose to participate. You may have received a broker notification asking about participating in this.
- you have until late August to notify your broker if you want to convert some shares of 3M into Neogen
Neogen will own 3M’s food safety business which accounted for 1% of sales, a non-material part of the business that management doesn’t want the hassle of running anymore.
3M is offering a 7% discount on Neogen shares for anyone who chooses to participate. I recommend against participating in this spin-off for two main reasons.
- Neogen is going to be a BB+ rated company (due to debt its taking on to pay 3M a special dividend)
- Neogen has no plans ever to pay a dividend
The only positive thing about Neogen is that analysts (the 3 that plan to cover it) think it will grow at 10% CAGR, slightly faster than 3M.
- For a long-term return potential of 10% Vs. 12.2% for 3M
In other words, there is nothing attractive about Neogen to make it worthwhile for 3M investors to participate in this divestiture.
The Medical Spinoff Is Somewhat Material
3M is spinning off its healthcare business, which represents 25% of earnings, into a separate company in a tax-free automatic corporate action.
- you don’t need to do anything to participate
3M will own 20% of the new company, which some analysts estimate will be a $9 billion equity stake.
- which can be sold in case it loses in court over the Texas Two Step maneuver with Aearo Tech
The new company will take on some debt but will pay a dividend sufficient to make 3M investors whole.
- 3M is likely to reduce its dividend by about 25%
- 3M + the medical spinco will equal the current dividend
Both companies are likely to be dividend kings and raise dividends each year.
Some investors might be concerned that the medical business was the fastest growing part of 3M, and without it, the growth outlook might dim considerably.
- before the spin-off announcement, the median long-term growth consensus was 8.0% CAGR
- now; it’s 7.5% CAGR and the company’s 20-year growth rate
That’s not to say that the spin-off won’t be a small negative impact on 3M.
Moody’s Investors Service (“Moody’s”) commented that 3M Company’s (“3M”) planned spinoff of its health care business is credit negative. This reflects the reduction in scale and earnings that will ensue after the separation of this business, along with a decline in revenue diversity. Absent an immediate repayment of a proportional amount of debt to offset earnings foregone from the loss of the health care business; Moody’s believes the spinoff will increase leverage modestly on a gross debt basis for several years. However, there is currently no impact on 3M’s A1 rating or the stable outlook.” – Moody’s
In other words, 3M’s investment thesis remains intact, and here’s how we know.
Reason Two: The Investment Thesis Remains Intact
Ben Graham recommended combining qualitative (the story) analysis with quantitative analysis looking at the past, present, and likely future.
So let’s look at 3M’s growth outlook and financial health in greater detail.
3M Credit Ratings
| Rating Agency | Credit Rating | 30-Year Default/Bankruptcy Risk | Chance of Losing 100% Of Your Investment 1 In |
| S&P | A+ Negative Outlook | 0.60% | 166.7 |
| Moody’s | A1 (A+ equivalent) Stable Outlook | 0.60% | 166.7 |
| Consensus | A+ Stable Outlook | 0.60% | 166.7 |
(Source: S&P, Fitch, Moody’s)
Rating agencies estimate 3M’s fundamental risk at 0.6%.
- a 1 in 167 chance of losing all your money buying MMM today
MMM Leverage Consensus Forecast (Not Factoring In The Medical Spinoff)
| Year | Debt/EBITDA | Net Debt/EBITDA (3 Or Less Safe According To Credit Rating Agencies) |
Interest Coverage (8+ Safe) |
| 2021 | 1.87 | 1.38 | 15.16 |
| 2022 | 1.76 | 1.30 | 20.41 |
| 2023 | 1.71 | 1.05 | 21.10 |
| 2024 | 1.67 | 0.79 | 17.02 |
| 2025 | 1.73 | NA | 32.64 |
| 2026 | NA | NA | 33.08 |
| Annualized Change | -1.98% | -17.02% | 16.88% |
(Source: FactSet Research Terminal)
3M’s balance sheet is strong and expected to get steadily stronger over time.
MMM Balance Sheet Consensus Forecast (Not Factoring In The Medical Spinoff)
| Year | Total Debt (Millions) | Cash | Net Debt (Millions) | Interest Cost (Millions) | EBITDA (Millions) | Operating Income (Millions) |
| 2021 | $17,363 | $4,564 | $12,799 | $486 | $9,285 | $7,369 |
| 2022 | $16,220 | $4,623 | $11,986 | $371 | $9,211 | $7,573 |
| 2023 | $16,712 | $6,161 | $10,207 | $372 | $9,748 | $7,850 |
| 2024 | $17,170 | $9,178 | $8,117 | $481 | $10,304 | $8,189 |
| 2025 | $18,772 | $17,055 | NA | $265 | $10,875 | $8,650 |
| 2026 | $19,503 | $20,948 | NA | $265 | NA | $8,765 |
| Annualized Growth | 2.35% | 35.63% | -14.08% | -11.42% | 4.03% | 3.53% |
(Source: FactSet Research Terminal)
3M’s growth rate is expected to be modest through 2026 but its net debt is expected to fall rapidly, even without the medical spin-off.
MMM Bond Profile
(Source: FactSet Research Terminal)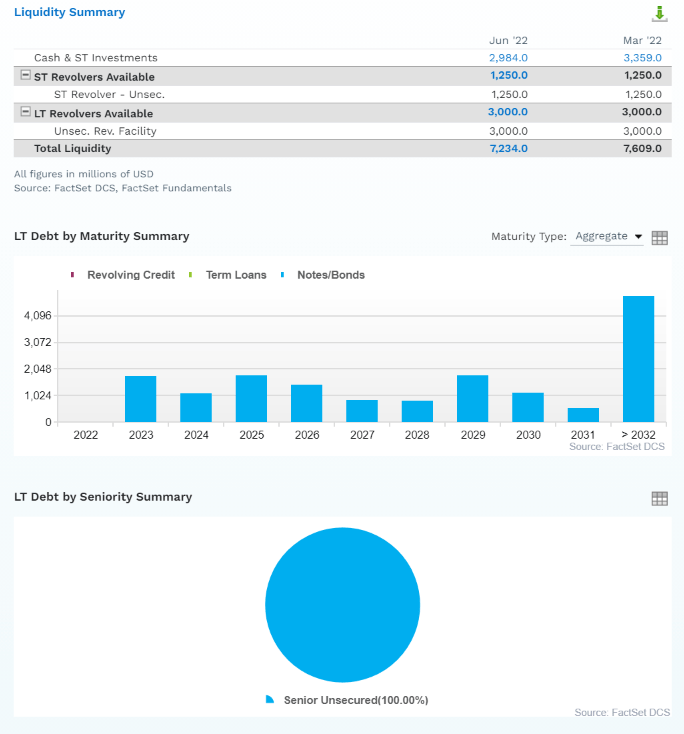
(Source: FactSet Research Terminal)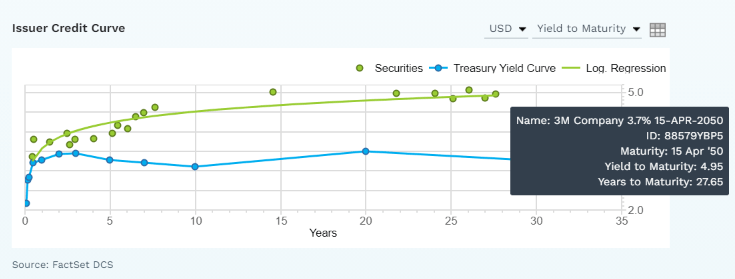
- $7.2 billion in liquidity
- well staggered debt maturities (little problem refinancing maturing bonds)
- 100% unsecured bonds (maximum financial flexibility)
- bond investors are so confident in MMM’s long-term prospects they were willing to buy its 28-year bonds at 5.0% interest rates (3.75% originally)
- 2.95% average borrowing cost
- 0.73% inflation-adjusted borrowing costs vs 13.5% returns on capital
- returns on capital are 19X higher than real borrowing cost
MMM Credit Default SWAPs: Real-Time Fundamental Risk Analysis From The Bond Market
(Source: FactSet Research Terminal)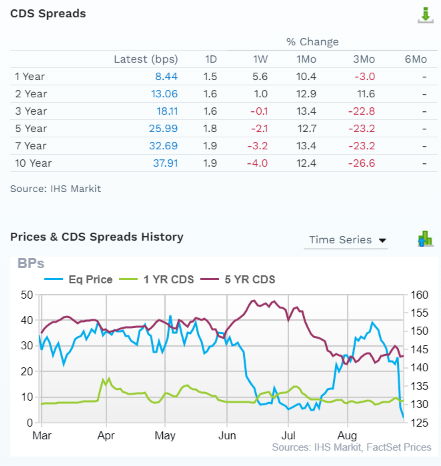
Credit default SWAPs are the insurance policies bond investors take out against default.
- they represent real-time fundamental risk assessment from the “smart money” on Wall Street
- MMM’s fundamental risk has been falling in recent months and in the last week, has declined modestly.
- the bond market is pricing in a 1.14% 30-year default risk, which is consistent with A- credit ratings
- 6 weeks ago 30-year default risk was 1.89%
- basically, analysts, rating agencies, and the bond market all agree
- MMM’s thesis is intact
- 23 analysts, 7 rating agencies, and the bond market make up our MMM expert consensus
- 29 expert consensus + the bond market monitoring MMM’s risk profile
- how we track fundamental risk in real-time
- to ensure high-probability/low-risk investment recommendations
MMM GF Score: The Newest Addition To The DK Safety And Quality Model
The GF Score is a ranking system that has been found to be closely correlated to the long-term performances of stocks by backtesting from 2006 to 2021.” – Gurufocus
GF Score takes five key aspects into consideration. They are:
- Financial Strength
- Profitability
- Growth
- Valuation
- Momentum
(Source: Gurufocus Premium)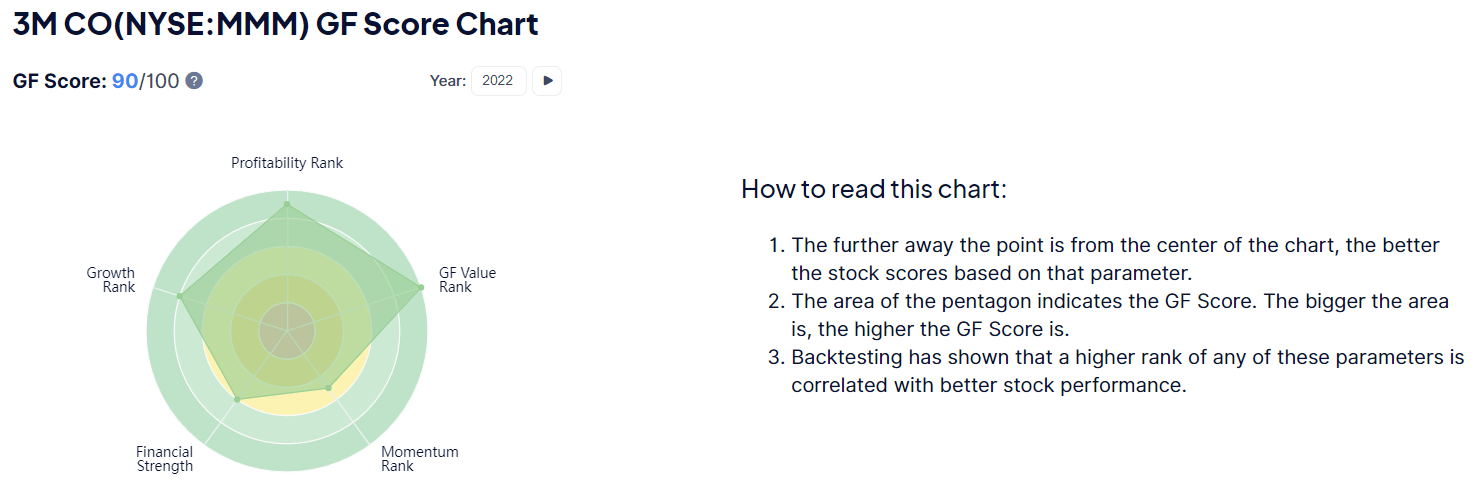
MMM’s excellent score of 90/100 confirms its industry-leading fundamental quality.
MMM Profitability: Wall Street’s Favorite Quality Proxy
(Source: Gurufocus Premium)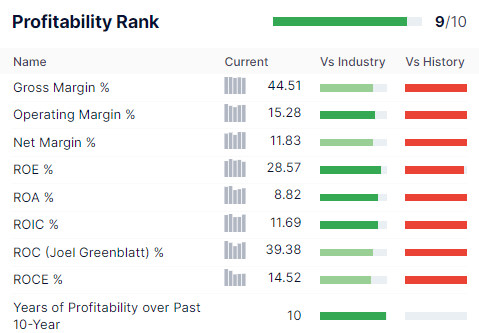
MMM’s historical profitability is in the top 10% of its peers
MMM Trailing 12-Month Profitability Vs. Peers
| Metric | TTM | Industry Percentile | Major Conglomerates More Profitable Than MMM (Out Of 515) |
| Gross Margins | 44.51% | 79.78 | 104 |
| Operating Margin | 15.28% | 82.02 | 93 |
| Net Margin | 11.83% | 79.16 | 107 |
| Return On Equity | 28.57% | 91.30 | 45 |
| Return On Assets | 8.82% | 86.99 | 67 |
| Returns On Invested Capital | 11.69% | 87.43 | 65 |
| Return On Capital (Greenblatt) | 39.38% | 79.88 | 104 |
| Return On Capital Employed | 14.52% | 76.79 | 120 |
| Average | 21.83% | 82.92 | 88 |
(Source: GuruFocus Premium)
MMM’s profitability has been in the top 17% of peers in the last year despite all its supply chain issues.
Ycharts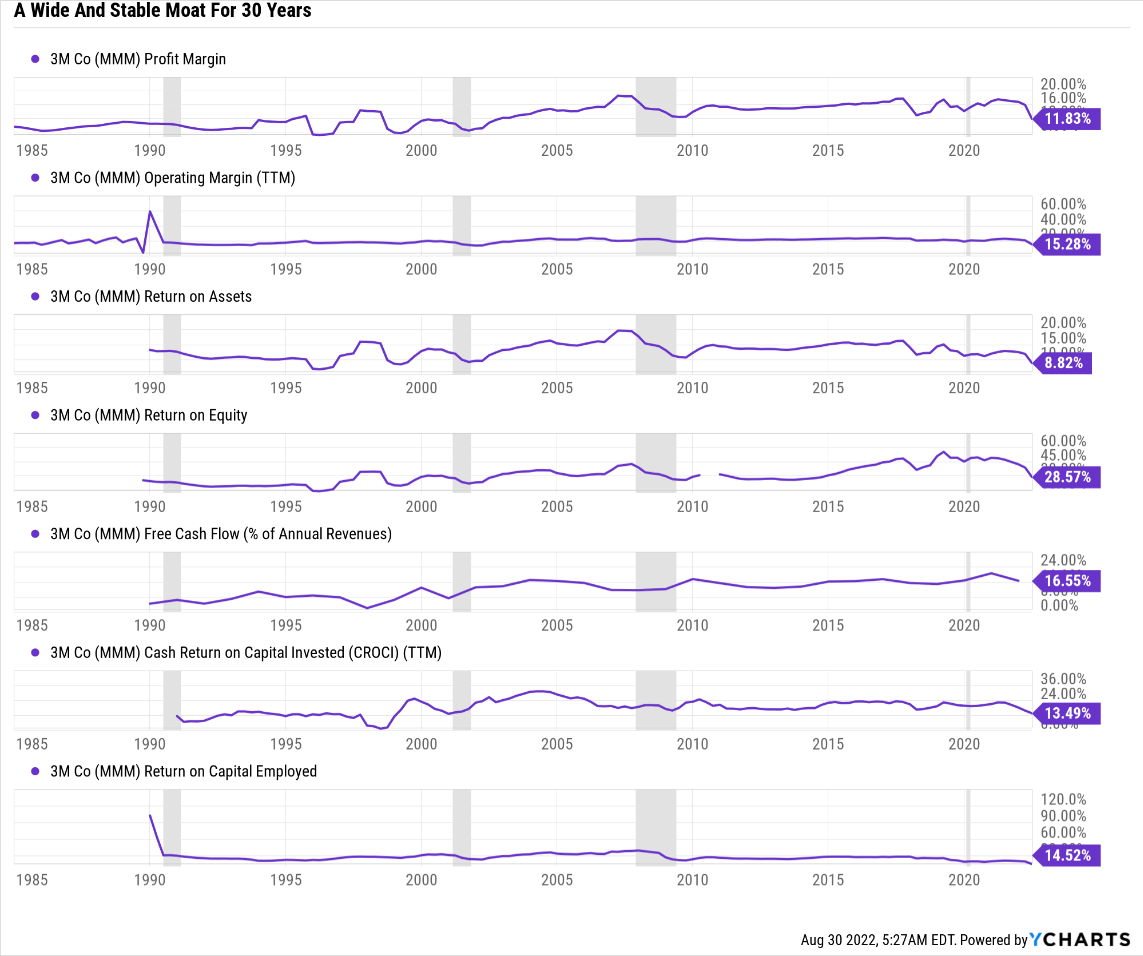
Over the last 30 years, MMM’s profitability has been relatively stable, adjusting for the natural cyclicality of its industry.
- confirming a wide and stable moat
MMM Profit Margin Consensus Forecast
| Year | FCF Margin | EBITDA Margin | EBIT (Operating) Margin | Net Margin | Return On Capital Expansion |
Return On Capital Forecast |
| 2021 | 16.5% | 26.3% | 20.8% | 16.7% | 1.05 | |
| 2022 | 13.9% | 26.3% | 21.6% | 17.0% | TTM ROC | 39.38% |
| 2023 | 16.5% | 27.2% | 21.9% | 17.0% | Latest ROC | NA |
| 2024 | 17.3% | 27.7% | 22.0% | 16.9% | 2026 ROC | 41.24% |
| 2025 | 17.6% | 27.6% | 21.9% | 17.3% | 2026 ROC | NA |
| 2026 | 18.2% | NA | 21.8% | 17.8% | Average | 41.24% |
| 2027 | NA | NA | NA | NA | Industry Median | 13.83% |
| 2028 | NA | NA | NA | NA | MMM/Industry Median | 2.98 |
| Annualized Growth | 1.92% | 1.24% | 0.93% | 1.20% | Vs. S&P | 2.82 |
(Source: FactSet Research Terminal)
MMM’s margins are expected to rebound nicely in the coming years and rise to new record highs by 2026.
Return on capital is annual pre-tax profit/operating capital (the money it takes to run the business). ROC is Greenblatt’s gold standard proxy for quality and moatiness.
MMM’s ROC is expected to rise modestly to 41% by 2026, 3X that of its peers and 3X better than the S&P 500.
(Source: GuruFocus Premium)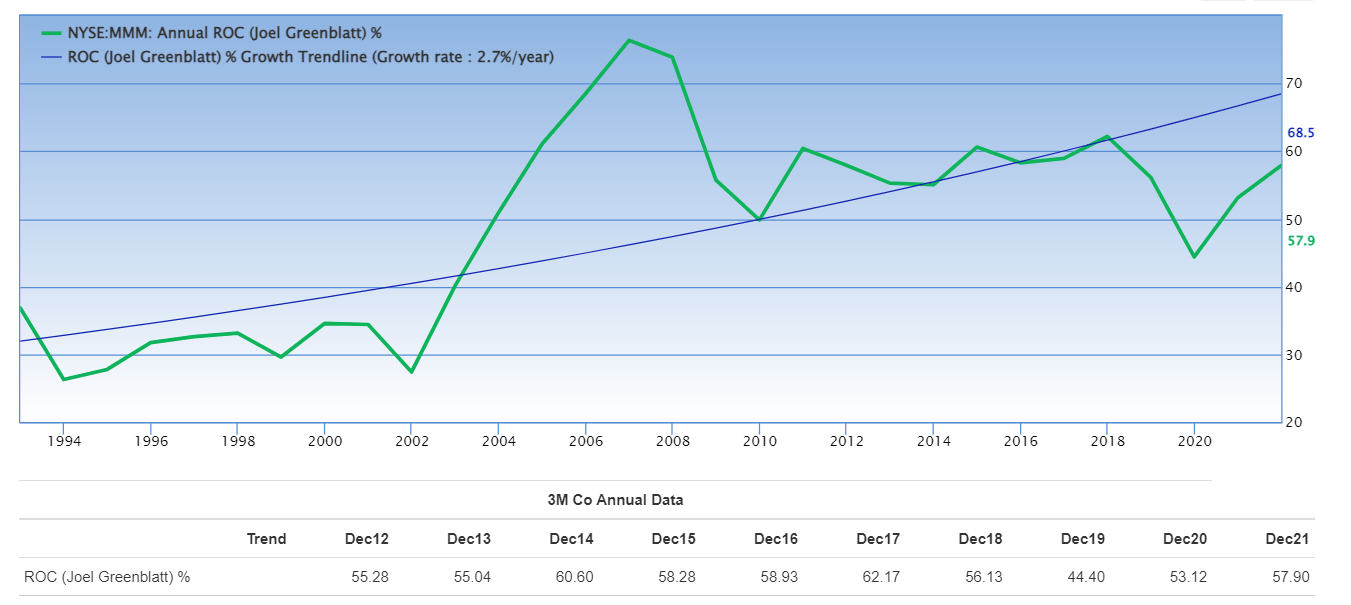
Over the last 30 years, MMM’s ROC has been trending higher at 2.7% annually, confirming its wide and stable moat.
MMM Medium-Term Growth Consensus Forecast
| Year | Sales | Free Cash Flow | EBITDA | EBIT (Operating Income) | Net Income |
| 2021 | $35,355 | $5,851 | $9,285 | $7,369 | $5,921 |
| 2022 | $35,044 | $4,868 | $9,211 | $7,573 | $5,946 |
| 2023 | $35,863 | $5,905 | $9,748 | $7,850 | $6,092 |
| 2024 | $37,153 | $6,446 | $10,304 | $8,189 | $6,275 |
| 2025 | $39,420 | $6,939 | $10,875 | $8,650 | $6,825 |
| 2026 | $40,157 | $7,310 | NA | $8,765 | $7,137 |
| Annualized Growth | 2.58% | 4.55% | 4.03% | 3.53% | 3.81% |
| Cumulative Next 2022-2025 | $147,480 | $24,158 | $40,138 | $32,262 | $25,138 |
(Source: FactSet Research Terminal)
MMM is expected to grow slowly in the next few years, though generate a very solid cash flow conversion of 96%.
- excellent for an industrial
- FCF is what pays the dividend
- indicates quality management
- and low accounting fraud risk
MMM Dividend Growth Consensus Forecast
| Year | Dividend Consensus | FCF/Share Consensus | FCF Payout Ratio | Retained (Post-Dividend) Free Cash Flow | Buyback Potential | Debt Repayment Potential |
| 2022 | $5.98 | $7.31 | 81.8% | $758 | 1.05% | 4.5% |
| 2023 | $6.16 | $9.37 | 65.7% | $1,830 | 2.54% | 10.7% |
| 2024 | $6.34 | $11.97 | 53.0% | $3,209 | 4.46% | 18.7% |
| Total 2022 Through 2024 | $18.48 | $28.65 | 64.5% | $5,796.90 | 8.05% | 33.76% |
| Annualized Rate | 3.0% | 28.0% | -19.5% | 105.7% | 105.7% | 103.0% |
(Source: FactSet Research Terminal)
Credit rating agencies consider 60% a safe payout ratio for industrials.
MMM’s payout ratio was elevated during the pandemic, and management is using very conservative dividend increases to bring it back to safe levels.
By 2024 3M’s consensus FCF payout ratio is down to 53%, and likely it will keep falling until we get further information about actual future legal liabilities.
3M’s post-dividend retained free cash flow for the next three years is an estimated $5.8 billion, enough to pay off 34% of its debt or buy back up to 8% of shares at current valuations.
MMM Buyback Consensus Forecast
| Year | Consensus Buybacks ($ Millions) | % Of Shares (At Current Valuations) | Market Cap |
| 2022 | $1,969 | 2.7% | $72,021 |
| 2023 | $1,913 | 2.7% | $72,021 |
| 2024 | $2,165 | 3.0% | $72,021 |
| Total 2022 through 2024 | $6,047 | 8.4% | $72,021 |
| Annualized Rate | 2.9% | Average Annual Buybacks | $2,016 |
| 1% Buyback Tax | $60 | Average Annual Buyback Tax | $20 |
(Source: FactSet Research Terminal)
Analysts expect 3M to still buy back $2.0 billion worth of shares during the next three years, a total of $6.0 billion that could potentially reduce the share count by nearly 3% per year at current valuations.
Ycharts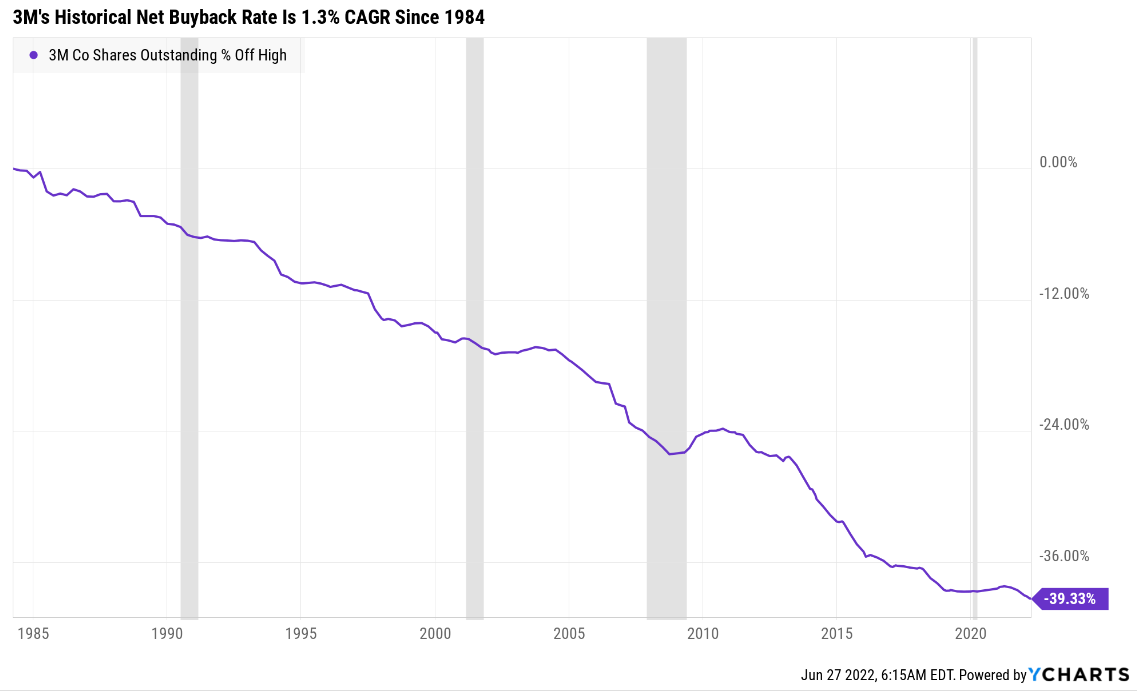
3M’s historical net buyback rate over 38 years is 1.3% per year.
- significant increase in the historical rate possible due to the best valuation in 11 years
| Time Frame (Years) | Net Buyback Rate | Shares Remaining | Net Shares Repurchased | Each Share You Own Is Worth X Times More (Not Including Future Growth And Dividends) |
| 5 | 1.3% | 93.67% | 6.33% | 1.07 |
| 10 | 1.3% | 87.73% | 12.27% | 1.14 |
| 15 | 1.3% | 82.18% | 17.82% | 1.22 |
| 20 | 1.3% | 76.97% | 23.03% | 1.30 |
| 25 | 1.3% | 72.10% | 27.90% | 1.39 |
| 30 | 1.3% | 67.53% | 32.47% | 1.48 |
(Source: DK Research Terminal, Ycharts)
If MMM buys back shares at its historical rate, it could repurchase 33% of shares over the next 30 years.
| Time Frame (Years) | Net Buyback Rate | Shares Remaining | Net Shares Repurchased | Each Share You Own Is Worth X Times More (Not Including Future Growth And Dividends) |
| 5 | 2.9% | 86.32% | 13.68% | 1.16 |
| 10 | 2.9% | 74.51% | 25.49% | 1.34 |
| 15 | 2.9% | 64.31% | 35.69% | 1.55 |
| 20 | 2.9% | 55.51% | 44.49% | 1.80 |
| 25 | 2.9% | 47.92% | 52.08% | 2.09 |
| 30 | 2.9% | 41.36% | 58.64% | 2.42 |
(Source: DK Research Terminal, Ycharts)
If MMM buys back shares as aggressively as analysts currently expect, over 30 years, it should repurchase almost 60% of its shares.
MMM Long-Term Growth Outlook
(Source: FactSet Research Terminal)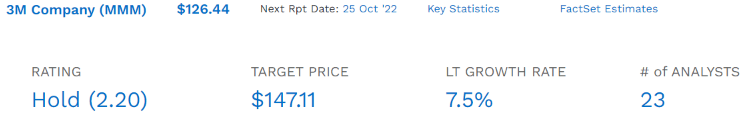
- 5.0% to 7.5% growth consensus range (five sources)
- the median consensus from all 23 analysts is 7.5%
- the 35-year growth rate is 8%
- the 20-year growth rate is 7.5%
How accurate is management guidance? Which is what most forecasts are based on?
FAST Graphs, FactSet Research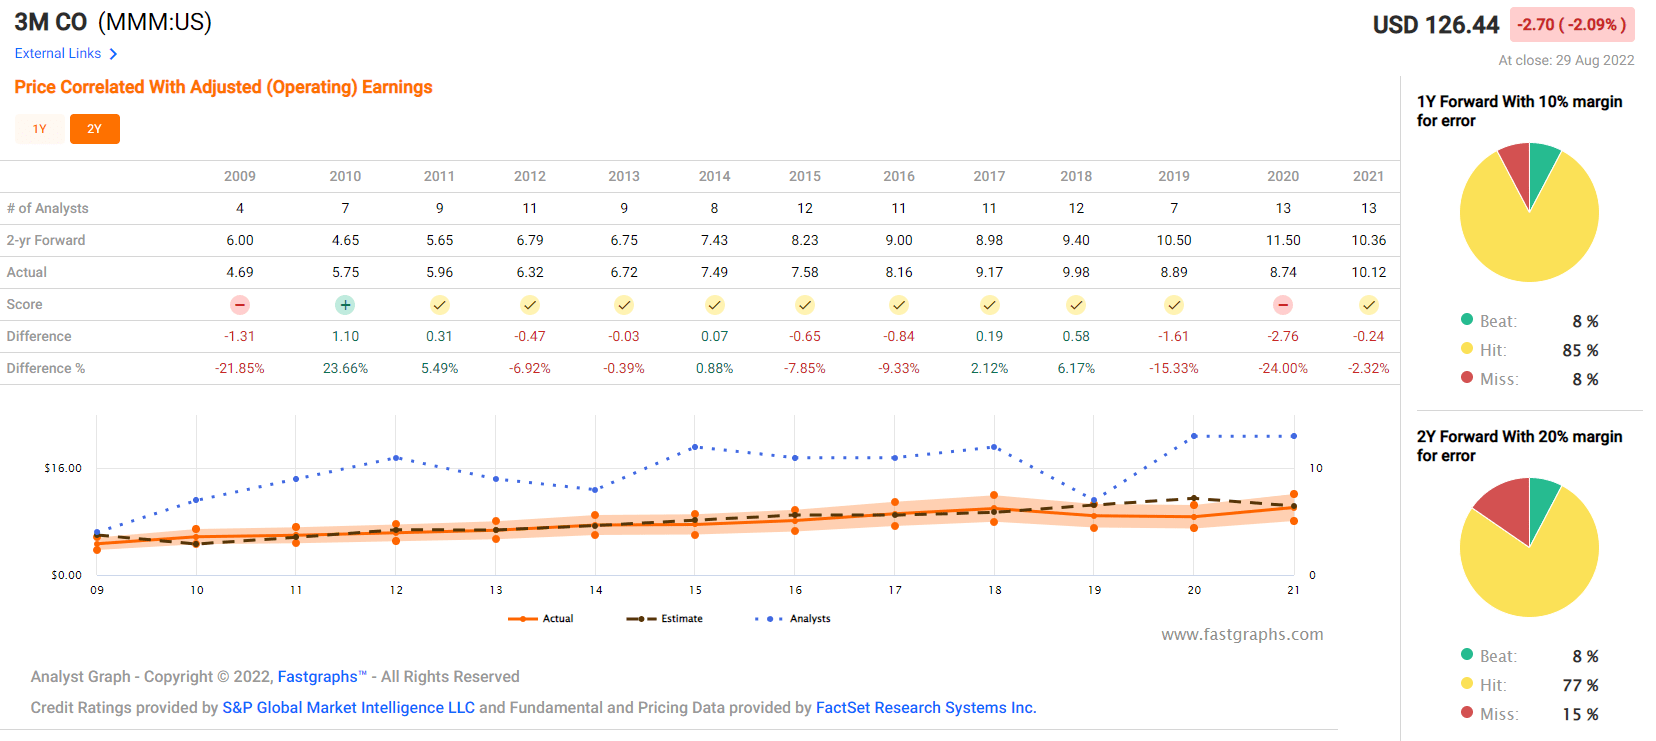
- Smoothing for outliers, historical analyst margins-of-error are 10% to the downside and 5% to the upside
- margin-of-error adjusted growth guidance range: 4% to 8% CAGR
- 70% statistical probability that MMM grows 4% to 8% over time
(Source: FAST Graphs, FactSet Research)
(Source: FAST Graphs, FactSet Research)
(Source: FAST Graphs, FactSet Research)
MMM is expected to return to its historical growth rate of about 8% in the coming years, though not until after 2026.
Reason Three: A Wonderful Company At An Unbelievable Price
(Source: FAST Graphs, FactSet)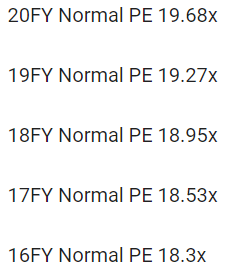
(Source: FAST Graphs, FactSet)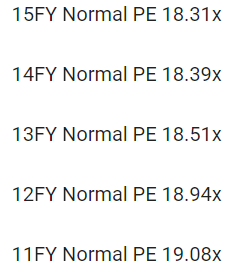
(Source: FAST Graphs, FactSet)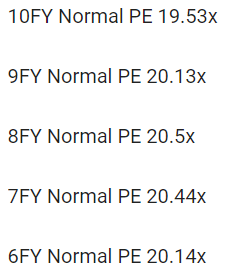
For 20 years, outside of bear markets and bubbles, millions of income growth investors have consistently paid between 18.5 and 20.5X earnings for MMM.
- 91% statistical probability that this approximates intrinsic value
| Metric | Historical Fair Value Multiples (all-Years) | 2021 | 2022 | 2023 | 2024 | 2025 |
12-Month Forward Fair Value |
| 5-Year Average Yield | 3.29% | $179.03 | $181.16 | $181.16 | $192.71 | NA | |
| 25- Year Average Yield | 2.71% | $217.34 | $219.93 | $219.93 | $233.95 | NA | |
| Earnings | 19.68 | $199.16 | $204.67 | $213.53 | $222.38 | $245.21 | |
| Average | $197.27 | $200.63 | $203.39 | $214.89 | $245.21 | $202.43 | |
| Current Price | $126.44 | ||||||
|
Discount To Fair Value |
35.90% | 36.98% | 37.83% | 41.16% | 48.44% | 37.54% | |
|
Upside To Fair Value (NOT Including Dividends) |
56.02% | 58.68% | 60.86% | 69.96% | 93.94% | 60.10% (65% including dividend) | |
| 2022 EPS | 2023 EPS | 2022 Weighted EPS | 2023 Weighted EPS | 12-Month Forward EPS | 12-Month Average Fair Value Forward PE |
Current Forward PE |
|
| $10.40 | $10.85 | $3.60 | $7.09 | $10.69 | 18.9 | 11.8 |
I estimate MMM is historically valued at 19X earnings and today trades at 11.8X.
- 9.2X cash-adjusted earnings Vs. 12.7 historical
- on a cash-adjusted PE basis, 28% undervalued
|
Analyst Median 12-Month Price Target |
Morningstar Fair Value Estimate |
| $147.11 (13.6 PE) | $183.00 (17.1 PE) |
|
Discount To Price Target (Not A Fair Value Estimate) |
Discount To Fair Value |
| 14.05% | 30.91% |
|
Upside To Price Target (Not Including Dividend) |
Upside To Fair Value (Not Including Dividend) |
| 16.35% | 44.73% |
|
12-Month Median Total Return Price (Including Dividend) |
Fair Value + 12-Month Dividend |
| $153.07 | $188.96 |
|
Discount To Total Price Target (Not A Fair Value Estimate) |
Discount To Fair Value + 12-Month Dividend |
| 17.40% | 33.09% |
|
Upside To Price Target (Including Dividend) |
Upside To Fair Value + Dividend |
| 21.06% | 49.45% |
Morningstar’s discounted cash flow fair value estimate is slightly more conservative but consistent with MMM’s historical cash-adjusted PE.
Morningstar agrees that MMM has massive upside potential to fair value.
Analysts expect the PE to be 13.6X in 12 months, delivering a 21% total return.
- 65% total return within 12 months would be justified by its fundamentals
I don’t recommend companies based on 12-month forecasts but on the margin of safety and whether or not it sufficiently compensates you for a company’s risk profile.
Margin Of Safety Not 12-Month Price Targets Are How I Make Investment Decisions
| Rating | Margin Of Safety For Low-Risk 13/13 Quality Ultra SWANs | 2022 Fair Value Price | 2023 Fair Value Price |
12-Month Forward Fair Value |
| Potentially Reasonable Buy | 0% | $200.63 | $203.39 | $202.43 |
| Potentially Good Buy | 5% | $190.60 | $193.22 | $192.31 |
| Potentially Strong Buy | 15% | $170.53 | $172.88 | $172.07 |
| Potentially Very Strong Buy | 25% | $142.95 | $152.54 | $151.82 |
| Potentially Ultra-Value Buy | 35% | $130.41 | $132.20 | $131.58 |
| Currently | $126.44 | 36.98% | 37.83% | 37.54% |
| Upside To Fair Value (Not Including Dividends) | 58.68% | 60.86% | 60.10% |
For anyone comfortable with its risk profile MMM is a potential Buffett-style ultra-value “fat pitch” buy.
Risk Profile: Why 3M Isn’t Right For Everyone
There are no risk-free companies, and no company is right for everyone. You have to be comfortable with the fundamental risk profile.
What Could Cause MMM’s Investment Thesis To Break
- safety falls to 40% or less
- balance sheet collapses (approximately 0.63% or less probability according to rating agencies)
- realized legal liabilities turn out to be much higher than most analysts, and rating agencies expect
- growth outlook falls to less than 5.3% for seven years
- MMM’s role in my portfolio is to deliver long-term 10+% returns with minimal fundamental risk
- 8+% total return requirement for defensive sectors (including healthcare)
- 10+% for non-defensive (cyclical) sectors
How long it takes for a company’s investment thesis to break depends on the quality of the company.
| Quality |
Years For The Thesis To Break Entirely |
| Below-Average | 1 |
| Average | 2 |
| Above-Average | 3 |
| Blue-Chip | 4 |
| SWAN | 5 |
| Super SWAN | 6 |
| Ultra SWAN | 7 |
| 100% Quality Companies (MSFT, LOW, and MA) | 8 |
These are my rule of thumb for when to sell a stock if the investment thesis has broken. MMM is highly unlikely to suffer such catastrophic declines in fundamentals.
MMM’s Risk Profile Includes
- ongoing pandemic disruption risks (falling and transitory)
- economic cyclicality risk
- litigation risk (PFAS and Earplugs)
- regulatory risk (mostly FTC approving future acquisitions)
- M&A execution risk
- market share risk (almost 2,700 major industrial competitors)
- supply chain disruption risk
- talent retention risk (an industry leader in labor relations)
- currency risk (over 50% of sales international)
How do we quantify, monitor, and track such a complex risk profile? By doing what big institutions do.
Long-Term Risk Analysis: How Large Institutions Measure Total Risk
- see the risk section of this video to get an in-depth view (and link to two reports) of how DK and big institutions measure long-term risk management by companies
MMM Long-Term Risk-Management Consensus
| Rating Agency | Industry Percentile |
Rating Agency Classification |
| MSCI 37 Metric Model | 100.0% |
AAA Industry Leader, Stable Trend |
| Morningstar/Sustainalytics 20 Metric Model | 85.7% |
33.6/100 High-Risk |
| Reuters’/Refinitiv 500+ Metric Model | 96.7% | Excellent |
| S&P 1,000+ Metric Model | 66.0% |
Above-Average, Stable Trend |
| Just Capital 19 Metric Model | 85.4% | Very Good |
| FactSet | 30.0% |
Below-Average, Positive Trend |
| Morningstar Global Percentile (All 15,000 Rated Companies) | 26.0% | Poor |
| Just Capital Global Percentile (All 954 Rated US Companies) | 78.7% | Good |
| Consensus | 71% |
Low-Risk, Good Risk-Management, Stable Trend |
(Sources: MSCI, Morningstar, FactSet, S&P, Just Capital, Reuters)
MMM’s Long-Term Risk Management Is The 168th Best In The Master List (66th Percentile)
| Classification | Average Consensus LT Risk-Management Industry Percentile |
Risk-Management Rating |
| S&P Global (SPGI) #1 Risk Management In The Master List | 94 | Exceptional |
| Strong ESG Stocks | 78 |
Good – Bordering On Very Good |
| Foreign Dividend Stocks | 75 | Good |
| 3M | 71 | Good |
| Ultra SWANs | 71 | Good |
| Low Volatility Stocks | 68 | Above-Average |
| Dividend Aristocrats | 67 | Above-Average |
| Dividend Kings | 63 | Above-Average |
| Master List average | 62 | Above-Average |
| Hyper-Growth stocks | 61 | Above-Average |
| Monthly Dividend Stocks | 60 | Above-Average |
| Dividend Champions | 57 | Average |
(Source: DK Research Terminal)
3M’s risk-management consensus is in the top 34% of the world’s highest quality companies and similar to that of such other blue-chips as
- Caterpillar (CAT) – dividend aristocrat
- British American Tobacco (BTI) – global aristocrat
- Clorox (CLX) – dividend aristocrat
- NextEra Energy (NEE) – dividend aristocrat
- McCormick (MKC) – dividend aristocrat
- Enbridge (ENB) – global aristocrat
- Canadian National Railway (CNI) – global aristocrat
The bottom line is that all companies have risks, and MMM is good at managing theirs.
How We Monitor MMM’s Risk Profile
- 23 analysts
- 2 credit rating agencies
- 7 total risk rating agencies
- 30 experts who collectively know this business better than anyone other than management
- the bond market provides real-time fundamental risk-assessments
When the facts change, I change my mind. What do you do, sir?” – John Maynard Keynes
There are no sacred cows at iREIT or Dividend Kings. Wherever the fundamentals lead, we always follow. That’s the essence of disciplined financial science, the math behind retiring rich and staying rich in retirement.
How To Find The Best High-Yield Sleep Well At Night Alternatives To 3M
What kind of returns could investors gain by buying 3M at the best valuations in 11 years?
3M 2024 Consensus Total Return Potential
(Source: FAST Graphs, FactSet) (Source: FAST Graphs, FactSet)
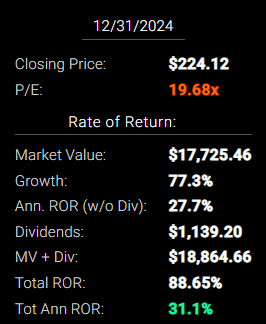
If MMM grows as expected and returns to historical fair value by the end of 2024 investors will earn 31% annual returns, nearly doubling their money.
- Buffett-like return potential from an Ultra SWAN dividend king bargain hiding in plain sight
3M 2027 Consensus Total Return Potential
(Source: FAST Graphs, FactSet) (Source: FAST Graphs, FactSet)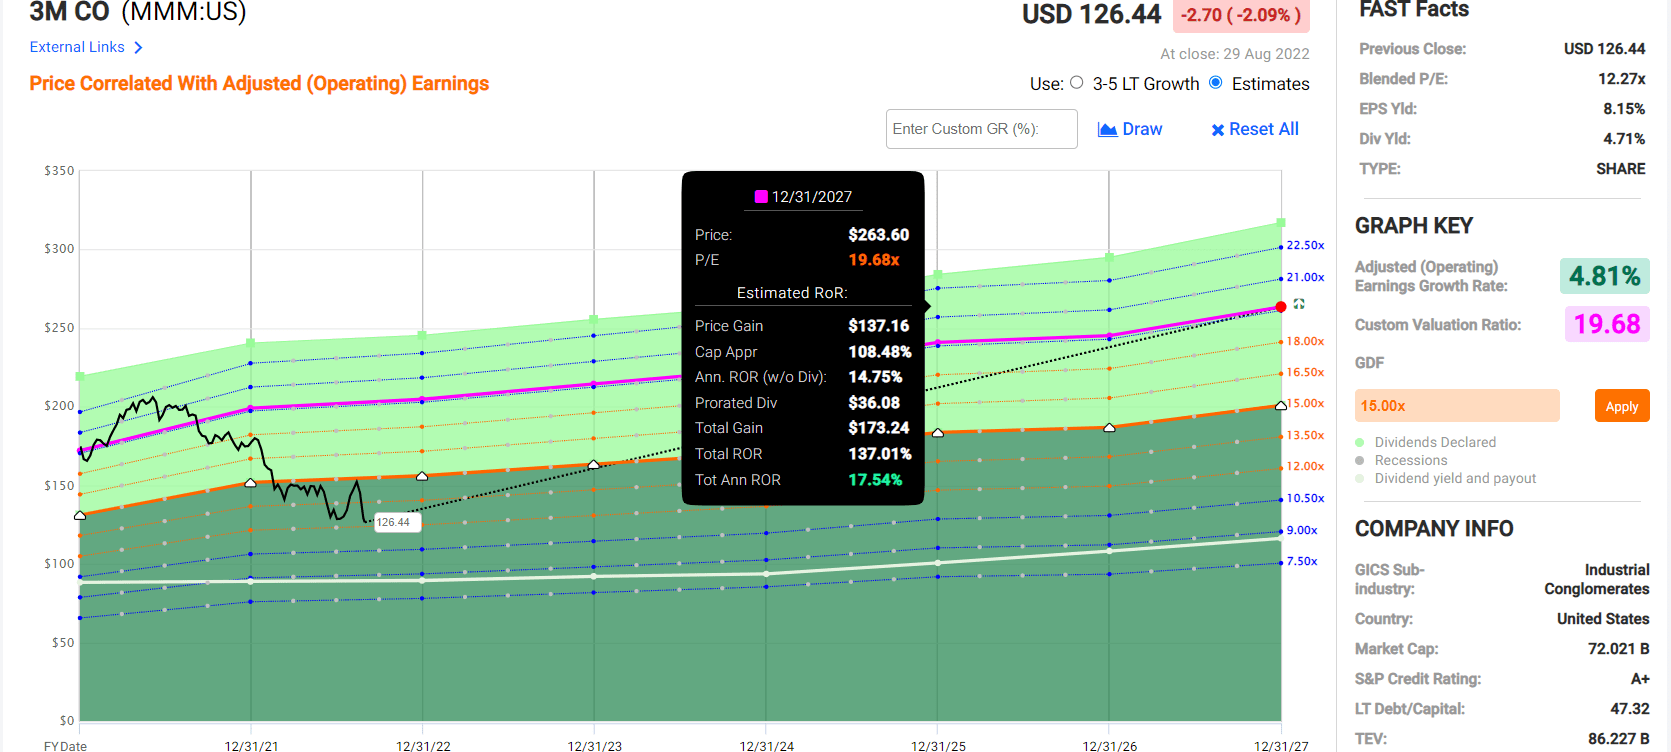
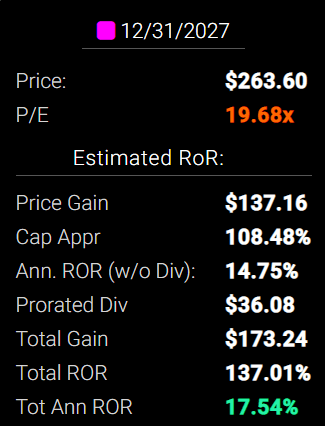
If MMM grows as expected and returns to fair value by 2027 investors would earn 137% total returns or 18% annually.
S&P 500 2024 Consensus Total Return Potential
(Source: FAST Graphs, FactSet) (Source: FAST Graphs, FactSet)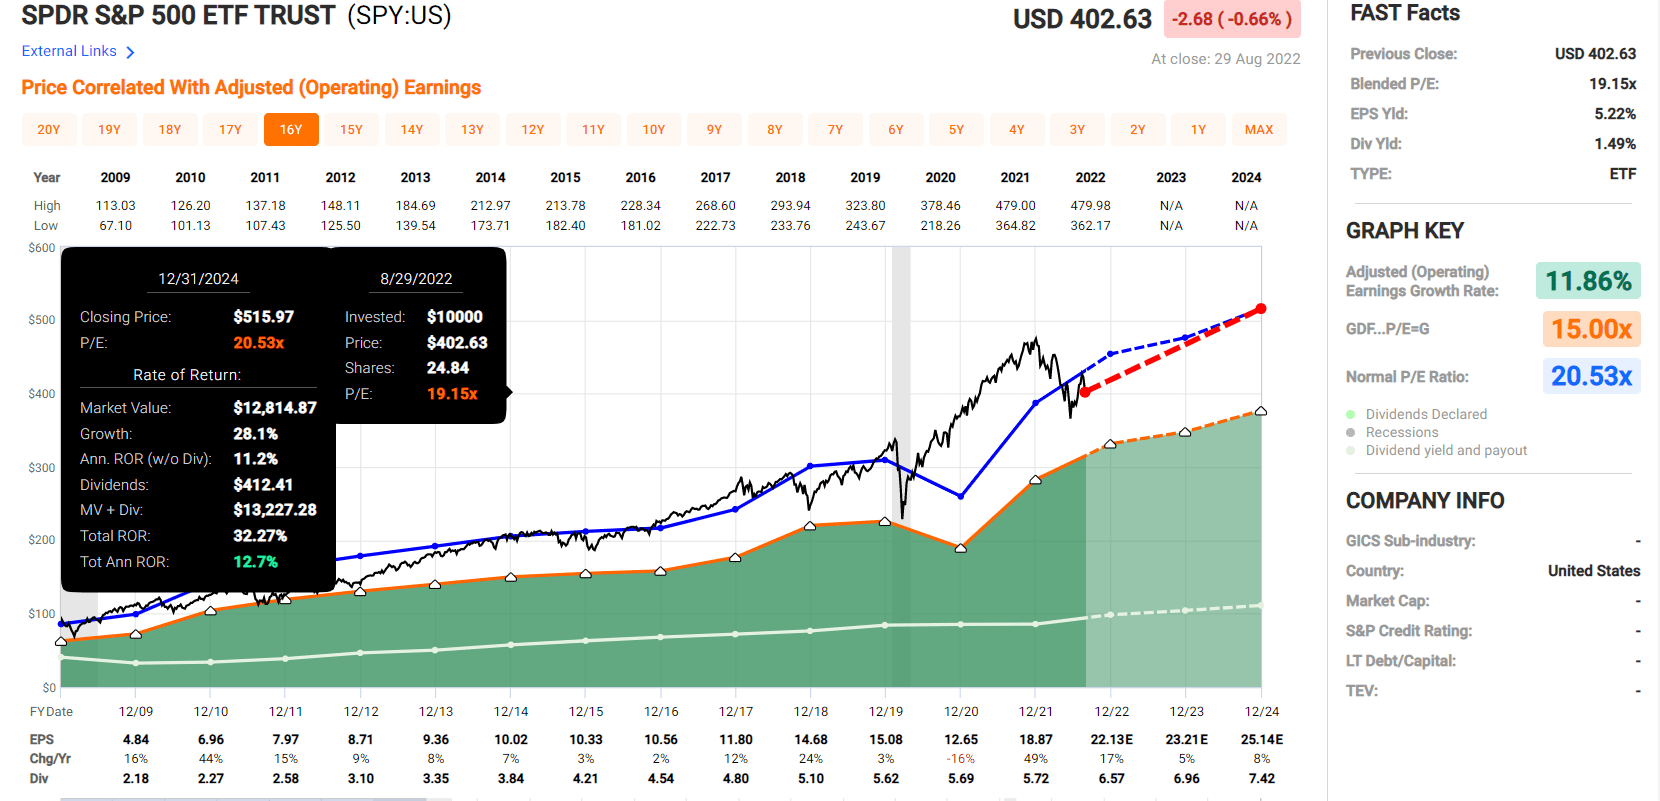
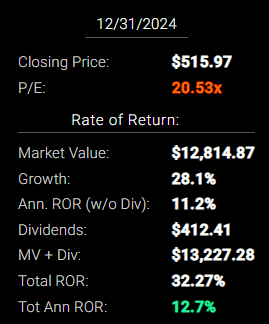
Analysts expect the S&P to deliver about 32% total returns over 2.5 years, or 13% annually.
- about 1/3rd what MMM might
S&P 500 2027 Consensus Total Return Potential
| Year | Upside Potential By End of That Year | Consensus CAGR Return Potential By End of That Year | Probability-Weighted Return (Annualized) |
Inflation And Risk-Adjusted Expected Returns |
| 2027 | 49.67% | 8.40% | 6.30% | 3.87% |
(Source: DK S&P 500 Valuation & Total Return Potential Tool)
Analysts expect the S&P to deliver a 50% total return in the next five years.
- MMM has almost 3X better return potential
MMM Investment Decision Score
DK (Source: DK Automated Investment Decision Tool)
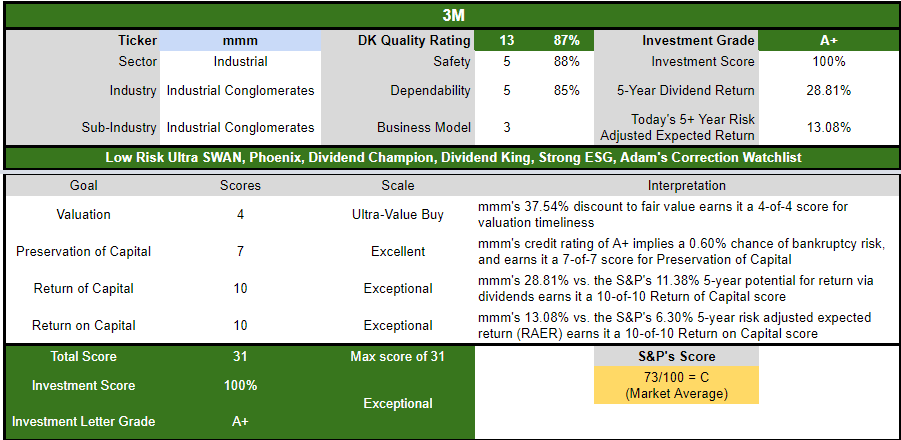
MMM is as close to an Ultra SWAN dividend king option for anyone comfortable with its risk profile.
- 38% discount vs. 1% market premium = 39% better valuation
- 4.7% yield vs. 1.6% yield (and a much safer yield at that)
- 20% better consensus long-term return potential
- 2X better risk-adjusted expected return over the next five years
- 2.5X more consensus income over the next five years
So does that mean that MMM is a slamdunk buy? Not necessarily, and here’s why.
3M compared to the S&P 500 is an exceptional opportunity. But compared to other blue-chip bargains, it’s not necessarily that impressive.
| Investment Strategy | Yield | LT Consensus Growth | LT Consensus Total Return Potential | Long-Term Risk-Adjusted Expected Return | Long-Term Inflation And Risk-Adjusted Expected Returns | Years To Double Your Inflation & Risk-Adjusted Wealth |
10-Year Inflation And Risk-Adjusted Expected Return |
| 3M | 4.7% | 7.5% | 12.2% | 8.5% | 6.3% | 11.4 | 1.85 |
| High-Yield (SCHD) | 3.7% | 8.5% | 12.3% | 8.6% | 6.4% | 11.3 | 1.86 |
| Dividend Aristocrats | 2.4% | 8.6% | 11.0% | 7.7% | 5.5% | 13.2 | 1.70 |
| S&P 500 | 1.6% | 8.5% | 10.1% | 7.1% | 4.9% | 14.8 | 1.61 |
| Nasdaq | 0.9% | 12.6% | 13.4% | 9.4% | 7.2% | 10.0 | 2.00 |
(Source: Morningstar, FactSet, Ycharts)
MMM is expected to outperform the aristocrats and S&P 500 and potentially match SCHD, the gold standard of high-yield ETFs.
- SCHD owns 100 of the world’s best high-yield blue-chips
- and is thus infinitely safer than buying 3M
How To Find The Best Alternatives To 3M In 2 Minutes
I use the Dividend Kings Zen Research Terminal when making every article for DK, iREIT, and SA. It runs off the DK 500 Master List.
The DK 500 Master List is one of the world’s best watchlists, including
- every dividend aristocrat (S&P companies with 25+ year dividend growth streaks)
- every dividend champion (every company, including foreign, with 25+ year dividend growth streaks)
- every dividend king (every company with 50+ year dividend growth streaks)
- every foreign aristocrat (every company with 20+ year dividend growth streaks)
- every Ultra SWAN (wide moat aristocrats, as close to perfect quality companies as exist)
- 40 of the world’s best growth stocks
Let me show you how to screen for superior alternatives to 3M.
- good buys, strong buys, very strong buys, ultra value buys: 195 companies remain (all with sufficient margins of safety for their risk profiles)
- 88+% quality score (3M or higher quality): 62 companies remain
- 87+% safe score (3M or higher safety): 61 companies remain
- 4.8+% yield (higher than 3M’s): 6 companies remain
- 12.3+% consensus long-term return potential (better than 3M’s): 3 companies remain
- total time: 2 minutes
(Source: Dividend Kings Zen Research Terminal)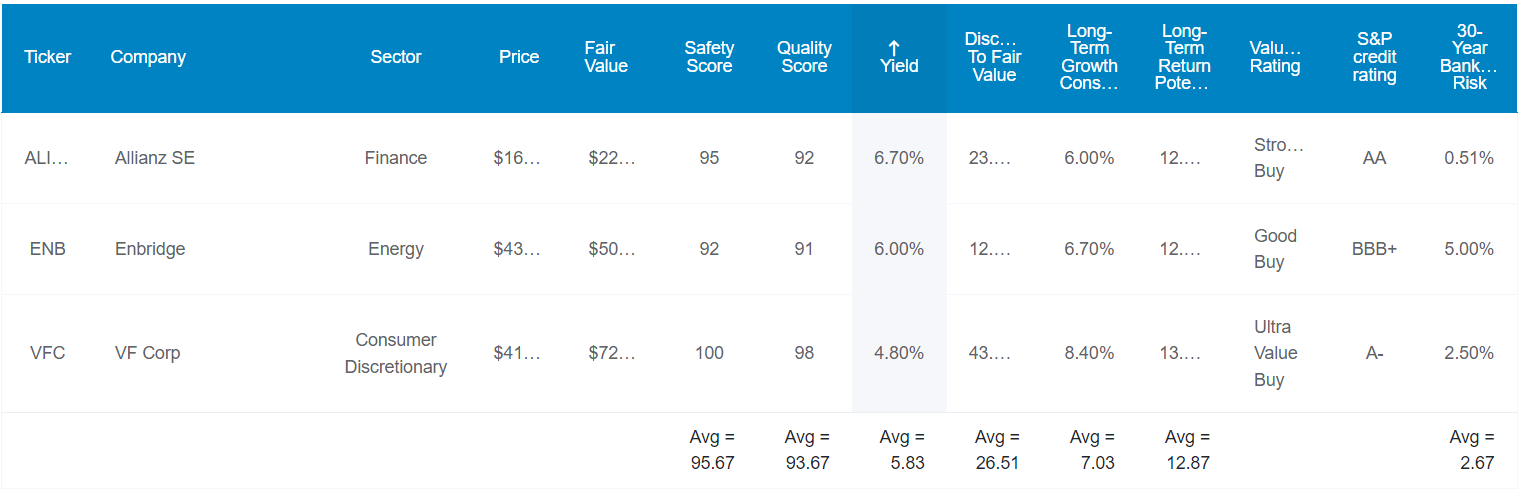
I’ve linked to deep dive articles about each company’s investment thesis, risk profile, growth prospects, valuation, and total return potential.
Tax Implications
- ALIZY is a German company with a 26.375% dividend tax withholding
- own ALIZY in a taxable account to get the tax credit and recoup the withholding tax
- ENB is a Canadian company with a 15% dividend withholding IN TAXABLE ACCOUNTS ONLY
- own ENB in a retirement account to avoid the withholding tax
- in taxable accounts, you get the tax credit to recoup the withholding
- What You Need To Know About Foreign Dividend Withholding Taxes
An alternative to buying MMM is to buy an equal amount of ALIZY, ENB, and VFC.
- 5.8% very safe yield
- 12.9% CAGR long-term return potential
- far less fundamental risk owning 3 Super and Ultra SWANs in 3 sectors
- no legal liability risk
Higher yield, higher potential returns, and less fundamental risk that’s the power of combining the world’s best high-yield blue-chips.
Investment Decision Score For ALIZY, ENB, VFC
DK (Source: DK Automated Investment Decision Tool, Combinator Tab) (Source: DK Automated Investment Decision Tool, Combinator Tab)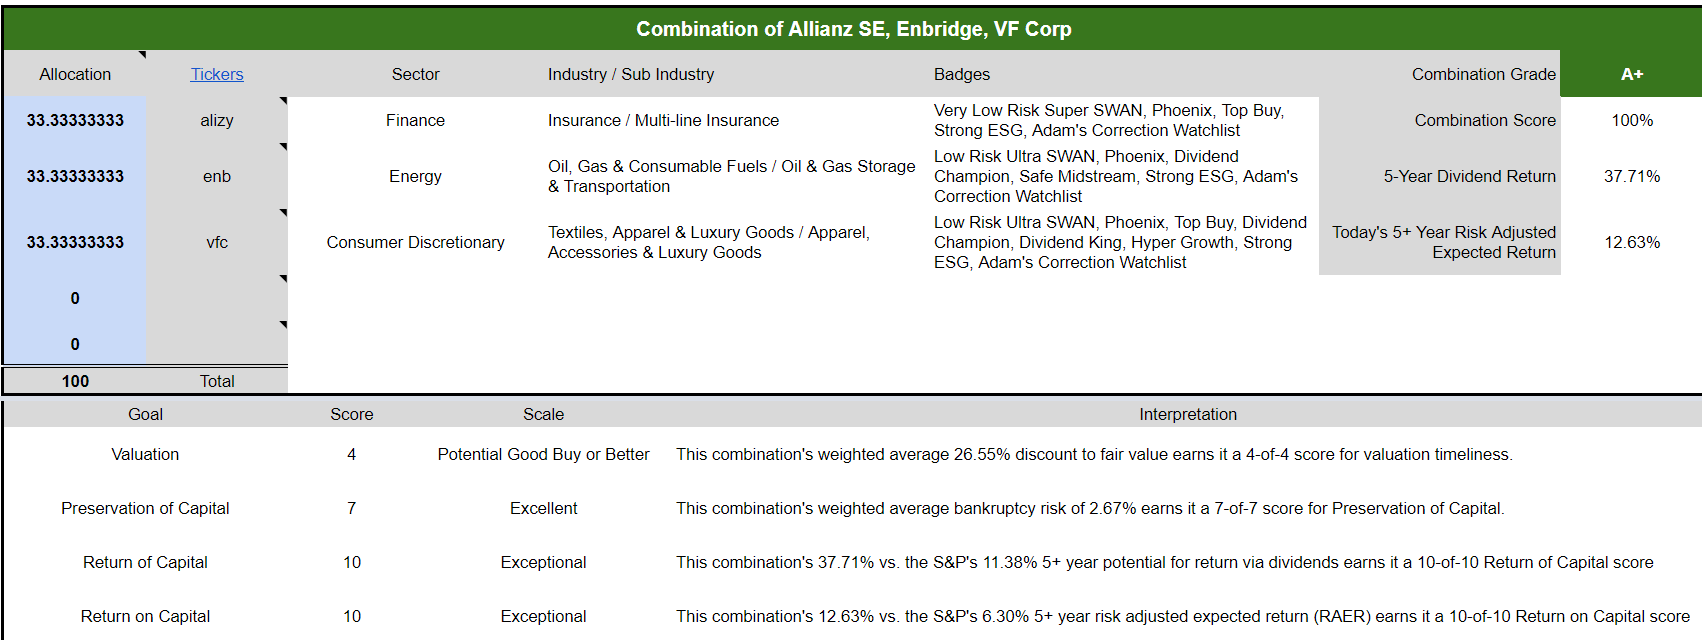

Combining these higher-yielding and higher-quality companies also delivers a 100% A+ exceptional investment opportunity.
(Source: DK Automated Investment Decision Tool, Combinator Tab)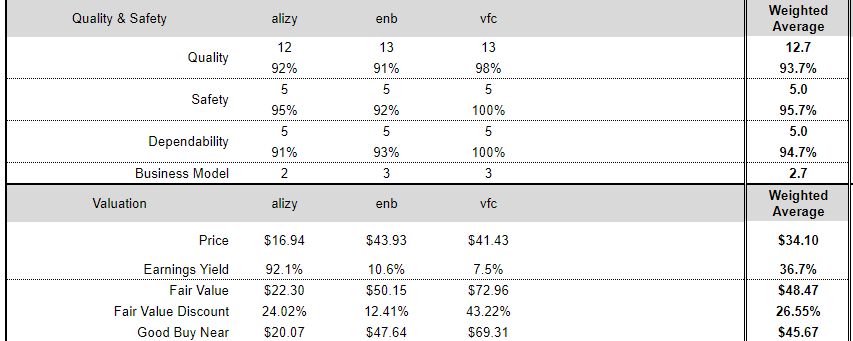
One that’s 27% undervalued and thus a potentially very strong buy.
(Source: DK Automated Investment Decision Tool, Combinator Tab)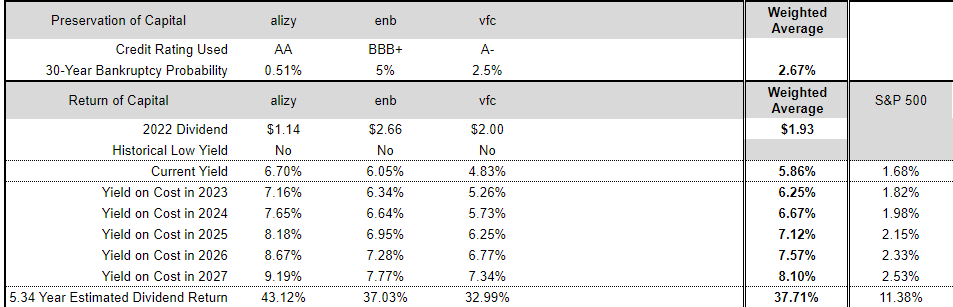
These three high-yield blue-chips offer 38% consensus income return in the next five years, compared to 28% for 3M and 11% for the S&P 500.
(Source: DK Automated Investment Decision Tool, Combinator Tab)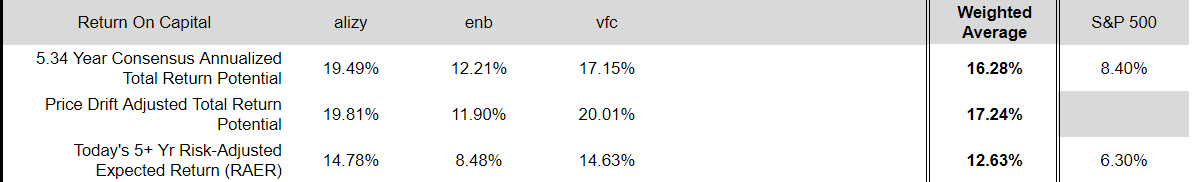
Their five-year consensus return potential is 16% CAGR, almost as good as 3M’s, and their risk-adjusted expected return is 13% CAGR, matching 3M’s.
Historical Returns Since April 1990 (Annual Rebalancing)
(Source: Portfolio Visualizer Premium)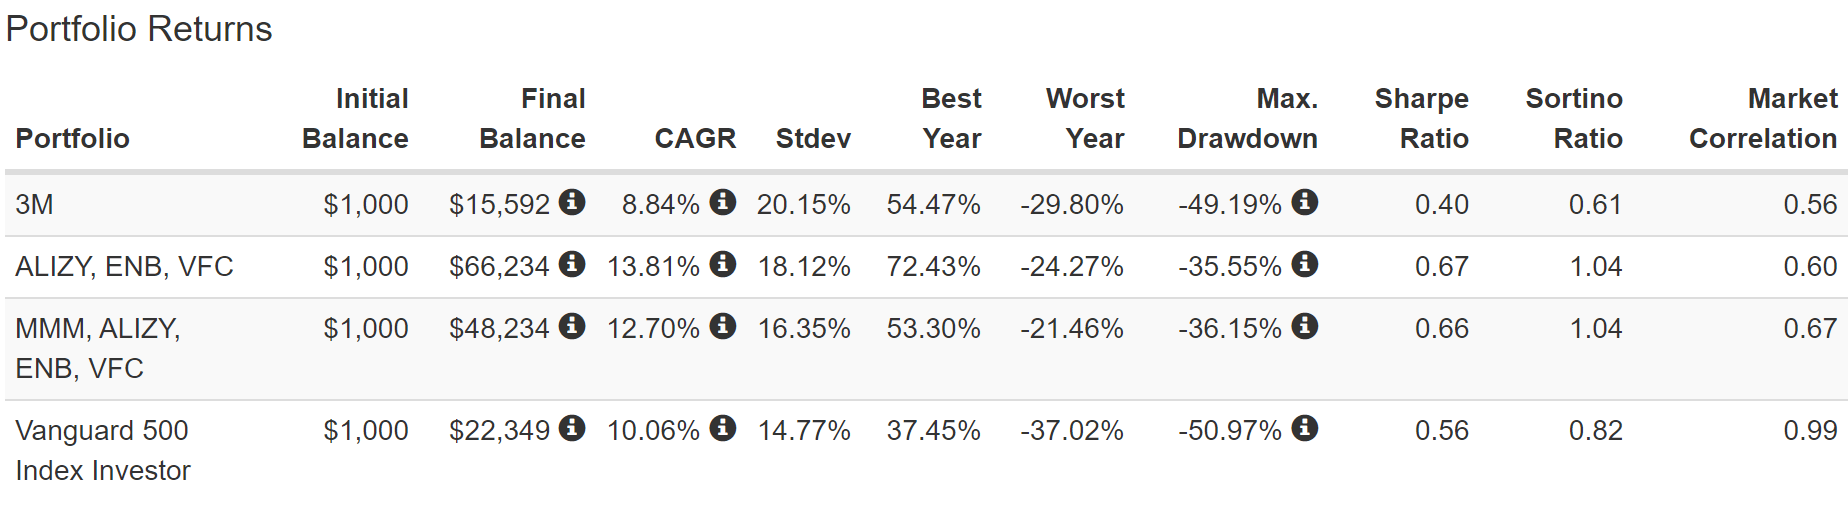
Combining blue-chips results in lower fundamental risk, lower volatility, smaller peak declines, and in this case, far better historical returns.
Owning 3M along with these three high-yield blue-chips smoothed out returns, enhanced returns, reduced volatility significantly, and resulted in far better negative volatility/adjusted returns (Sortino Ratio).
(Source: Portfolio Visualizer Premium)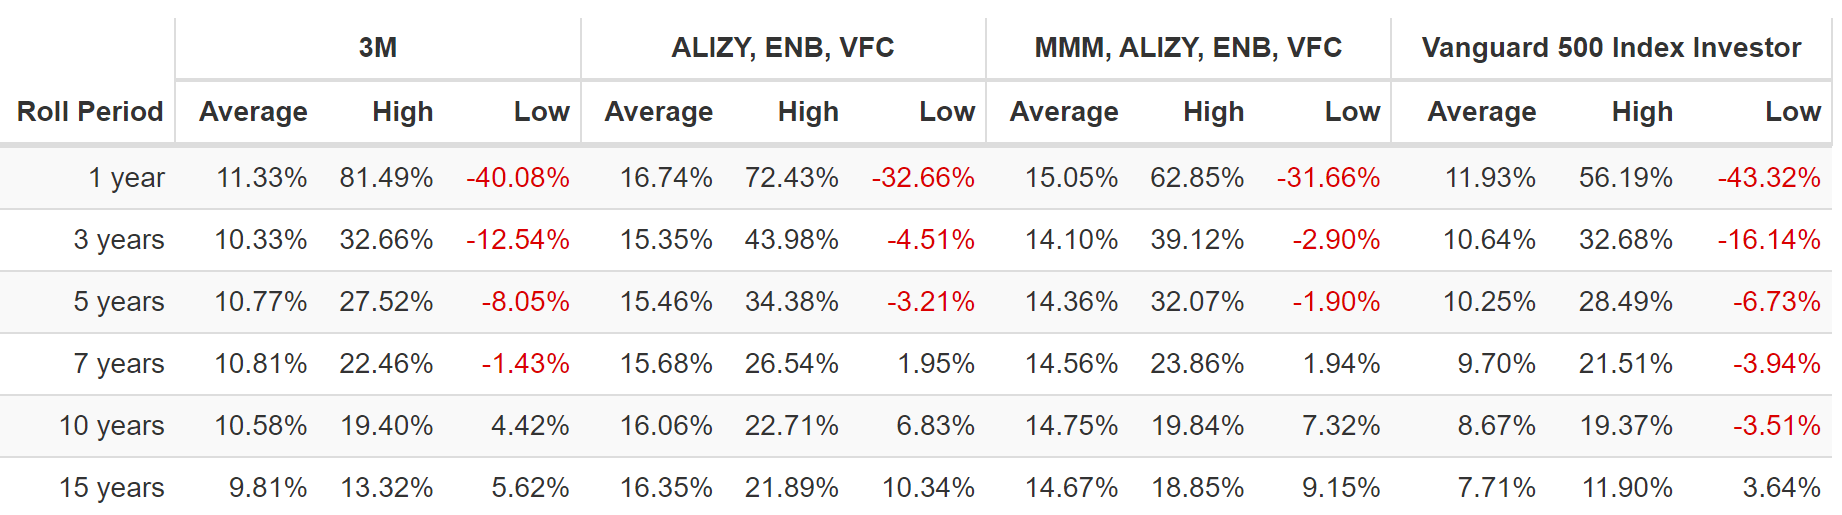
This is the power of diversification, the only free lunch on Wall Street.
Bottom Line: 3M Is A Table Pounding Buy, But So Are These 3 High-Yield Blue-Chip Alternatives
3M is a wonderful company at a wonderful price. But like any ultra value Ultra SWAN, it has its share of risks you need to be comfortable with.
3M is 38% historically undervalued, trading at 11.8X earnings and 9.2X cash-adjusted earnings.
It offers a 30% annual return potential through 2024 and a 17% CAGR through 2027.
Its long-term return potential is 12.2%, and its 4.7% yield is very safe.
And compared to the fairly valued S&P 500, it’s a potentially exceptional investment opportunity.
But ALIZY, ENB, and VFC all offer superior yield, quality, total return potential, and none of the legal liability headaches that could drag on for years.
If you want to own any blue-chip I recommend it needs to be as part of a diversified and prudently risk-managed portfolio.
Bundling blue-chip bargains each time you buy them is a prudent way to ensure good diversification.
- The Dividend Kings Investment Decision Score combinator can help you build 5 stock buckets to buy that best serve your needs, goals, and risk profiles
And by using the DK Zen Research Terminal to screen for the best blue-chips for your specific goals and risk profile, you ensure that you always maximize safe income and total returns over time.
This is the optimal way to focus on safety and quality first, and prudent valuation and sound risk management always. And that, my friends, is how you practice safe high-yield investing, retire rich, and stay rich in retirement.
Be the first to comment