

Jose Luis Pelaez Inc
Is this the start of the 5th bear market rally? Are stocks doomed to roll over yet again and crush the short-term dreams of the bulls?
Or was September 30th the true and final bear market bottom, and now we’re in a new bull market that could last for the next decade?
I can’t tell you the answer with any certainty because that’s not how the world works. Wall Street runs on probabilities and risk-management, not risk avoidance.
Whether or not this is a temporary relief rally or the real deal, I can tell you one thing with very high confidence.
Charlie Bilello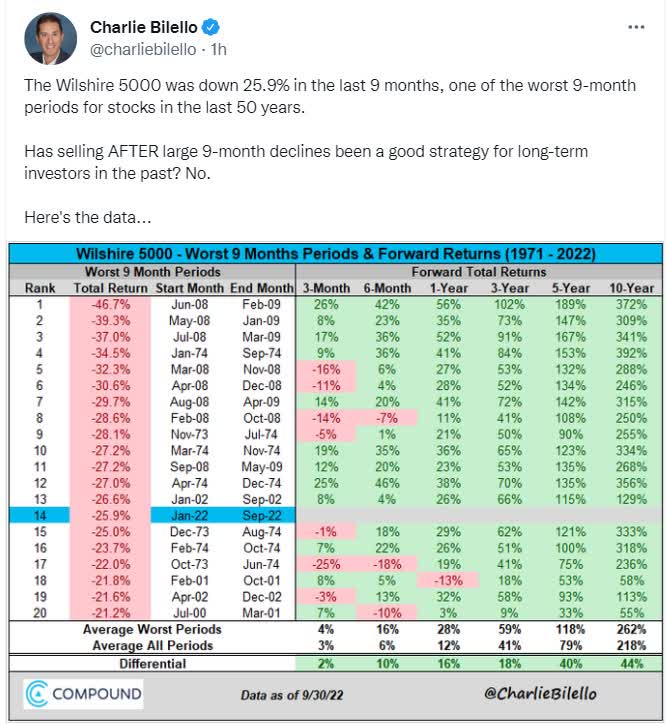
Selling now, because you are worried we have further to fall, is a mistake for anyone with a time horizon longer than 3 years.
If you have money invested you need in less than three years, it shouldn’t be invested in the stock market at all.
But if you have a time horizon of 3+ years, then selling now to avoid a potential 15% to 20% further decline (what the fundamentals say is most likely) will almost certainly lead to major regret in the coming years.
But fortunately, there are some truly world-class blue-chip bargain opportunities that are trading at such high margins of safety that the next few months won’t matter.
“The purpose of the margin of safety is to render the forecast unnecessary.” – Ben Graham
Let me share with you the three reasons why Taiwan Semiconductor (NYSE:TSM) is one of my favorite hyper-dividend growth blue-chip recommendations.
It’s not just a good buy, a strong buy, or a very strong buy. No, my friends, TSM is a pure Buffett-style, anti-bubble, table-pounding good buy, in my opinion.
Think I’m exaggerating? How does a 6.4X cash-adjusted PE and 0.27 PEG strike you? A private equity, anti-bubble valuation pricing in -4.2% CAGR growth for the world’s most dominant chip maker growing at 24%.
I believe this is truly a table-pounding opportunity you don’t want to miss.
Let me show you why TSM could potentially more than double in two years, quadruple in five years, and over 10+ years, could possibly help you retire in safety and splendor.
Reason One: Taiwan Semi Is The Complete Hyper-Dividend Growth Package
- What You Need To Know About Foreign Dividend Withholding Taxes
- TSM is a Taiwanese company, so US investors face 20% dividend withholding taxes on their shares.
- A tax credit recoups this if you fill out the paperwork and own them in taxable accounts.
- Own it in a taxable account to qualify for the tax credit and recoup the withholding tax.
What Taiwan Semi Does
Taiwan Semi is the world leader in chip manufacturing, building around 50% of the world’s chips. TSM has the world’s best chip makers as its customers including:
- QCOM
- NVDA
- AVGO
- Samsung
- AAPL
YCharts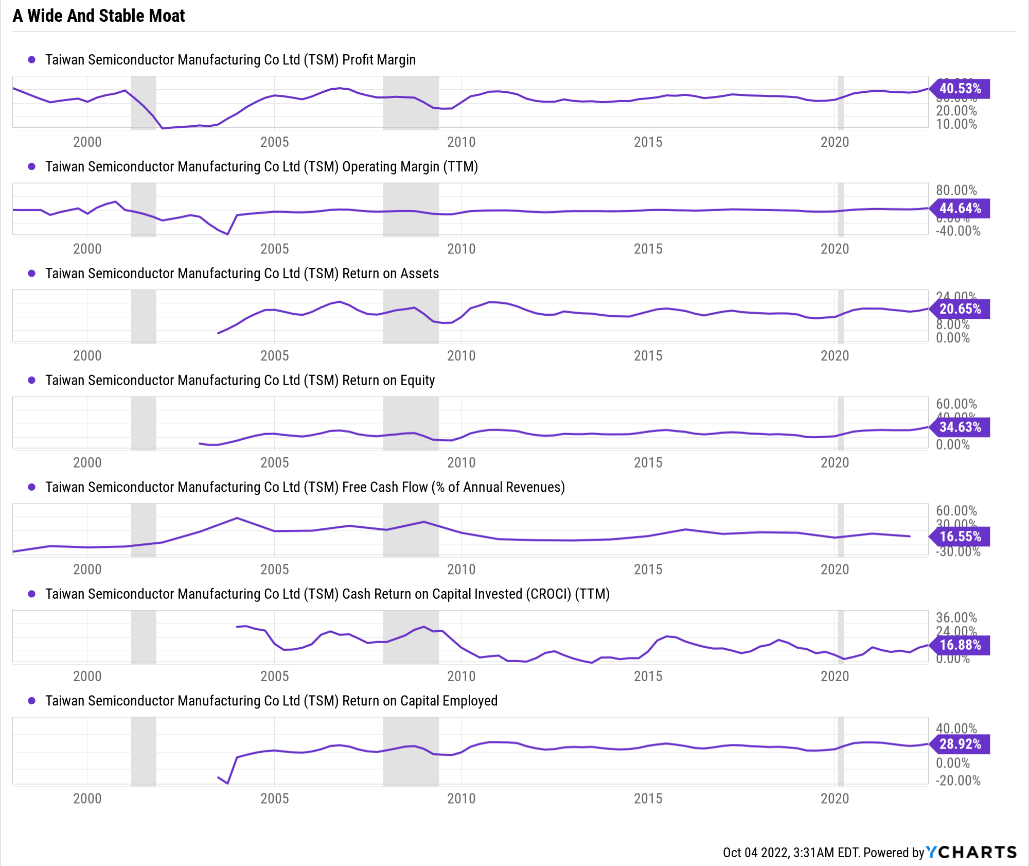
TSM’s economies of scale are legendary, allowing it to generate over 40% net margins in the last year.
(Source: GuruFocus Premium)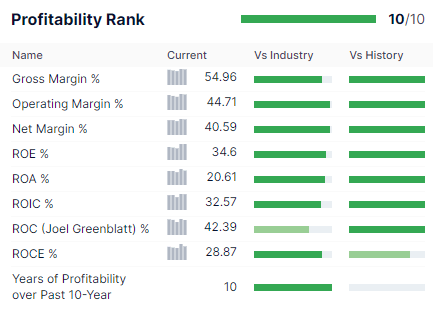
TSM’s historical profitability is in the top 5% of its peers, and its wide moat is maintained, thanks to its ability to outspend everyone else.
It plans to spend an extra $100 billion over the next three years to increase capacity, double the growth budget of the last few years. That includes a $12 billion chip factory in Arizona.
TSM isn’t just a manufacturer of chips; it’s a pioneer in R&D that enables chip makers like QCOM, NVDA, and AVGO to design chips that drive tech megatrends like AI, cloud computing, and driverless cars.
Taiwan Semi Growth Spending Consensus Forecast
| Year | SG&A (Selling, General, Administrative) | R&D | Capex | Total Growth Spending | Sales | Growth Spending/Sales |
| 2021 | $1,609 | $4,513 | $30,000 | $36,122 | $57,430 | 62.90% |
| 2022 | $1,911 | $5,455 | $38,250 | $45,616 | $73,031 | 62.46% |
| 2023 | $2,156 | $6,292 | $37,823 | $46,271 | $81,232 | 56.96% |
| 2024 | $5,907 | $7,371 | $38,965 | $52,243 | $95,500 | 54.70% |
| 2025 | NA | NA | $36,128 | NA | $115,824 | NA |
| Annualized Growth | 54.27% | 17.77% | 4.76% | 13.09% | 19.17% | NA |
| Total Spending 2022-2024 | $9,974 | $19,118 | $115,038 | $144,130 | $249,763 | NA |
(Source: FactSet Research Terminal)
TSM’s growth spending was $36 billion in 2021 and is expected to increase to $52 billion by 2024, according to FactSet.
The insatiable demand for chips is expected to drive 19% CAGR sales growth through 2025.
(Source: FactSet Research Terminal)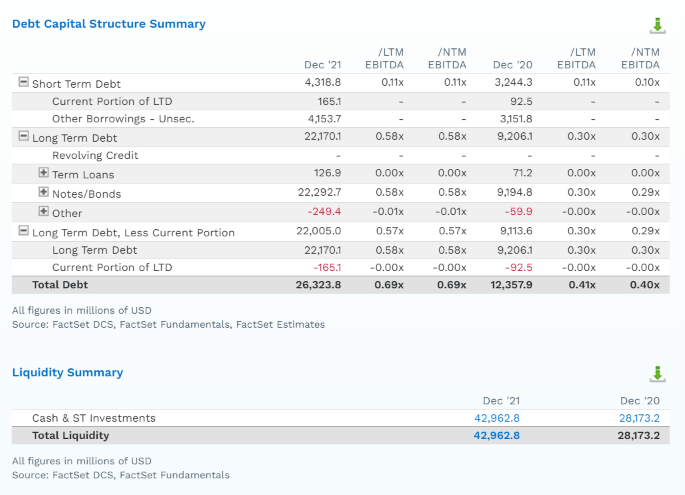
TSM is rated AA- stable by S&P and Moody’s, representing a very low 0.55% fundamental 30-year bankruptcy risk.
Rating agencies like to see 1.5X or less net debt/EBITDA and TSM’s absolute leverage is 0.7X, and it has $17 billion more cash than debt.
(Source: FactSet Research Terminal)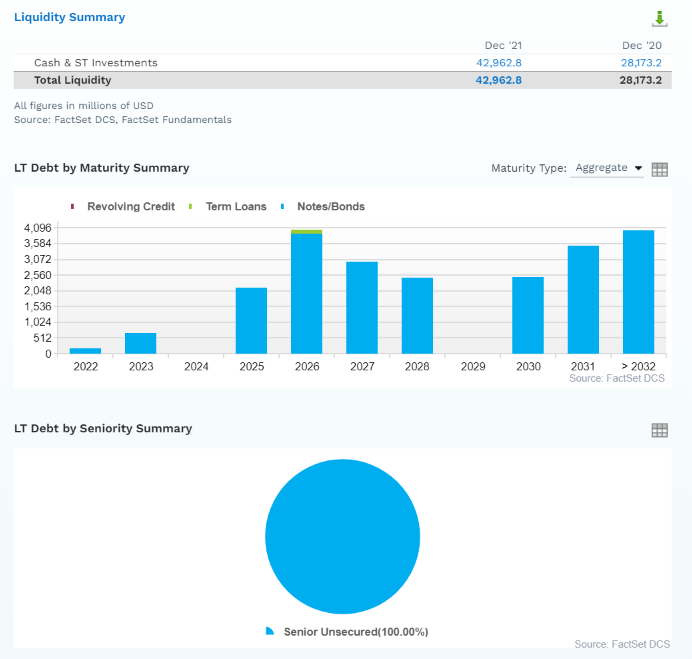
TSM has well-staggered bond maturities and 100% unsecured bonds for maximum financial flexibility.
No one in the world, in my estimation, can outspend TSM when it comes to building or innovating chip construction design.
- the US passed a $52 billion CHIPs act to spend more on chips over 10 years
- TSM will be spending $52 billion on growth in 2024… per year
The company has a policy of paying sustainable and growing dividends.
- four-year dividend growth streak
- but no cuts since it began paying one in 2003 (in local currency)
I believe there is absolutely nothing wrong with TSM, yet the price has fallen off a cliff, as interest rates soared.
YCharts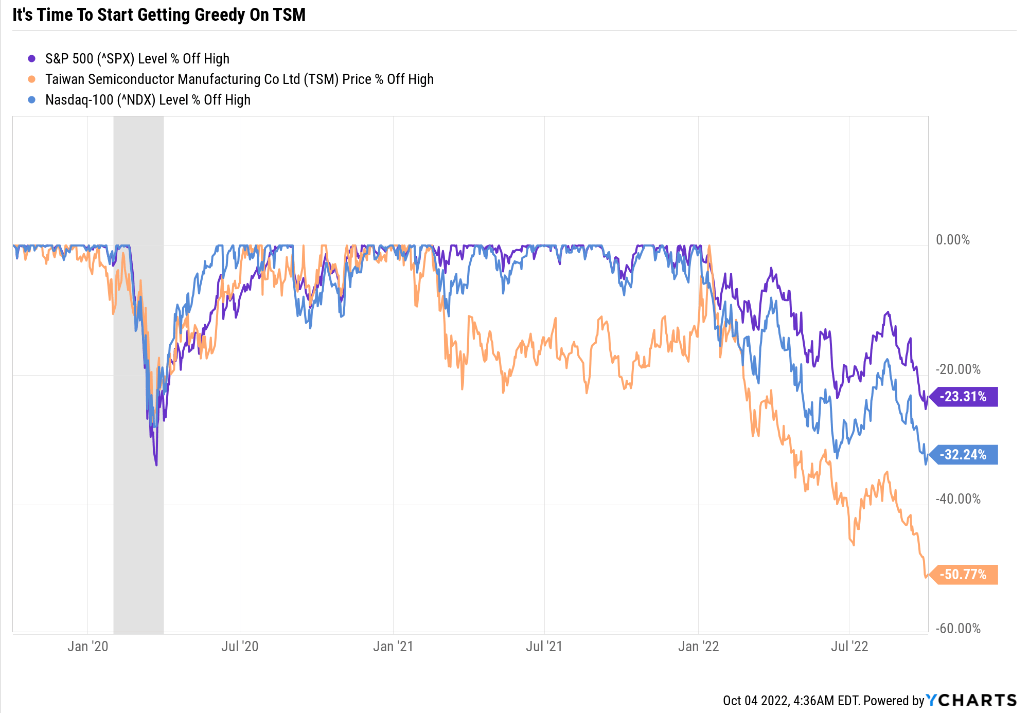
TSM has been cut in half, largely because it was in a bubble at the start of the year.
(Source: FAST Graphs, FactSet)
TSM went from crazy 67% overvalued to 43% undervalued in nine months.
It’s The Best Time In 7 Years To Buy Taiwan Semi
(Source: FAST Graphs, FactSet)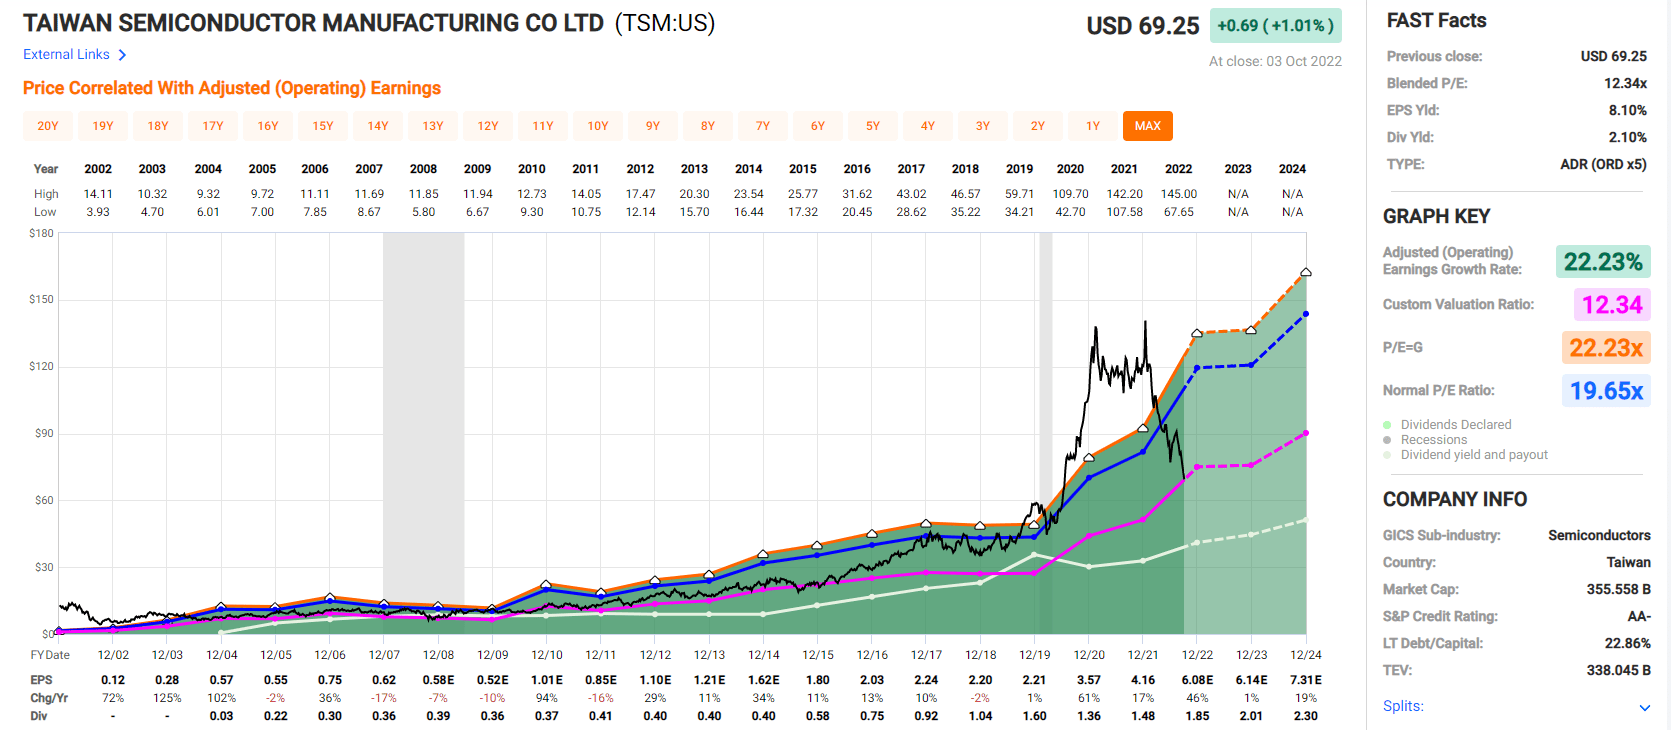
TSM hasn’t seen a valuation this low since 2015.
TSM Rolling Return Since 1997
(Source: Portfolio Visualizer Premium)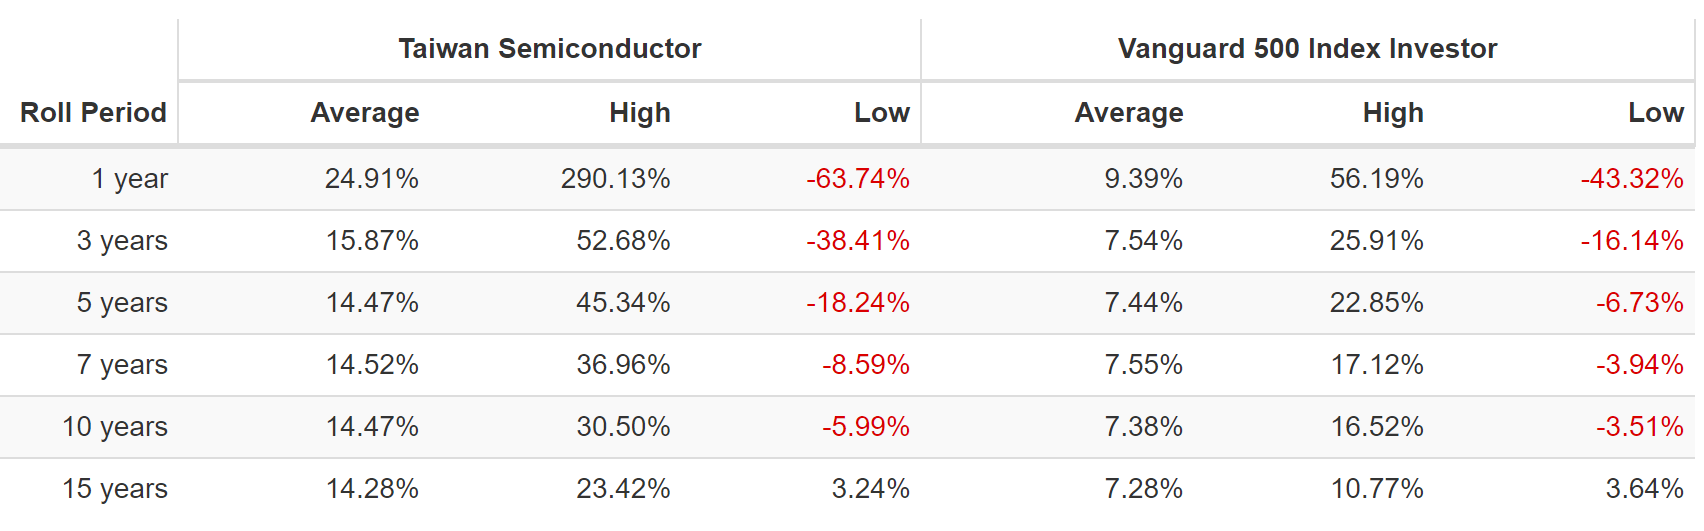
From bear market lows, it has historically delivered up to 30.5% annual returns over the next decade and 23.4% annual returns for 15 years.
- 14X over 10 years
- 23X over 15 years
Reasons To Potentially Buy Taiwan Semi Today
| Metric | Taiwan Semiconductor |
| Quality | 96% 13/13 SWAN (Sleep Well At Night) Chip Maker |
| Risk Rating | Low Risk |
| DK Master List Quality Ranking (Out Of 500 Companies) | 23 |
| Quality Percentile | 95% |
| Dividend Growth Streak (Years) | 4 |
| Dividend Yield | 2.7% |
| Payout Safety Score | 97% |
| Average Recession Dividend Cut Risk | 0.5% |
| Severe Recession Dividend Cut Risk | 1.15% |
| S&P Credit Rating | AA- Stable |
| 30-Year Bankruptcy Risk | 0.55% |
| Consensus LT Risk-Management Industry Percentile | 86% Very Good |
| Fair Value | $120.77 |
| Current Price | $69.25 |
| Discount To Fair Value | 43% |
| DK Rating |
Potentially Ultra Value, Buffett-style table-pounding strong buy |
| PE | 11.3 |
| Cash-Adjusted PE | 6.4 (anti-bubble blue-chip) |
| Growth Priced In | -4.2% |
| Historical PE | 17 to 21 |
| LT Growth Consensus/Management Guidance | 23.9% |
| PEG Ratio | 0.27 (Hyper-growth at a wonderful price) |
| 5-year consensus total return potential |
22% to 35% CAGR |
| Base Case 5-year consensus return potential |
31% CAGR (6X better than the S&P 500) |
| Consensus 12-month total return forecast | 59% |
| Fundamentally Justified 12-Month Return Potential | 77% |
| LT Consensus Total Return Potential | 26.6% |
| Inflation-Adjusted Consensus LT Return Potential | 24.3% |
| Consensus 10-Year Inflation-Adjusted Total Return Potential (Ignoring Valuation) | 8.81 |
| LT Risk-Adjusted Expected Return | 18.52% |
| LT Risk-And Inflation-Adjusted Return Potential | 16.23% |
| Conservative Years To Double | 4.44 |
(Source: Dividend Kings Zen Research Terminal)
TSM is trading at 6.4X cash-adjusted earnings, an anti-bubble valuation that means it’s priced for -4.2% CAGR growth.
In reality, it’s growing at over 20%.
Its PEG is 0.27, hyper-growth at a wonderful price.
Taiwan Semi 2024 Consensus Total Return Potential
(Source: FAST Graphs, FactSet)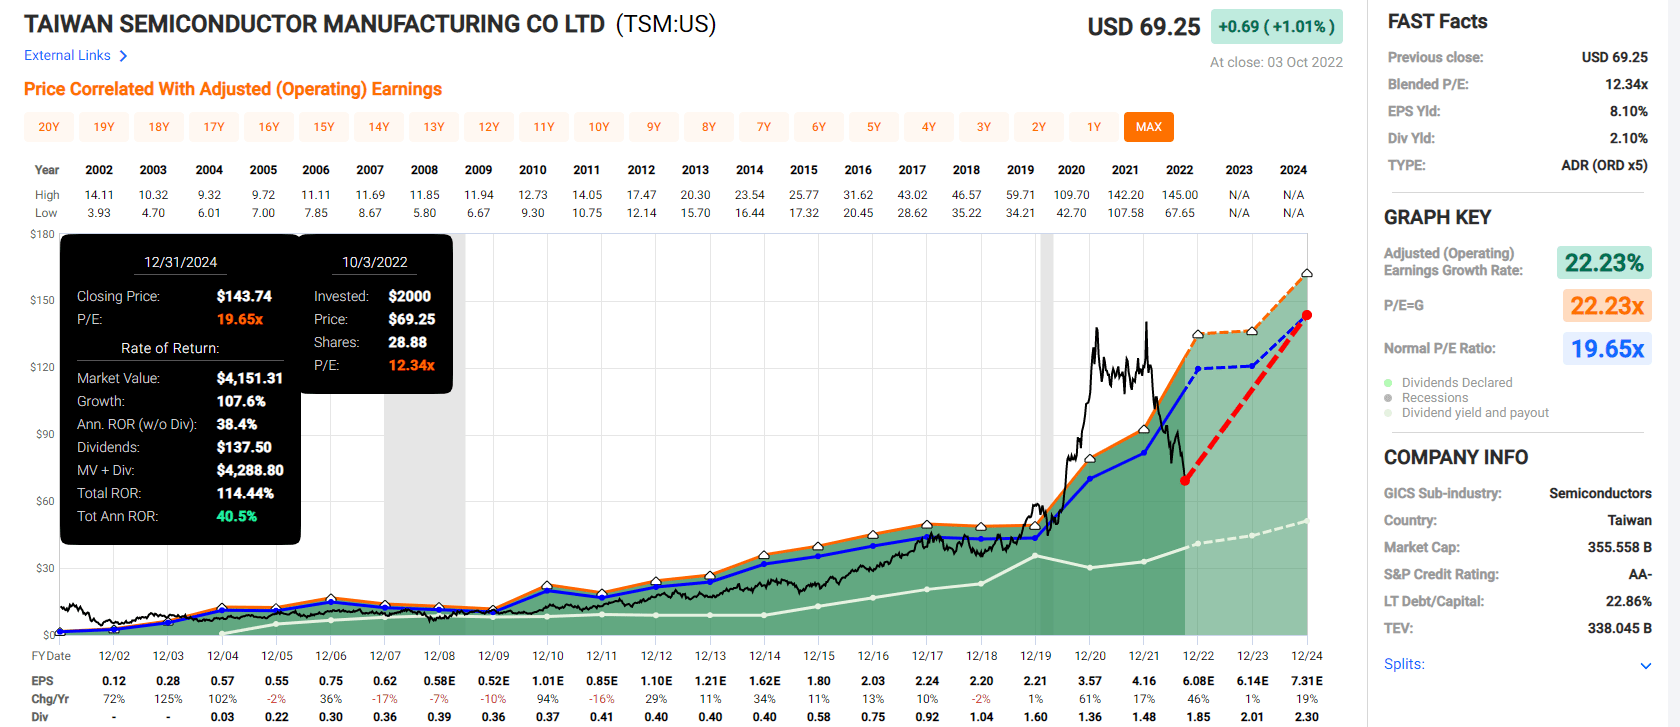
If TSM grows as expected and returns to historical fair value, it could deliver 114% returns by the end of 2024.
- Buffett-like 41% annual return potential
- 4X better than the S&P 500
Taiwan Semi 2027 Consensus Total Return Potential
(Source: FAST Graphs, FactSet)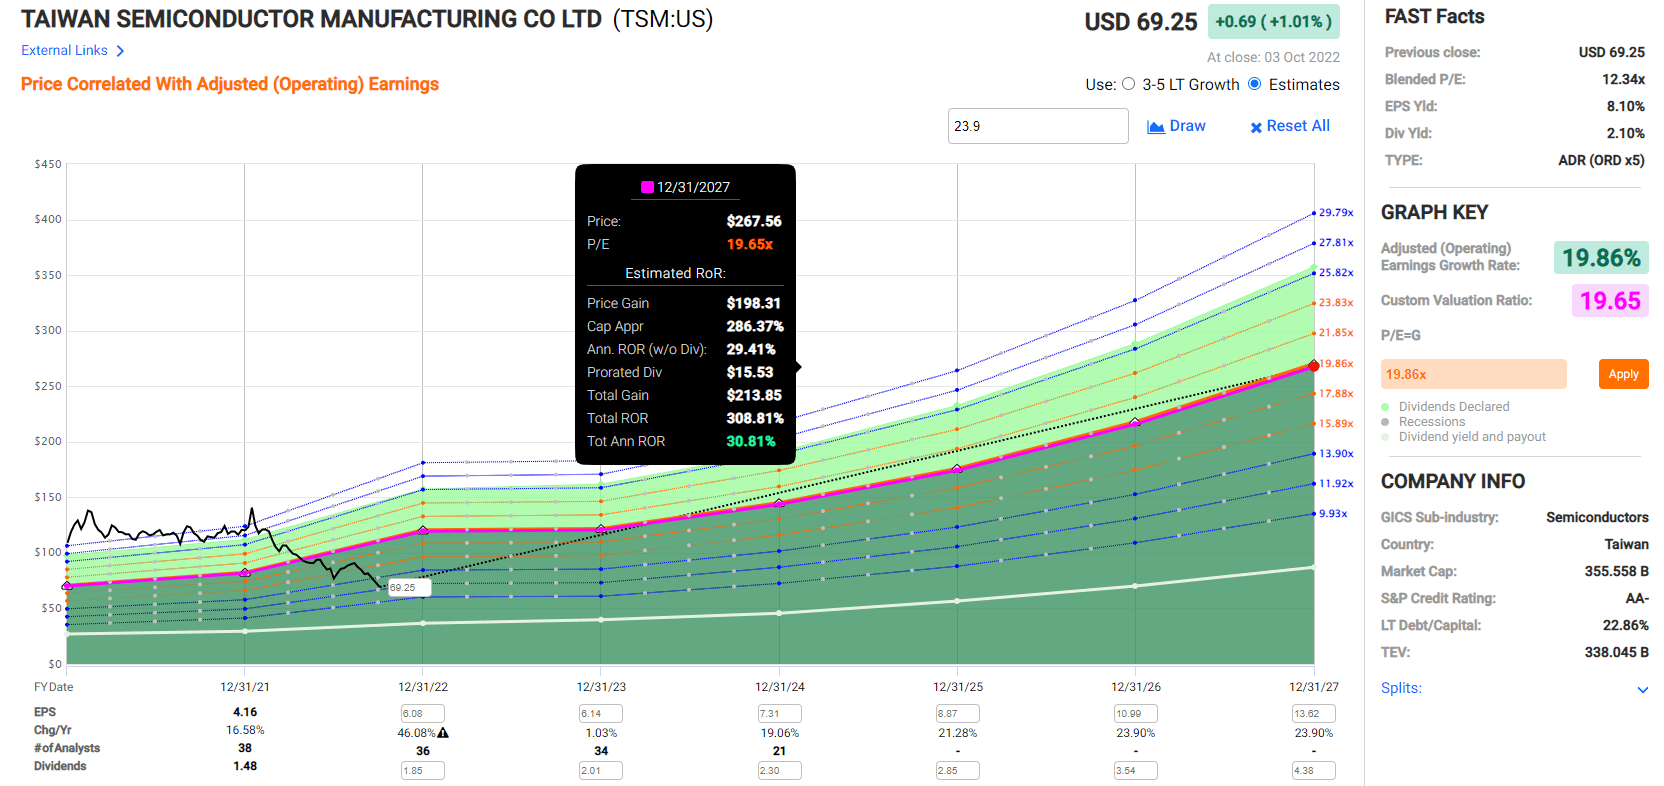
If TSM grows as expected and returns to historical fair value, it could deliver 308% returns by the end of 2027.
- Buffett-like 31% annual return potential
- 6X better than the S&P 500
TSM Corp Investment Decision Tool
DK
(Source: Dividend Kings Automated Investment Decision Tool)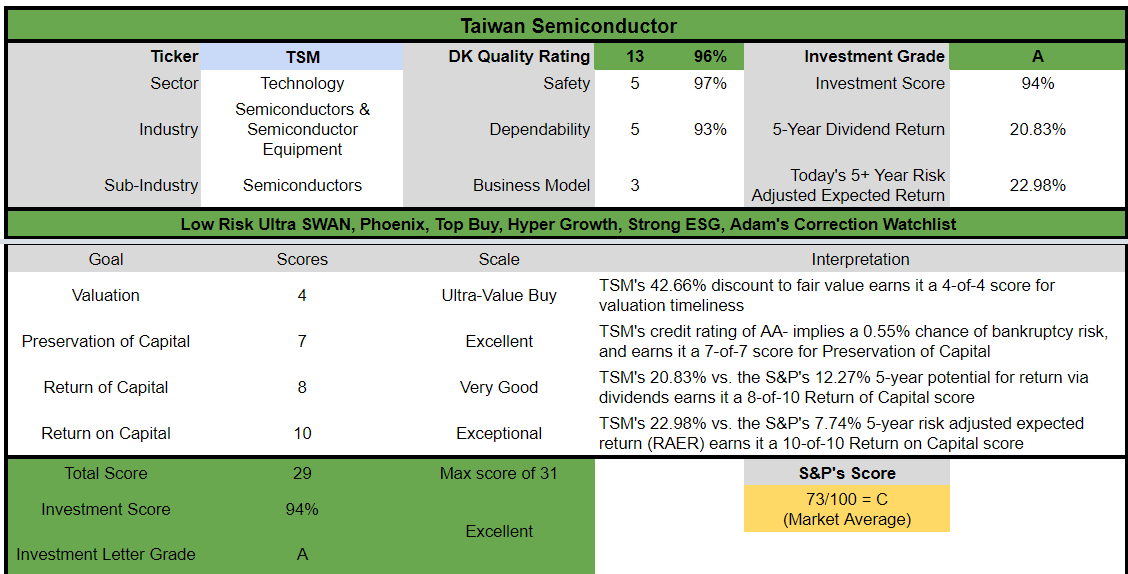
TSM is a potentially excellent hyper-growth dividend Ultra SWAN option for anyone comfortable with its risk profile.
- 43% discount to fair value Vs. 8% S&P = 35% better valuation
- 2.7% safe yield vs. 1.9% S&P (50% higher but growing 2.5X as fast)
- 170% higher annual long-term return potential
- 3X higher risk-adjusted expected returns
- 2X the consensus 5-year income
Reason Two: Incredible Growth Potential For Decades To Come
TSM is priced for -4.2% CAGR growth, but here’s what analysts actually expect.
| Metric | 2021 Growth Consensus | 2022 Growth Consensus | 2023 Growth Consensus | 2024 Growth Consensus |
2025 Growth Consensus |
| Sales | 25% | 30% | 10% | 19% | 21% |
| Dividend | 10% | 25% (Official) | 9% | 14% | NA |
| EPS | 17% | 46% | 1% | 19% | 22% |
| Operating Cash Flow | 41% | 20% | 11% | 21% | 15% |
| Free Cash Flow | -42% | 5% | 107% | 45% | NA |
| EBITDA | 26% | 32% | 10% | 21% | NA |
| EBIT (operating income) | 21% | 51% | 1% | 17% | NA |
(Source: FAST Graphs, FactSet)
(Source: FactSet Research Terminal)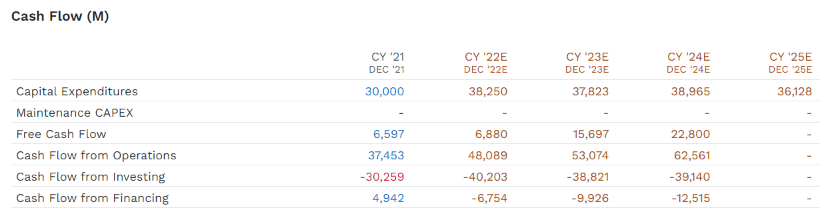
TSM’s mega-growth spending is expected to pay off quickly with free cash flow soaring from $6.6 billion in 2021 to $22.8 billion in 2024, according to FactSet.
- 51% annual free cash flow growth
(Source: FactSet Research Terminal)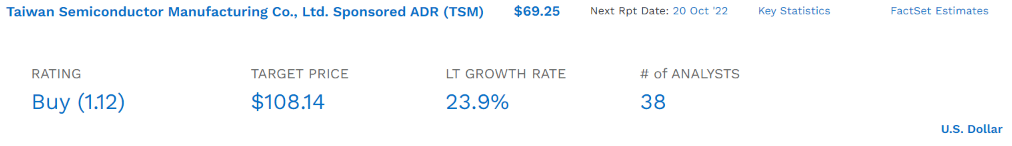
- 12% to 28% growth potential range
- 23.9% median growth consensus from all 38 analysts
- 22.6% to 24.2% CAGR growth consensus range
(Source: FAST Graphs, FactSet)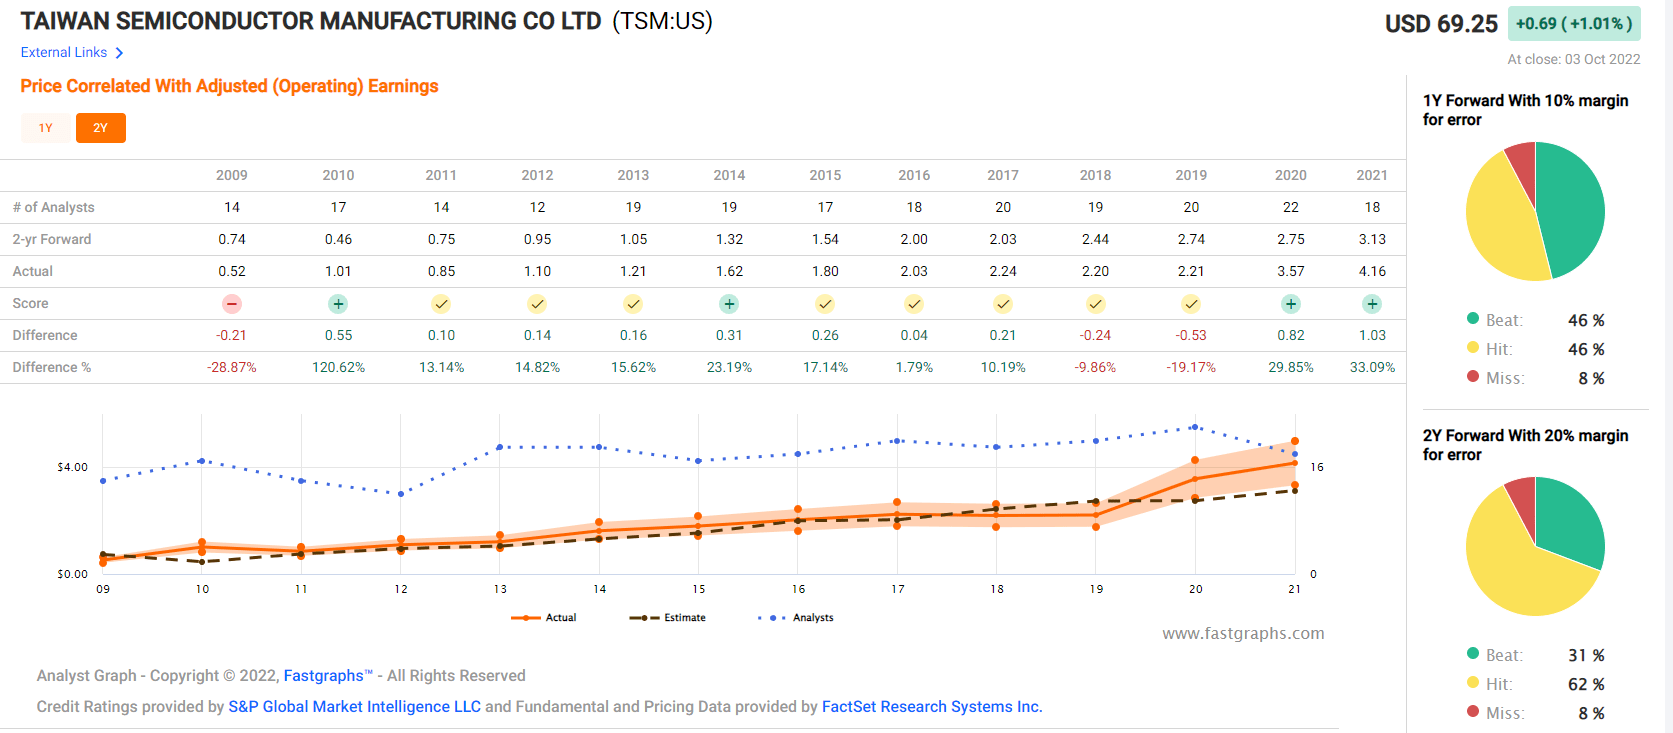
Smoothing for outliers, analyst margins of error are 10% to the downside and 15% to the upside.
- 19% to 28% CAGR margin-of-error adjusted growth consensus range
- 12% to 28%, including the low end of the historical growth rate
(Source: FAST Graphs, FactSet) (Source: FAST Graphs, FactSet) (Source: FAST Graphs, FactSet) (Source: FAST Graphs, FactSet)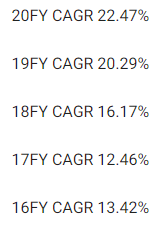
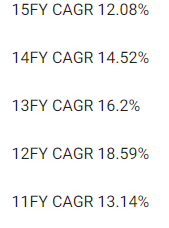
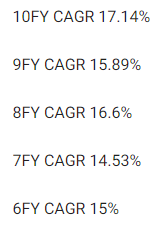
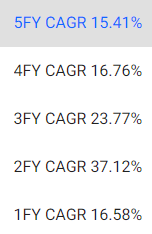
TSM’s historical growth rates over the last 20 years have ranged from 12.5% to 37%.
Analysts expect growth similar to the last 20 years (22.5%), and the company has the growth runway to deliver on that.
| Investment Strategy | Yield | LT Consensus Growth | LT Consensus Total Return Potential | Long-Term Risk-Adjusted Expected Return | Long-Term Inflation And Risk-Adjusted Expected Returns | Years To Double Your Inflation & Risk-Adjusted Wealth |
10-Year Inflation And Risk-Adjusted Expected Return |
| Taiwan Semiconductor | 2.7% | 23.9% | 26.6% | 18.6% | 16.3% | 4.4 | 4.54 |
| Nasdaq | 0.9% | 11.8% | 12.7% | 8.9% | 6.6% | 10.9 | 1.89 |
| Schwab US Dividend Equity ETF | 3.6% | 8.80% | 12.4% | 8.7% | 6.4% | 11.3 | 1.86 |
| Dividend Aristocrats | 2.8% | 8.7% | 11.5% | 8.1% | 5.8% | 12.5 | 1.75 |
| S&P 500 | 1.9% | 8.5% | 10.4% | 7.3% | 5.0% | 14.4 | 1.63 |
(Source: DK Research Terminal, Morningstar, FactSet, YCharts)
TSM is expected to run circles around almost every popular investment strategy on Wall Street.
Inflation-Adjusted Consensus Total Return Potential: $1,000 Initial Investment
| Time Frame (Years) | 8% CAGR Inflation-Adjusted S&P 500 Consensus | 9.2% Inflation-Adjusted Dividend Aristocrats Consensus | 16.2% CAGR Inflation And Risk-Adjusted TSM Consensus | Difference Between Inflation And Risk-Adjusted TSM Consensus And S&P Consensus |
| 5 | $1,470.01 | $1,553.50 | $2,128.56 | $575.05 |
| 10 | $2,160.92 | $2,413.37 | $4,530.75 | $2,117.38 |
| 15 | $3,176.58 | $3,749.18 | $9,643.97 | $5,894.79 |
| 20 | $4,669.60 | $5,824.36 | $20,527.74 | $14,703.38 |
| 25 | $6,864.35 | $9,048.16 | $43,694.46 | $34,646.30 |
| 30 | $10,090.65 | $14,056.34 | $93,006.15 | $78,949.81 |
(Source: DK Research Terminal, FactSet)
Analysts expect TSM to continue delivering historical returns in the future, which potentially means a 93X inflation-adjusted return over 30 years.
| Time Frame (Years) | Ratio Inflation And Risk-Adjusted TSM Consensus/Aristocrat Consensus | Ratio Inflation And Risk-Adjusted TSM Consensus vs. S&P consensus |
| 5 | 1.37 | 1.45 |
| 10 | 1.88 | 2.10 |
| 15 | 2.57 | 3.04 |
| 20 | 3.52 | 4.40 |
| 25 | 4.83 | 6.37 |
| 30 | 6.62 | 9.22 |
(Source: DK Research Terminal, FactSet)
TSM offers the potential to outperform the dividend aristocrats by 7X over 30 years and the S&P by 9X.
Reason Three: A Wonderful Company At An Anti-Bubble Price
(Source: FAST Graphs, FactSet)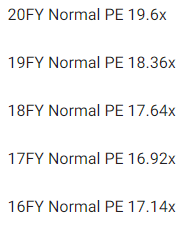
(Source: FAST Graphs, FactSet) (Source: FAST Graphs, FactSet)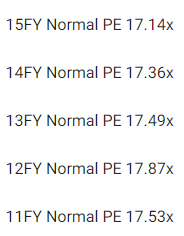
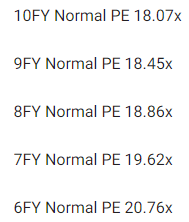
For the last 20 years, billions of investors have, outside of bear markets and bubbles, paid 17X to 21X earnings for TSM.
- 91% probability that TSM is worth between 17 and 21X earnings
| Metric | Historical Fair Value Multiples (all-years) | 2021 | 2022 | 2023 | 2024 |
12-Month Forward Fair Value |
| Earnings | 19.65 | $81.74 | $118.29 | $121.44 | $142.66 | |
| Average | $81.74 | $118.29 | $121.44 | $142.66 | $120.77 | |
| Current Price | $69.25 | |||||
|
Discount To Fair Value |
15.28% | 41.46% | 42.97% | 51.46% | 42.66% | |
|
Upside To Fair Value |
18.04% | 70.82% | 75.36% | 106.01% | 77.09% | |
| 2022 EPS | 2023 EPS | 2022 Weighted EPS | 2023 Weighted EPS | 12-Month Forward EPS | 12-Month Average Fair Value Forward PE |
Current Forward PE |
| $6.02 | $6.18 | $1.27 | $4.87 | $6.15 | 19.7 | 11.3 |
TSM’s historical midrange fair value is 19.7X earnings, and today it trades at 11.3X.
6.4X cash-adjusted earnings, a private equity anti-bubble valuation for possibly the most dominant and highest quality chip maker on earth.
| Rating | Margin Of Safety For Low Risk 13/13 SWAN Quality Companies | 2022 Fair Value Price | 2023 Fair Value Price |
12-Month Forward Fair Value |
| Potentially Reasonable Buy | 0% | $118.29 | $121.44 | $120.77 |
| Potentially Good Buy | 5% | $112.38 | $115.37 | $114.73 |
| Potentially Strong Buy | 15% | $100.55 | $103.22 | $102.66 |
| Potentially Very Strong Buy | 25% | $84.28 | $91.08 | $90.58 |
| Potentially Ultra-Value Buy | 35% | $76.89 | $78.93 | $78.50 |
| Currently | $69.25 | 41.46% | 42.97% | 42.66% |
| Upside To Fair Value (Including Dividends) | 73.51% | 78.05% | 77.09% |
For anyone comfortable with its risk profile, TSM is a potential Ultra Value, anti-bubble, Buffett-style “fat pitch” table pounding buy, in my opinion.
Risk Profile: Why Taiwan Semi Isn’t Right For Everyone
There are no risk-free companies and no company is right for everyone. You have to be comfortable with the fundamental risk profile.
TSM Risk Profile Summary
- economic cyclicality risk (smaller than most chip makers, no 20+% EPS declines in the last decade)
- customer concentration risk (50% of sales from smartphones, mostly Apple and Samsung, 25% of sales from Apple)
- talent retention risk (tightest job market in over 50 years)
- supply chain disruption risk
- currency risk (relatively limited)
- China invasion risk (why TSM is medium-risk despite stellar fundamentals)
- succession risk (CEO is over 65 years old)
The DOD estimates it will be at least 5 years before China can attempt to invade Taiwan.
Taiwan has a 200,000-person army with 2.7 million in reserves. In order to ensure success, China would need to land approximately 9 million troops within 24 hours in Taiwan. It currently has a 2.7 million person army with 400 million in reserves. The largest sea-born invasion in history was 1.5 million on D-day that required nearly 5,000 amphibious landing craft. China would need approximately 25,000 landing craft.
Realistically, the largest threat to TSM from China is a naval blockade, or China bombing its factories from the air or destroying them with missiles.
The only reason TSM isn’t rated “very low risk” as its risk management ratings justify is purely due to the black swan attack risk from China.
How do we quantify, monitor, and track such a complex risk profile? By doing what big institutions do.
Long-Term Risk Analysis: How Large Institutions Measure Total Risk
- see the risk section of this video to get an in-depth view (and link to two reports) of how DK and big institutions measure long-term risk management by companies
TSM Long-Term Risk Management Consensus
| Rating Agency | Industry Percentile |
Rating Agency Classification |
| MSCI 37 Metric Model | 100.0% |
AAA Industry Leader |
| Morningstar/Sustainalytics 20 Metric Model | 98.7% |
13.1/100 Low Risk |
| Reuters’/Refinitiv 500+ Metric Model | 94.3% | Excellent |
| S&P 1,000+ Metric Model | 86.0% | Very Good |
| Moody’s | 80.0% | Good |
| FactSet | 50.0% |
Average, Positive Trend |
| Morningstar Global Percentile (All 15,000 Rated Companies) | 94.5% | Excellent |
| Consensus | 86.2% |
Very Low Risk, Very Good Risk Management, Stable Trend |
(Sources: Morningstar, FactSet, Reuters, S&P, Moody’s)
TSM’s Long-Term Risk Management Is The 17th Best In The Master List (97 Percentile)
| Classification | Average Consensus LT Risk-Management Industry Percentile |
Risk-Management Rating |
| S&P Global (SPGI) #1 Risk Management In The Master List | 94 | Exceptional |
| Taiwan Semi | 86 |
Very Good |
| Strong ESG Stocks | 73 |
Good |
| Foreign Dividend Stocks | 75 | Good |
| Ultra SWANs | 71 | Good |
| Low Volatility Stocks | 68 | Above-Average |
| Dividend Aristocrats | 67 | Above-Average |
| Dividend Kings | 63 | Above-Average |
| Master List average | 62 | Above-Average |
| Hyper-Growth stocks | 61 | Above-Average |
| Monthly Dividend Stocks | 60 | Above-Average |
| Dividend Champions | 57 | Average |
(Source: DK Research Terminal)
TSM’s risk-management consensus is in the top 3% of the world’s highest quality companies and similar to that of such other blue-chips as
- Allianz SE (OTCPK:ALIZY) – Super SWAN
- ASML Holding (ASML) – Ultra SWAN
- Novartis (NVS)- Ultra SWAN global aristocrat
- Cisco (CSCO)- Ultra SWAN
- Colgate-Palmolive (CL): Ultra SWAN dividend king
The bottom line is that all companies have risks, and TSM is very good at managing theirs.
How We Monitor TSM’s Risk Profile
- 38 analysts
- 2 credit rating agencies
- 7 total risk rating agencies
- 35 experts who collectively know this business better than anyone other than management
“When the facts change, I change my mind. What do you do, sir?” – John Maynard Keynes
There are no sacred cows at iREIT or Dividend Kings. Wherever the fundamentals lead, we always follow. That’s the essence of disciplined financial science, the math behind retiring rich and staying rich in retirement.
Bottom Line: Taiwan Semi Is A Buffett-Style Anti-Bubble, Table-Pounding Buy
Let me be clear: I’m NOT calling the bottom in TSM (I’m not a market-timer).
Sleep Well At Night doesn’t mean “can’t fall hard in a bear market.”
It doesn’t mean “risk-free”; no such stock exists.
Fundamentals are all that determine safety and quality, and my recommendations.
- over 30+ years, 97% of stock returns are a function of pure fundamentals, not luck
- in the short-term; luck is 33X as powerful as fundamentals
- in the long-term, fundamentals are 33X as powerful as luck
While I can’t predict the market in the short term, here’s what I can tell you about TSM.
- One of the highest quality, safest, and most dependable hyper-growth dividend blue-chips on earth.
- 2.7% very safe yield, growing at about over 20% CAGR over time
- 16.2% CAGR long-term total risk and adjusted return consensus, better than the Nasdaq, aristocrats, S&P 500, SCHD, and REITs.
- 43% historically undervalued, a potentially Ultra Value buy
- 6.4X cash-adjusted earnings (anti-bubble blue-chip)
- 308% consensus return potential over the next five years, 31% CAGR, about 6X more than the S&P 500, Buffett-like return potential
- 3X better risk-adjusted expected returns of the S&P 500 over the next five years.
- 2X better income potential over the next five years
When you can buy quality this wonderful, and a moat this wide, for less than 6.5X earnings, you should really consider doing so.
When you can buy a moat this wide, with management this skilled, and growth of 24% for a PEG of 0.27, that’s a no-brainer.
When you buy a deal this good, then no matter what the market does in the next six to 12 months, is irrelevant. Because in 5+ years, you’ll not just feel glad you bought TSM today, you’ll likely feel like a stock market genius.
And in 10+ years? TSM at today’s valuations is the stuff rich retirement dreams are made of.
Be the first to comment