

asbe/iStock via Getty Images
Introduction and Background
I am so thankful to have found dividend growth investing. It is a strategy that works well for me regardless of what is going on. Are stocks overvalued, are we headed for a recession, is inflation high – all of these questions are less important if instead of focusing on pure capital appreciation, we can instead focus on a growing, sustainable source of passive income. I don’t like to buy overvalued stocks, but I can usually find high-quality, dividend growth companies selling at fair value, and take immediate pleasure in seeing the impact to my future income that purchase brings. When the market drops, and I see the paper value of my portfolio decline, instead of being worried about the loss of value, I get excited that I might be able to purchase more income on sale. Inflation is always scary, but by investing in the highest-quality dividend growth companies, I am confident that my dividends can significantly blunt the impact of inflation on my future purchasing power.
With the current fears in mind, I want to take a look at companies that might be trading at, or below fair value, but also have the ability to offset inflation through future growth. I don’t want to completely sacrifice current income, so we’ll be looking at those companies promising future growth, but with current yields that are reasonable. I regularly maintain a watchlist of around 100 of the highest-quality dividend growth companies and calculate my own valuations for each company. Using some simple initial filters, let’s look at the companies from my watchlist that have a future potential growth over 7% and a 5-year Return on Invested Capital of over 7%. Why 7%? There are a lot of estimates of inflation, both current and projected, so I arbitrarily picked 7% as a nice round number. Additionally, I want to make sure that, in addition to growth, there is some headroom for bumps along the way to protect the dividend, so I also filtered for those companies with earnings-based payout ratios below 60%.
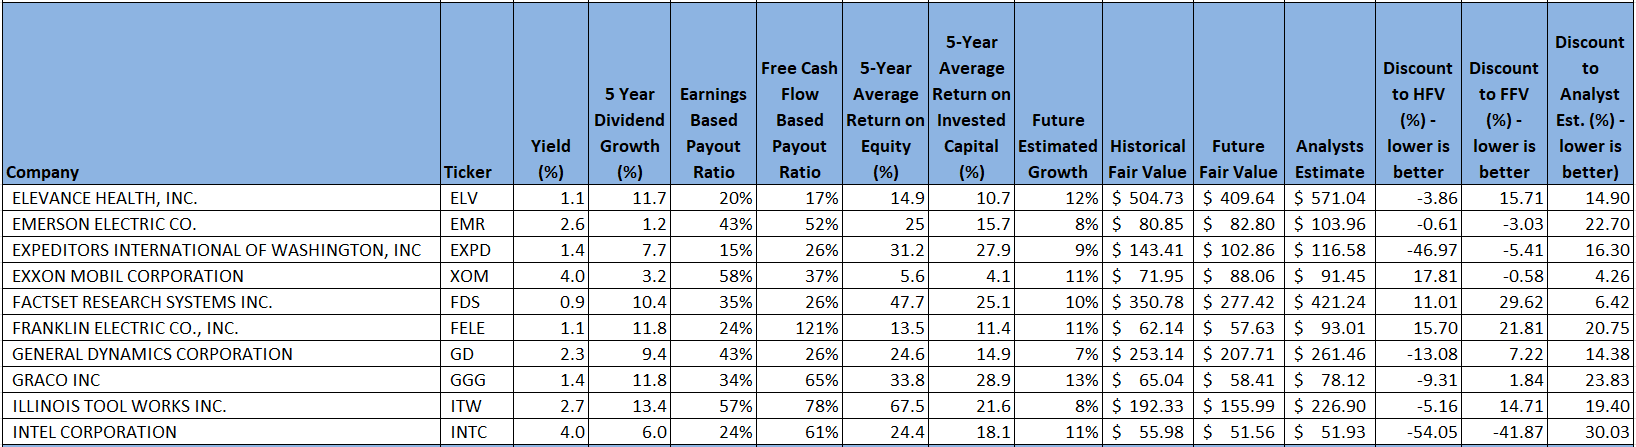
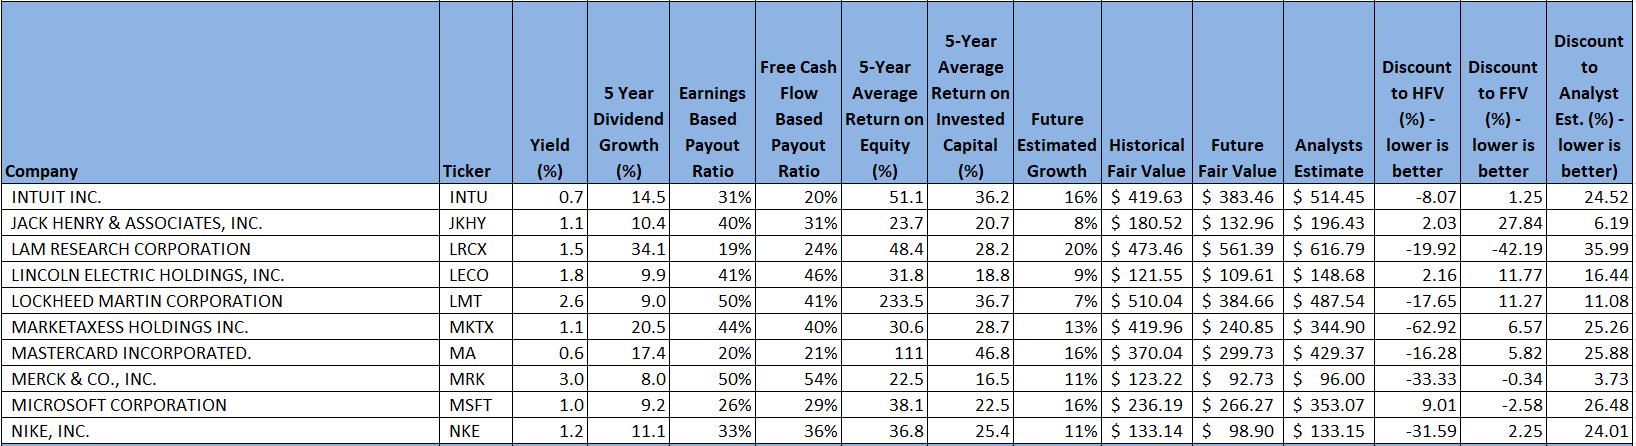
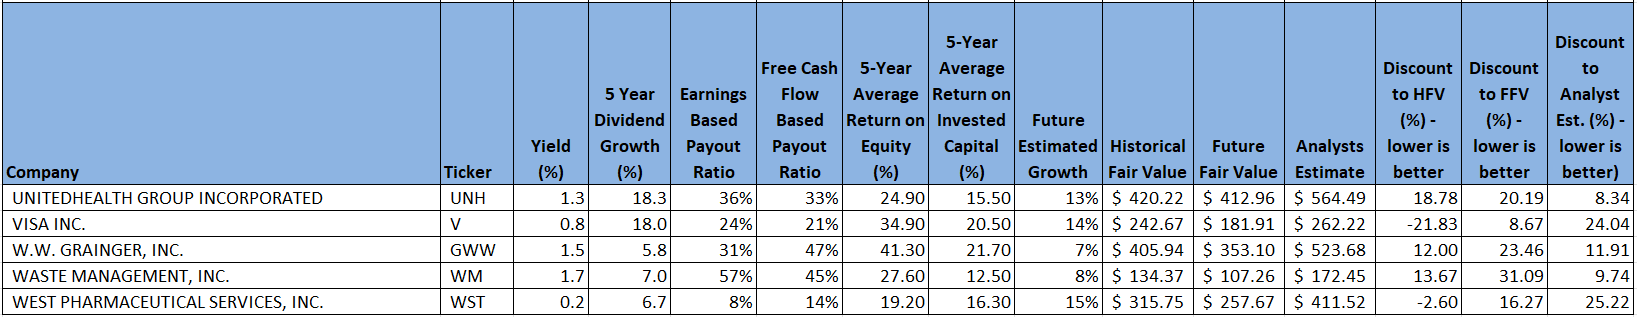
Using this first pass criteria, we will be further exploring the following list of companies:
Finbox, Seeking Alpha, Author’s Analysis Finbox, Seeking Alpha, Author’s Analysis Finbox, Seeking Alpha, Author’s Analysis Finbox, Seeking Alpha, Author’s Analysis Finbox, Seeking Alpha, Author’s Analysis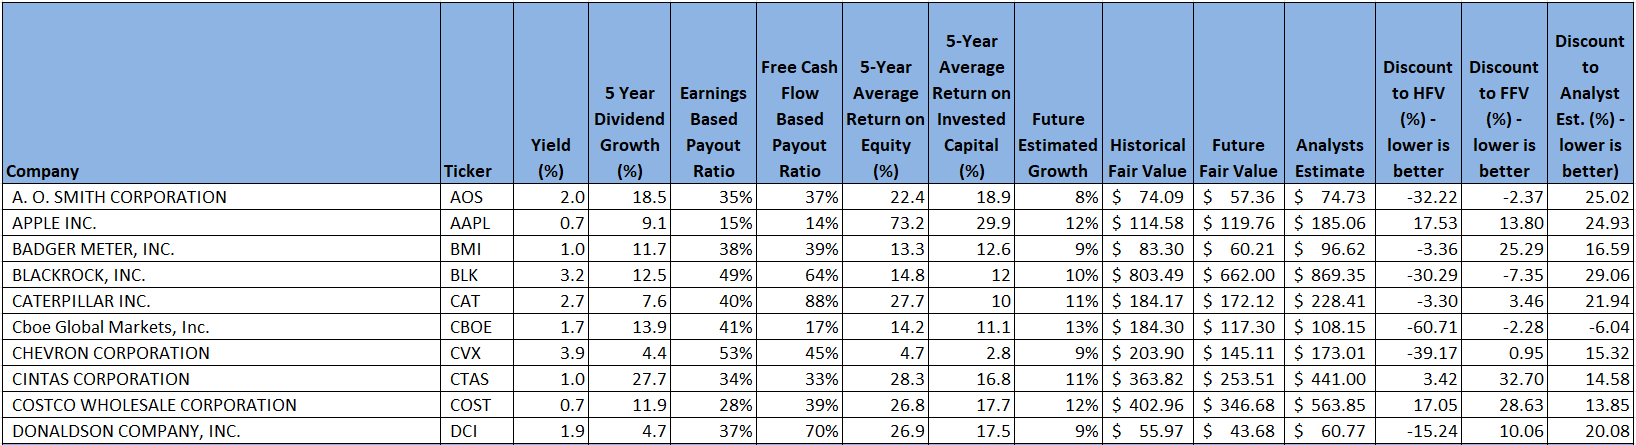

Fair Value Estimation
As I’ve described in previous articles, I like to calculate a fair value in two ways, using a Historical fair value estimation, and a future-looking fair value estimation. The Historical Fair Value is simply based on historical valuations. I compare 5-year average: dividend yield, P/E ratio, Schiller P/E ratio, EV/EBITDA, and P/FCF to the current values and calculate a composite value based on the historical averages. This gives an estimate of the value assuming the stock continues to perform as it has historically. I also want to understand how the stock is likely to perform in the future so utilize the Finbox fair value calculated from their modeling, a Cap10 valuation model, FCF Payback Time valuation model, and 10-year earnings rate of return valuation model to determine a composite Future Fair Value estimate.
Additionally, I gather a composite target price from multiple analysts, including Reuters, Morningstar, Value Line, Finbox.com, Morgan Stanley, and Argus. I like to see how the current price compares to analyst estimates as another data point, and as somewhat of a sanity check to my own estimates.
Plotting three variables on one plot is tricky but using a bubble plot allows us to visualize three variables by plotting the Historical fair value versus the Future Fair Value on a standard x-y chart, and then use bubbles to represent the size of discount relative to analyst estimates.
Author calculation of Historical and Future Fair Value, analyst estimates
This chart is insightful once you understand how to interpret it. What we are looking for are stocks that are trading at a discount to both the Historical Fair Value and the Future Fair Value. So, those stocks that are farther to the left, and farther to the bottom, are potentially the stocks trading at the largest discount to fair value. This would be the bottom left quadrant of the graph. Additionally, those stocks with the biggest bubbles are the stocks that are trading at the largest discount to analyst estimates, so in theory, stocks in the lower left quadrant that also have large bubbles, should be very decent candidates for investment.
Based on the chart, Intel Corporation (INTC), Lam Research Corporation (LRCX), QUALCOMM Incorporated (QCOM), Expeditors International of Washington Incorporated (EXPD), United Parcel Service Incorporated (UPS), Merck & Co., Incorporated (MRK), A. O. Smith Corporation (AOS), BlackRock, Incorporated (BLK), and Emerson Electric Company (EMR) all appear to be trading at discounts to both Historical and Future Fair Value estimates and may be good candidates for further investigation. There are many other companies that are also trading close to fair value.
With the objective we’ve set to look for companies with high future growth potential, good dividend growth, and reasonable current yield, to help us offset potential inflation, let’s look at another view that combines these factors. The projected growth is a composite growth estimate based on historical and future growth metrics including: 5-year average EBITDA growth, EBITDA 5-year growth forecast, 5-year average dividend growth, 5-year change in shares outstanding, Analyst long-term earnings growth forecasts, Forward Rate of Return forecast, and Net Income to Shareholder growth rate. I realize that this is quite the assortment of inputs, but all of them are indicators of future dividend growth and sustainability.
Finbox, Author’s Analysis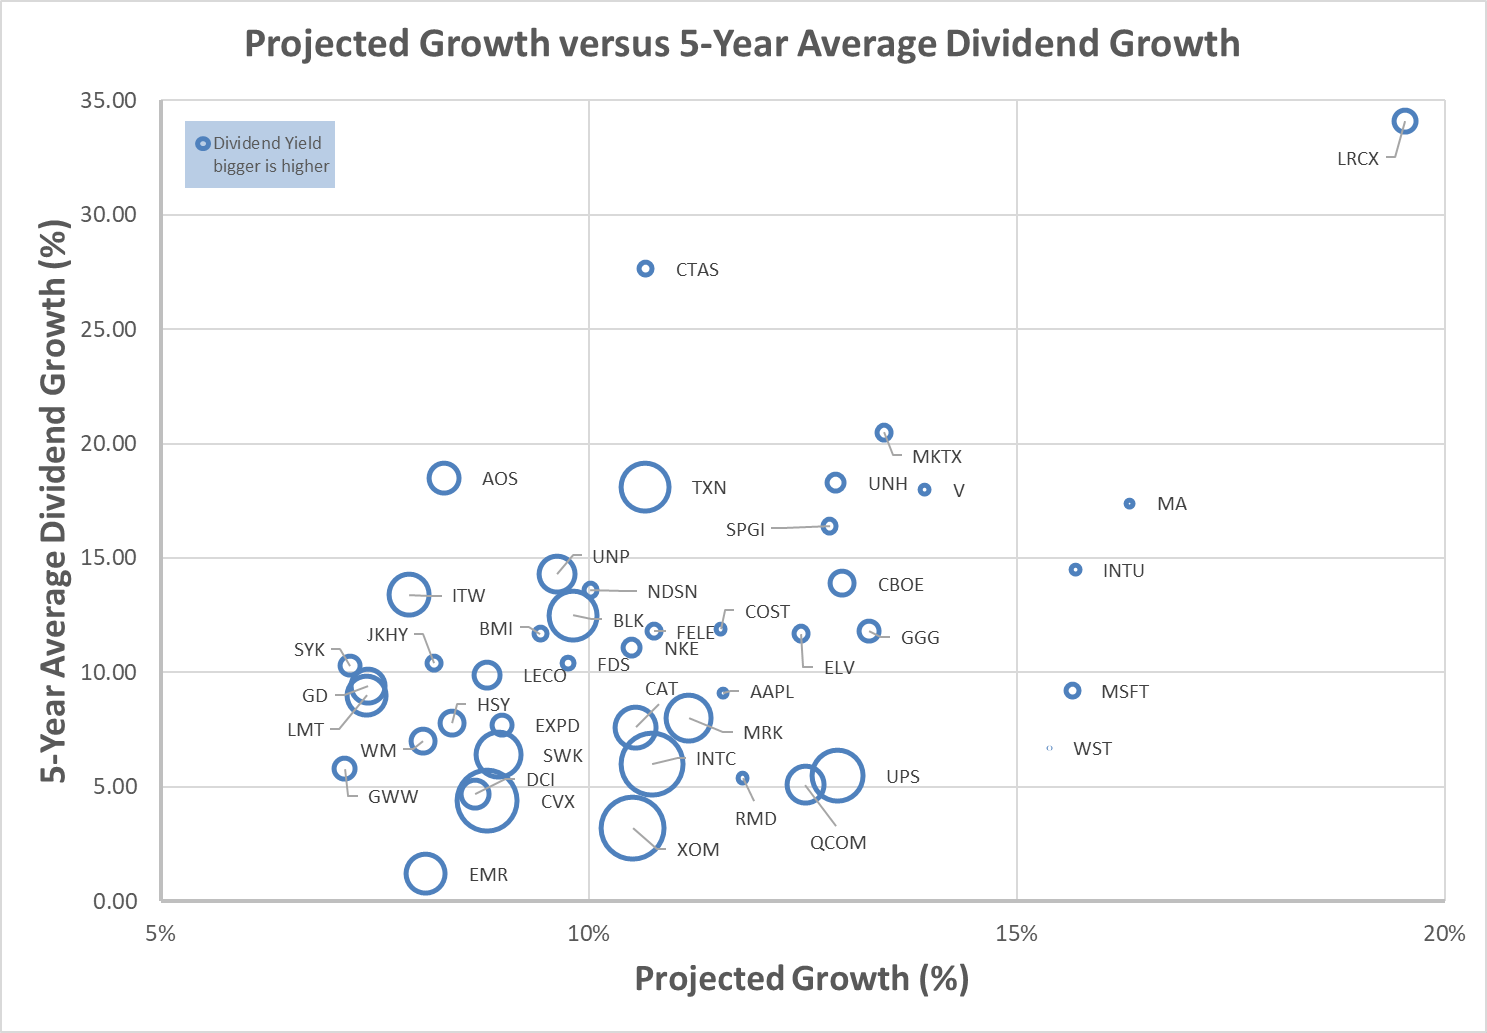
To keep you on your toes, with this chart, we now want to look at the upper-right quadrant. We are looking for those companies that have the desirable combination of high dividend growth and high projected growth, so those farthest up and to the right. Additionally, the size of the bubble shows the relative current yield, with the larger bubbles belonging to companies with higher current yields. It isn’t a real surprise that many companies with the highest growth also have the lowest current yields, and lower growth companies are showing higher current yields. Companies that don’t fit this trend could potentially be overvalued (too small of a yield for the projected growth), companies that don’t really focus on their dividend, or companies that are currently undervalued (high growth coupled with high yield). It’s those that are ideal candidates to offset future inflationary pressure.
So, with both of these charts in mind, let’s identify 3 of the most promising candidates for deeper investigation. First, Lam Research Corporation really stands out on both charts – appearing to be undervalued from a historical, future, and analyst estimate basis, while also showing excellent growth metrics. The downside is that the current yield is on the low side. Second, BlackRock, Incorporated also appears to be undervalued and has strong growth with excellent current yield. Finally, Texas Instruments Incorporated looks interesting, and though it appears to be trading slightly above Future Fair value, it appears discounted based on historical and analyst valuations. Its growth and current yield are also attractive. Let’s look at each of these in more depth to see if they might be good candidates to help us beat inflation going forward.
Lam Research Analysis
I am a big fan of LRCX and still believe it is a strong buy. I have continued to add to my position since my first article and purchase. Please read my previous deep-dive article here for more details. Currently, Morningstar has LRCX at 5 stars for valuation and considers it to have a Wide moat with Exemplary capital allocation. It has an A- credit rating.
Let’s look at key growth indicators to see if we believe that LRCX can continue to pay a sustainable, growing dividend that is likely to overcome inflation.
Extrapolation of the past is always dangerous, but let’s start with two – past shareholder return and past analyst growth estimates.
Seeking Alpha
Over the past 5 years, the semiconductor equipment manufacturers have performed very well. LRCX has been on the upper end of performance relative to its competitors and given that its valuation looks very fair right now, there is some indication that it could continue to outperform, especially the market.
Finbox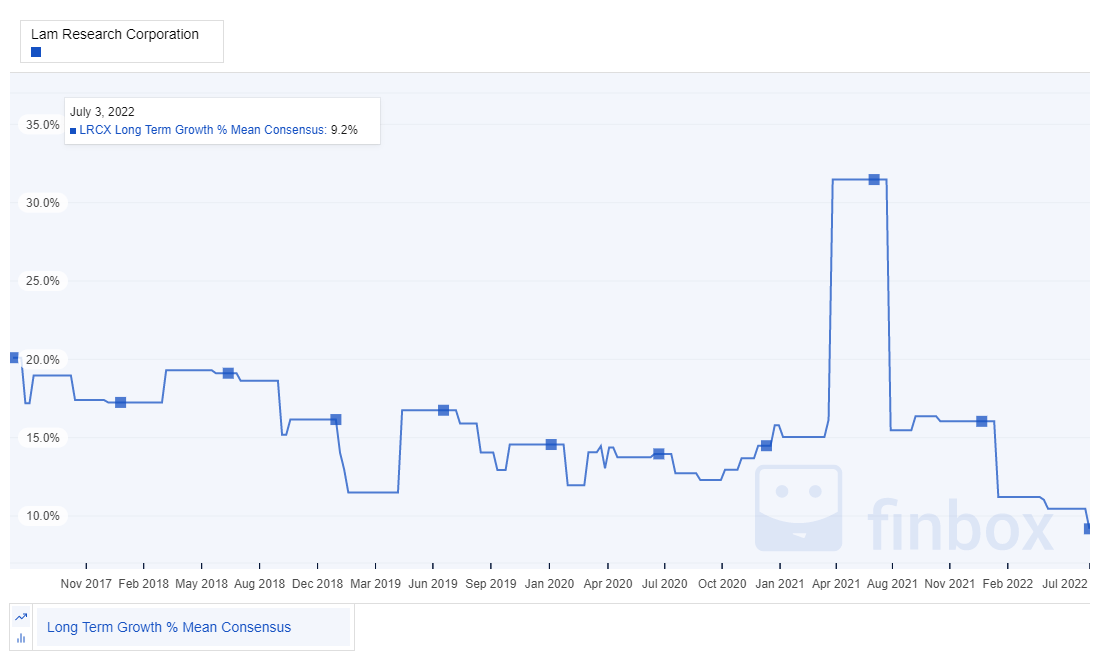
Keeping in mind that my composite growth estimate is around 20%, analysts in the past have consistently predicted strong growth between 10-30%. Right now, anticipating a short-term slowdown in semiconductor manufacturing, largely driven by supply chain issues, but also due to some potential industry slowdown, the growth estimates have dropped to around 10%. This is still above our 7% inflation target, suggesting dividend growth above inflation could be sustainable.
Looking to future growth estimates, LRCX also looks promising.
Finbox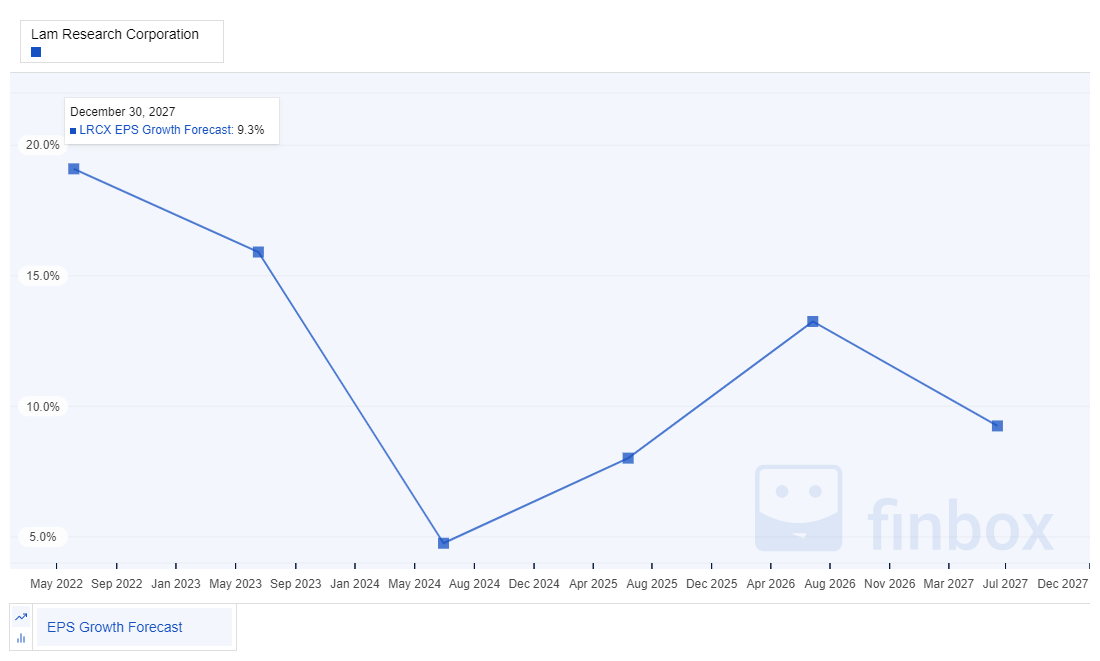
Clearly, analysts are projecting a significant slowdown in the 2024 timeframe, but otherwise, on average, earnings per share are expected to continue to grow healthily for the next several years, again above our 7% hurdle for this investigation.
Now, what about dividend growth? Obviously, growing earnings allow for more dividends to be paid, which is good, but what do analysts expect?
Finbox
Analysts expect that LRCX will continue to grow dividends at a healthy level for the next several years. Maybe not at the same rate as the past 5 years, but at a level above our inflation hurdle.
Finbox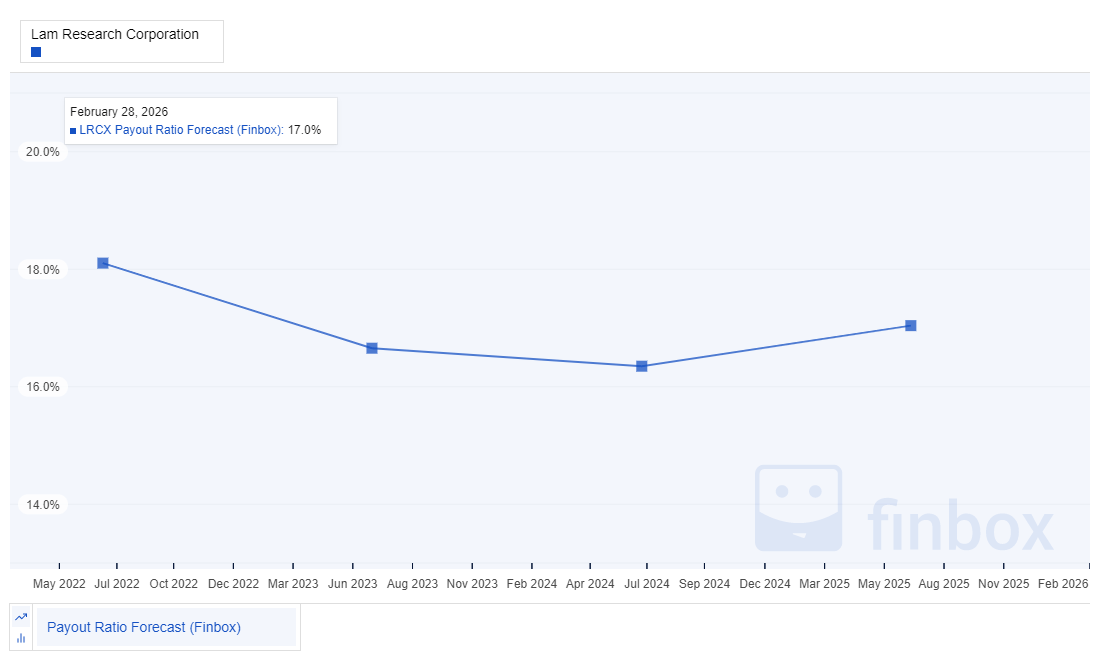
This increasing dividend will also not come at the expense of the payout ratio. LRCX has very low earnings and cash flow-based payout ratios, which it is projected to sustain. This is really impressive. The reason that the payout ratios can stay at low levels is obviously due to the increasing earnings per share that we examined previously, supported by projected increases in revenue. This future growth appears very promising for dividend growth security into the future.
One final check on LRCX I like to look at is the current short interest. This can sometimes provide an indication of future trouble, or things on the horizon that are not widely understood yet. With only a 2% short interest, again, LRCX does not have any red flags from a short interest perspective.
Seeking Alpha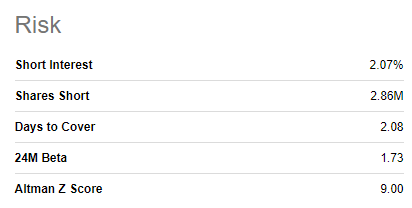
BlackRock Analysis
I am also a big fan of BLK and have held it for a long time in my portfolio. Currently, Morningstar has BLK at 4 stars for valuation and considers it to have a Wide moat with Exemplary capital allocation. It has an AA- credit rating.
Let’s again look at key growth indicators to see if we believe that BLK can continue to pay a sustainable, growing dividend that is likely to overcome inflation.
First, how has BLK performed over the past 5 years?
Seeking Alpha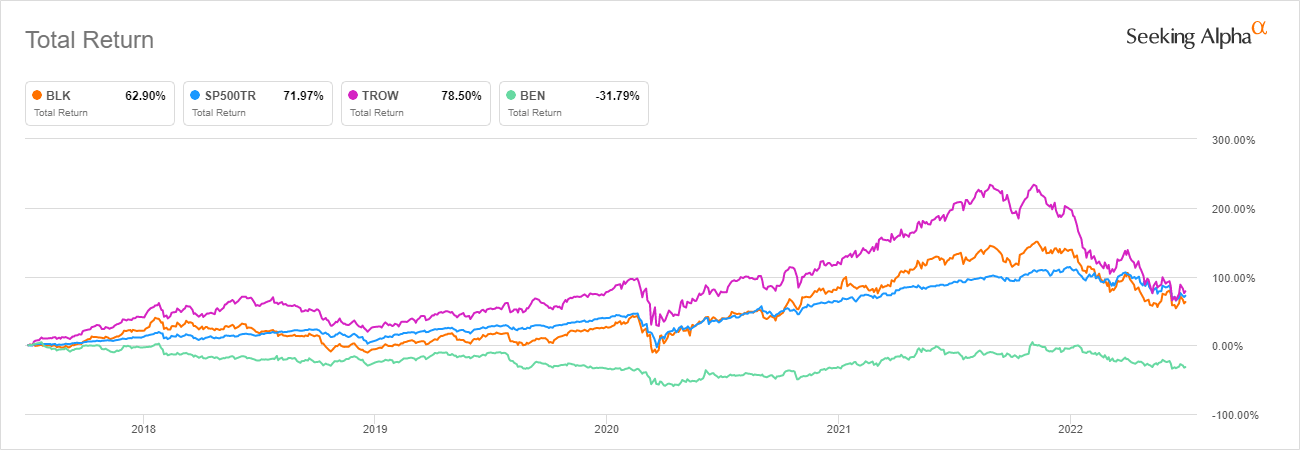
Over the past 5 years, the financial services, asset management sector has performed in line with the market. BLK has also performed well relative to its competitors. Given that its valuation looks very fair right now, there is some indication that it could continue to perform well, at least in line with the market. This can work well with dividend growth if the dividend growth exceeds the growth in dividends that a broad market ETF would provide.
Looking at past projections for growth, BLK has pretty consistently been in the low-double digits. Of recent, estimates have come down quite a bit to the mid-single digit range.
Finbox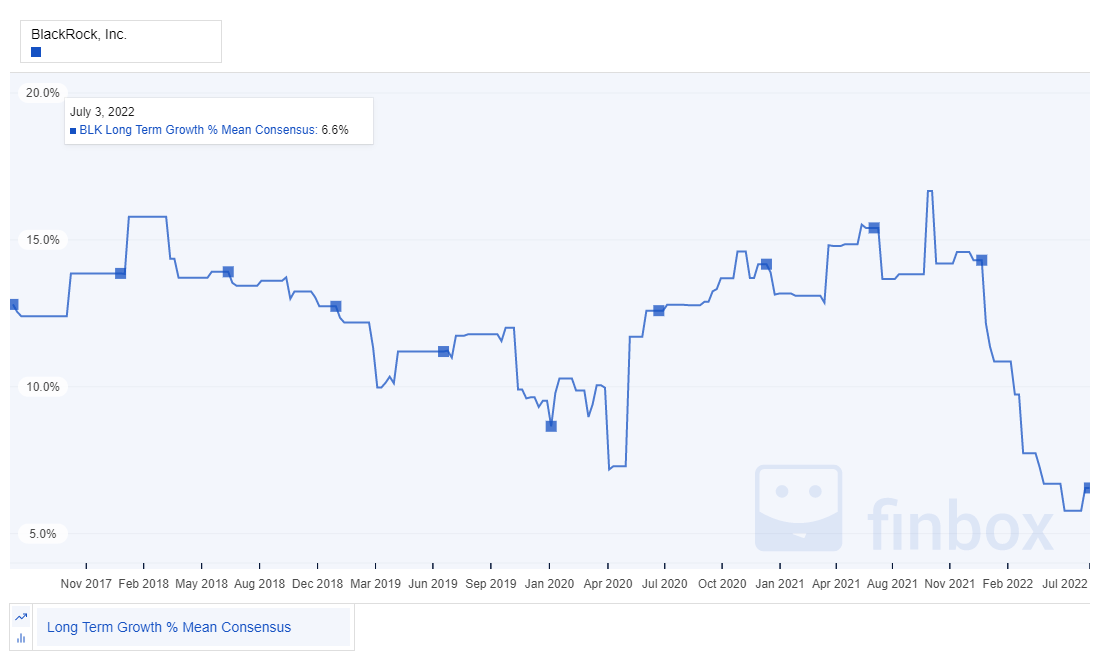
My composite growth estimate for BLK is around 10%. The average future EPS growth estimate from analysts is closer to 7%. This suggests BLK might be able to beat inflation with its future dividend growth but doesn’t provide a lot of margin for us.
Finbox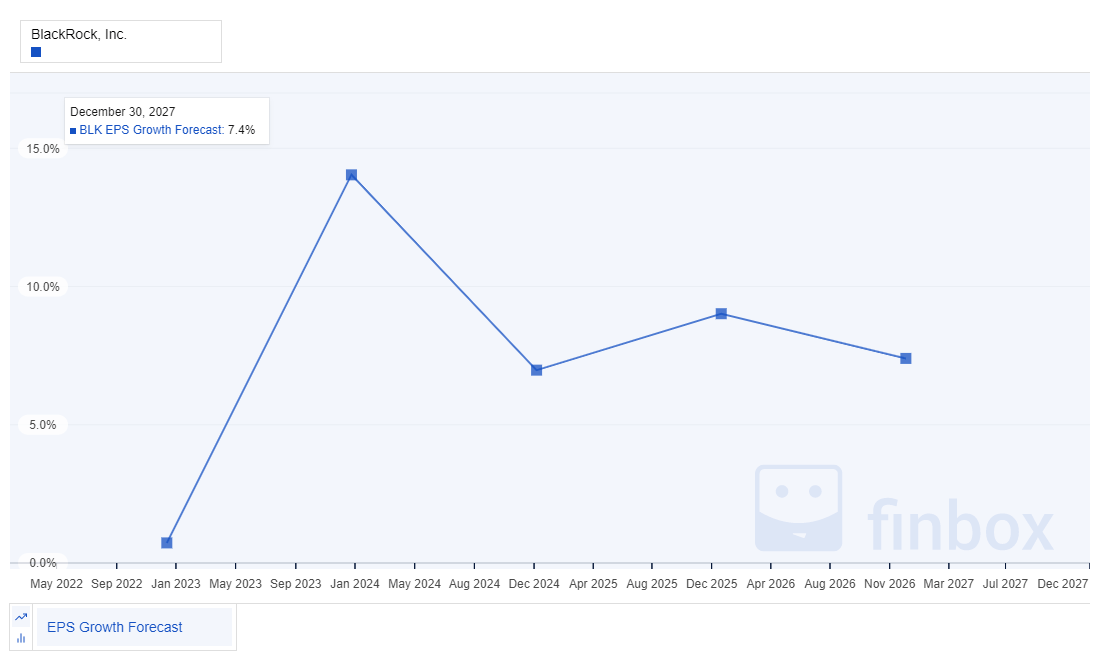
BLK is being penalized right now for low near-term growth expectations. A key question from a valuation perspective, as well as, more importantly for this article, future dividend growth potential, is will BLK return to the comfortable low-double digit growth of the past.
Now, what about dividend growth? On a positive note, analysts do continue to project healthy dividend growth into the future. It may not sustainably match the low-double digit growth of the past few years, but there is good potential to overcome our inflation hurdle.
Finbox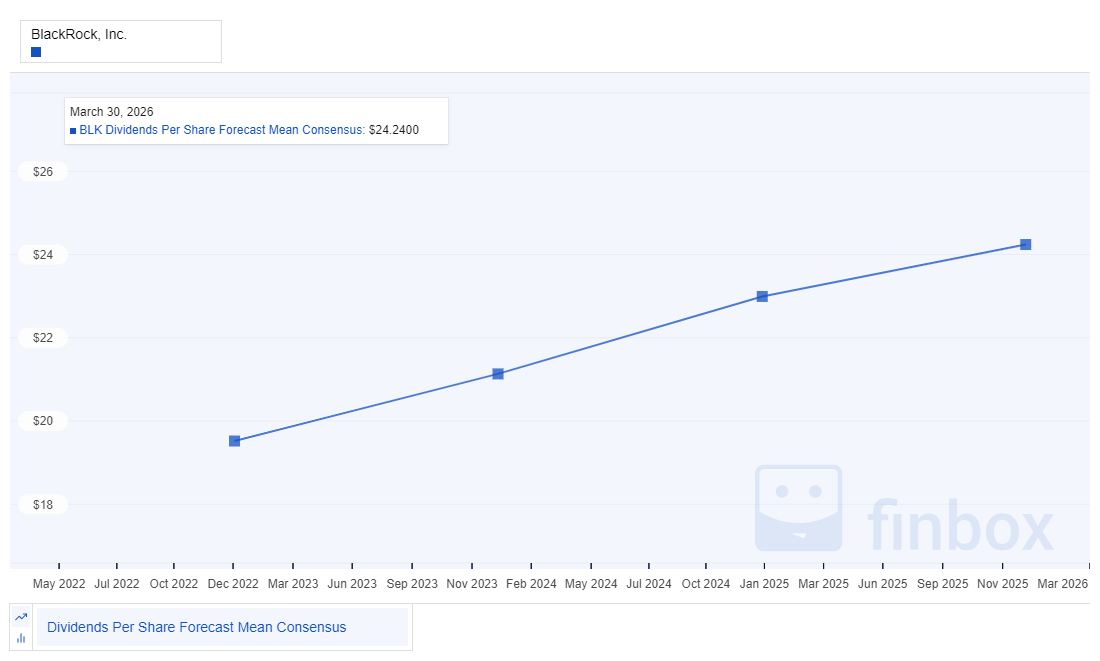
It is also positive to see that this projected growth is not anticipated to adversely impact payout ratios, suggesting a level of sustainability to the growth, with margin to absorb bumps along the way.
Finbox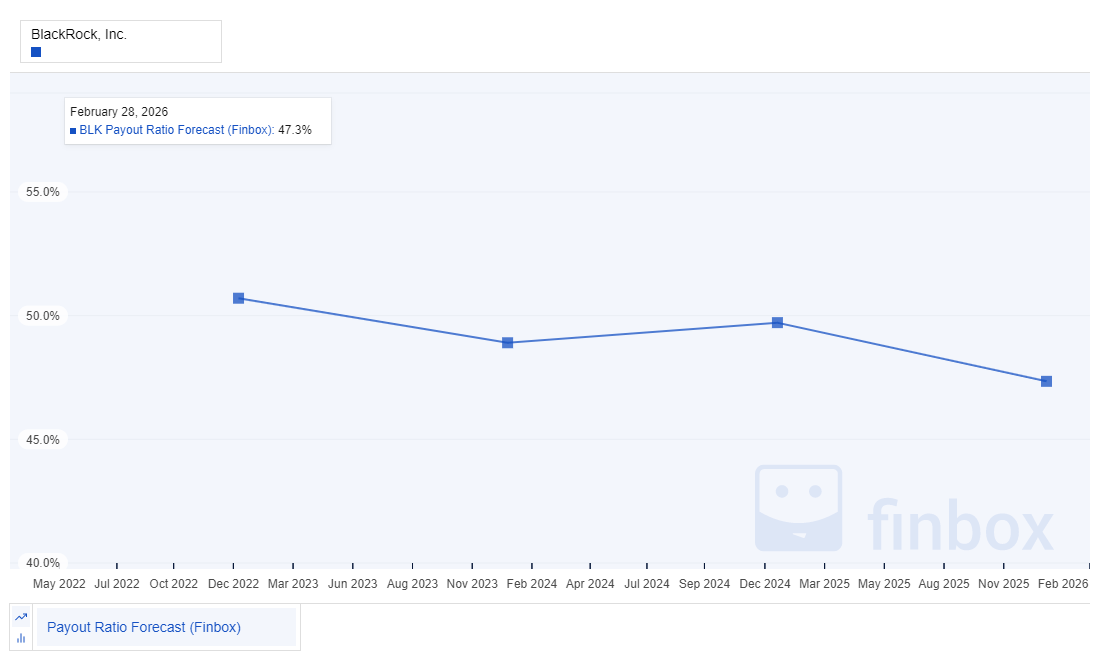
BLK has earnings and cash flow-based payout ratios on the higher side of what I like to see for strong growth, however, they are not out of line for its industry, and appear sustainable.
With a short interest of only 1.5%, BLK does not look to be holding any known surprises, and based on the valuation and dividend sustainability, looks like a good candidate for further investment while also having inflation-beating potential.
Seeking Alpha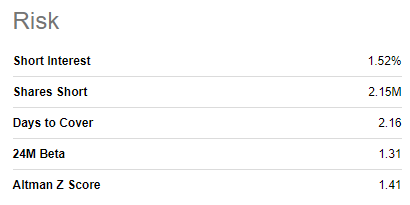
Texas Instruments Analysis
I have held TXN for a while in my portfolio and will gladly continue to add to my position. Currently, Morningstar has TXN at 3 stars for valuation, which suggests fair value (aligned reasonably well with the valuation analysis in this article). Morningstar also gives TXN a Wide moat with Exemplary capital allocation. It has an A+ credit rating.
First, how has TXN performed over the past 5 years?
Seeking Alpha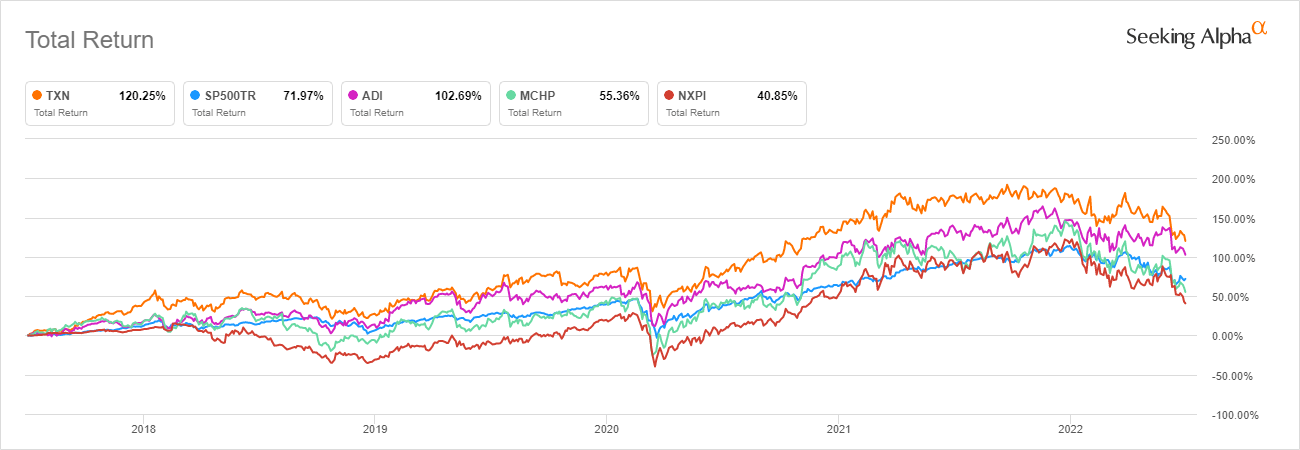
Over the past 5 years, semiconductors have generally outperformed the market. TXN has been a top performer in the sector. Given that its valuation looks very fair right now, there is some indication that it could continue to perform well.
Looking at past projections for growth, TXN has had remarkably stable and consistent growth projections. It’s worth noting that all of the projections have been above the 7% hurdle we established as a target to offset inflation.
Finbox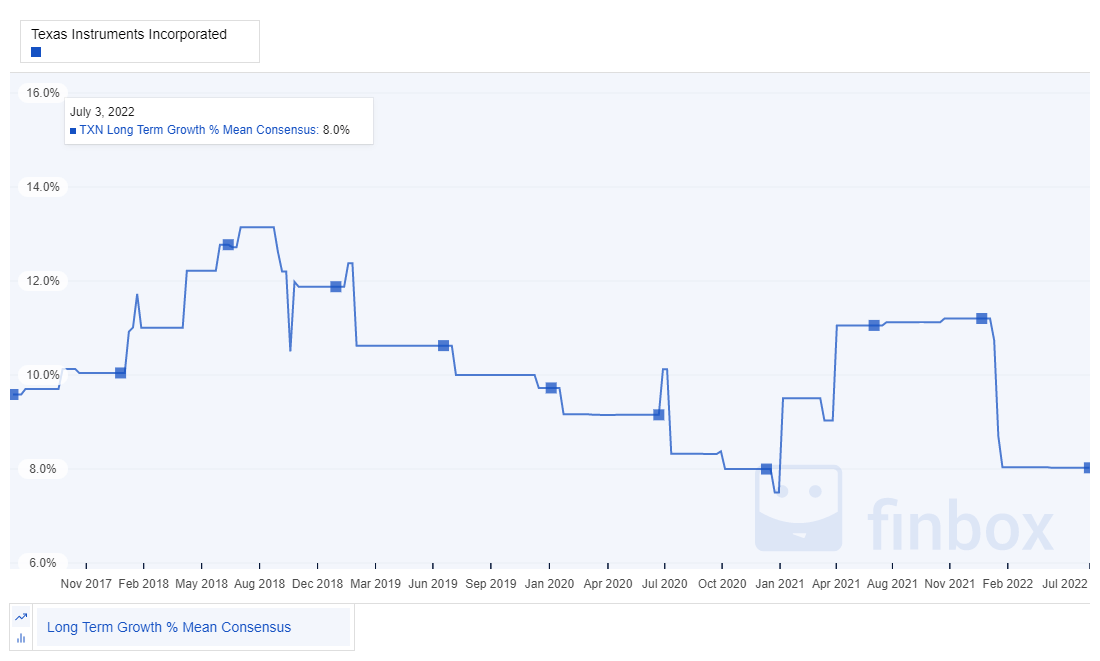
My composite growth estimate for TXN is around 11%, which doesn’t look too bad based on historical projections. The average future EPS growth estimate from analysts is mid-single digit. As we saw with LRCX, analysts are projecting a pretty significant pullback in 2024, with a return to growth after that. Like with BLK, the growth projections are close to our 7% hurdle, not providing a lot of margin for comfort.
Finbox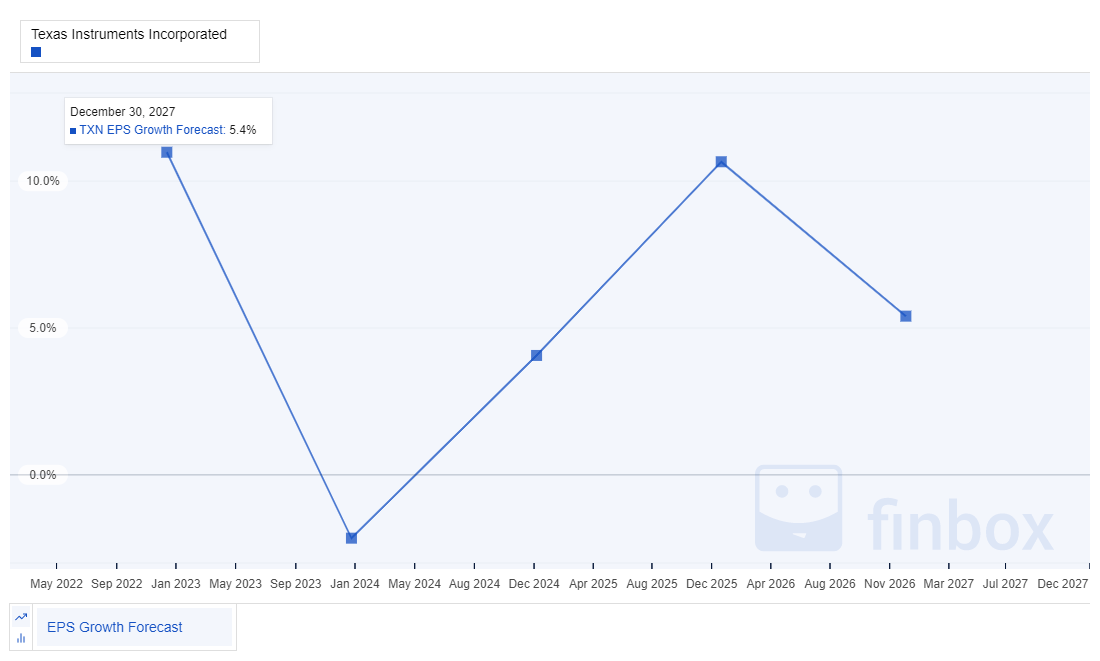
Now, what about dividend growth? Again, analysts expect healthy dividend growth in the future, but with the slowing growth trends in the business, it isn’t really likely that the 18% 5-year average is maintained. It looks reasonable that an upper-single digit level of growth is feasible.
Finbox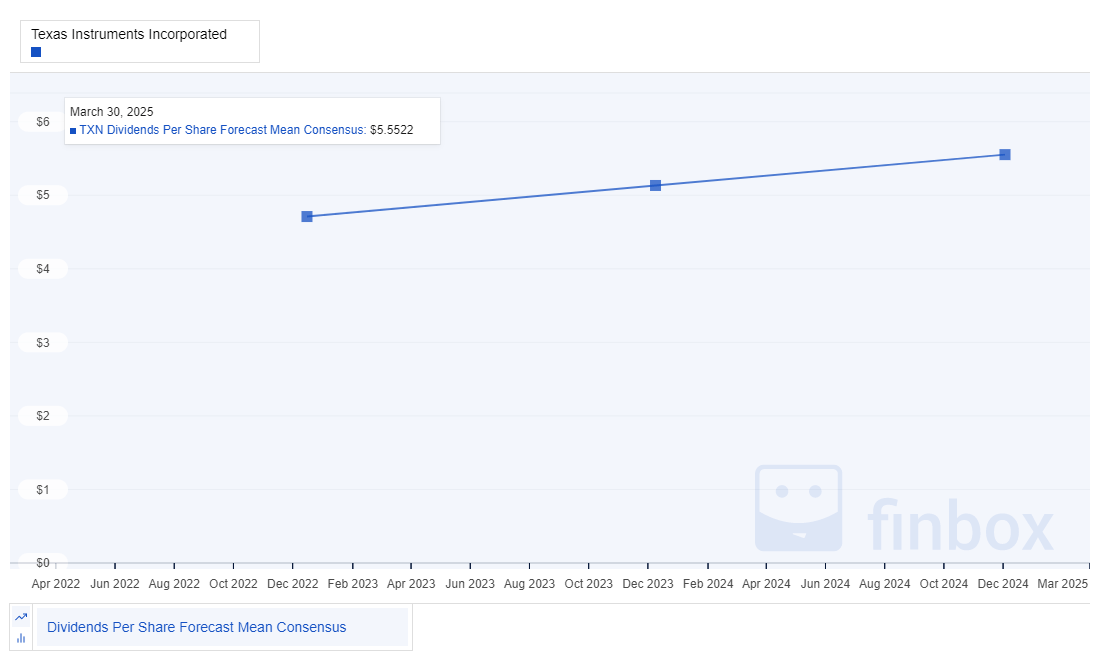
Payout ratios are expected to rise shorter term to sustain the dividend growth, however, longer-term, analysts project they will come back down. Given that the earnings-based payout ratio stays around or below 60% is a good sign that the dividend will be sustainable, even if things don’t go perfectly.
Finbox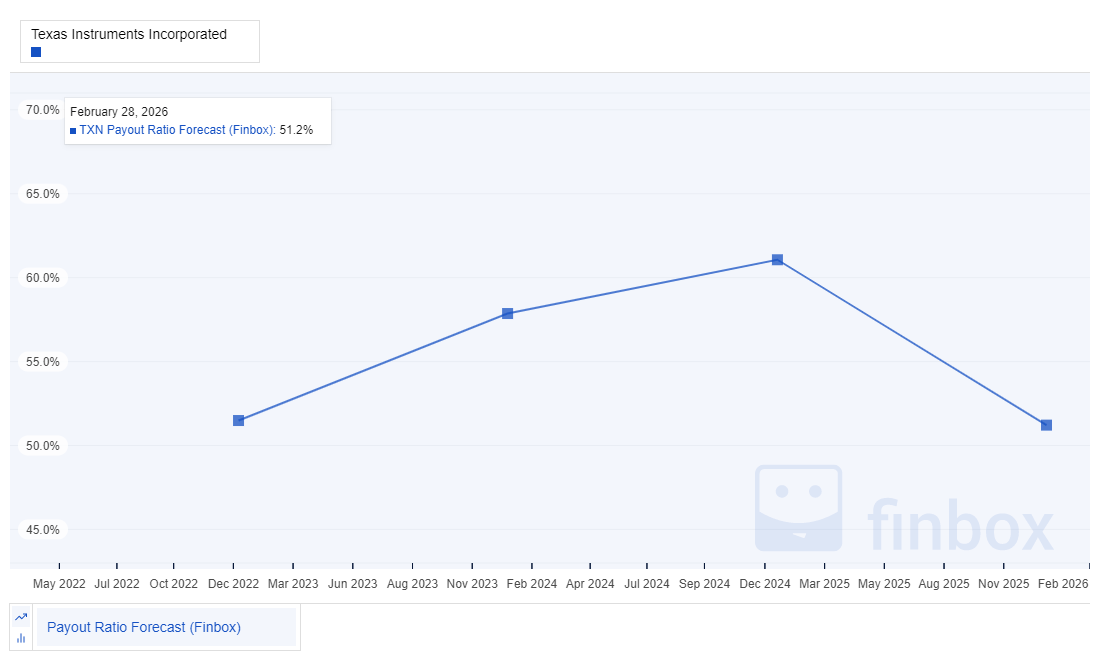
TXN also has earnings and cash flow-based payout ratios on the higher side of what I like to see for strong growth, however, they appear sustainable.
With a short interest under 2%, TXN also does not look to be holding any known surprises, and based on the valuation and dividend sustainability, looks like a good candidate for further investment while also having inflation-beating potential.
Seeking Alpha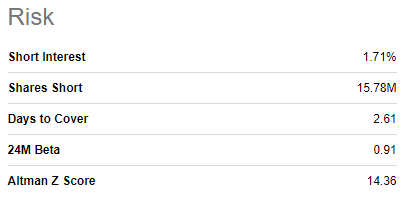
Summary
Dividend growth investing is a great strategy to apply with the uncertainties that exist in the current environment. Not having to worry about what happens with the prices of my stocks on a day-to-day basis works well for me. Instead, I focus on the growing stream of sustainable income, and rejoice when high-quality dividend growth stocks go further on sale, allowing me to add even more income.
One of my biggest worries though is ensuring that my strategy helps me offset inflation. To do that, I want to focus on the companies that are paying sustainable dividends with strong growth. After performing standard valuations for my high-quality dividend growth watchlist, we then looked further at companies that have strong growth overall, and in their dividends, while also considering current yield. Combining the valuations with the growth analysis, Lam Research, BlackRock, and Texas Instruments all appear to offer good valuation potential, while also providing sustainable dividend growth that could overcome inflation.
In addition to the three stocks that we looked at in more detail, Intel Corporation, QUALCOMM Incorporated, Expeditors International of Washington Incorporated, United Parcel Service Incorporated, Merck & Co., Incorporated, A. O. Smith Corporation, and Emerson Electric Company, also appear to be trading at attractive values relative to Historical and Future derived fair values and would be good candidates for further evaluation.
Be the first to comment