

peshkov/iStock via Getty Images
It’s been a brutal year for stock and bond investors.
Ycharts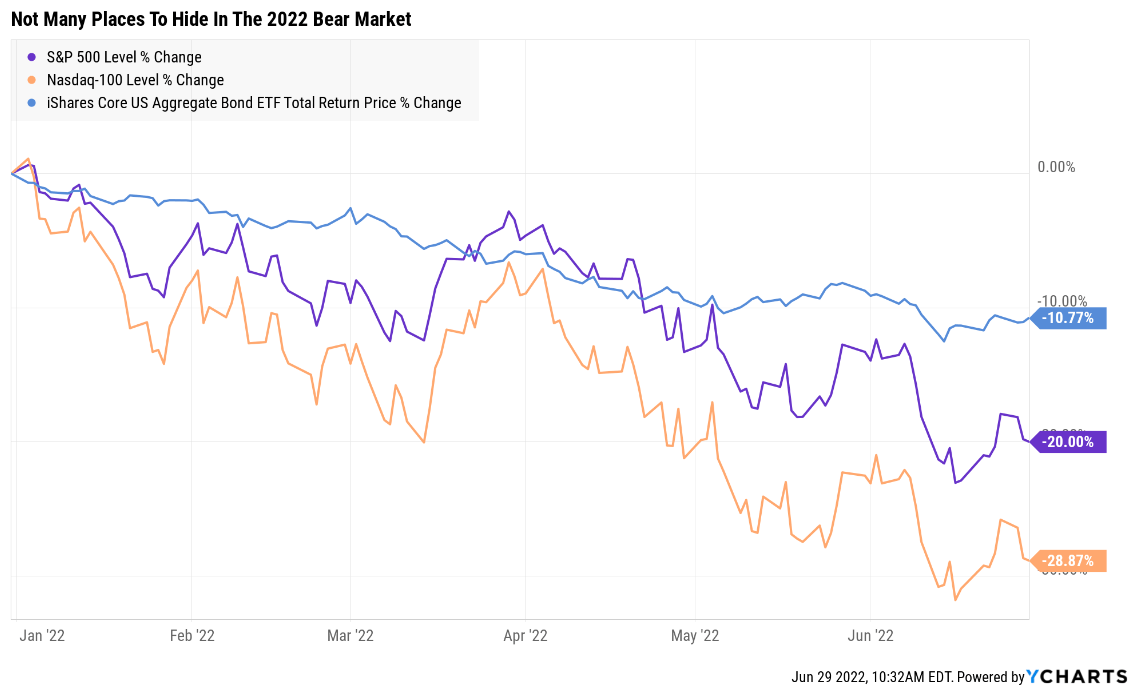
The worst bond bear market in history (by a wide margin) plus stocks falling sharply has resulted in a truly frightening few months for investors.
Worse still, the bear market might not be over, with stocks potentially set to fall a lot more.
| Time Frame | Historically Average Bear Market Bottom |
| Non-Recessionary Bear Markets Since 1965 | -21% (Achieved May 20th) |
| Median Recessionary Bear Market Since WWII | -24% (Citigroup base case with a mild recession) June 16th |
| Non-Recessionary Bear Markets Since 1928 | -26% (Goldman Sachs base case with a mild recession) |
| Average Bear Markets Since WWII | -30% (Morgan Stanley base case) |
| Recessionary Bear Markets Since 1965 | -36% (Bank of America recessionary base case) |
| All 140 Bear Markets Since 1792 | -37% |
| Average Recessionary Bear Market Since 1928 |
-40% (Deutsche Bank, Bridgewater, SocGen Severe Recessionary base case, Morgan Stanley Recessionary Base Case) |
|
(Sources: Ben Carlson, Bank of America, Oxford Economics, Goldman Sachs) |
Deutsche Bank, Bridgewater, Societe Generale, Bank of America, and Morgan Stanley all think the market might end up falling 40% if we slip into recession next year.
Why? It’s simple math. The average historical recessionary bear market trough PE is 13 to 15, and the average S&P EPS decline during a recession is -15%.
- $249 per share EPS consensus for S&P 500 right now
- -15% = $212 X 13 to 15 trough PE = 2,756 to 3,180
- 2,968 mid-range = about 3,000 (-40% peak decline)
- the consensus recessionary bear market consensus among the most accurate economist teams (the blue-chip consensus)
What might a -40% bear market mean for stocks? A further 25% decline from here. Or to put it another way, the bear market might be not quite half over.
Guggenheim Partners 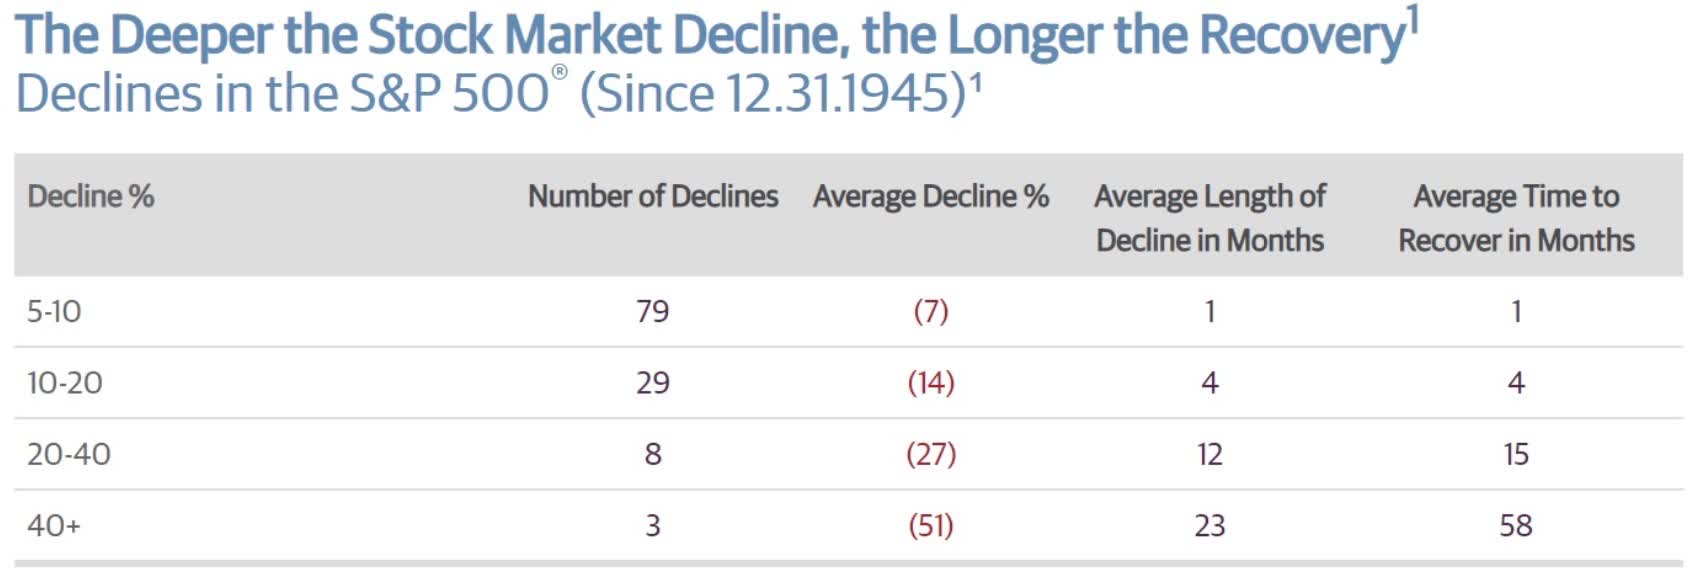
For further context, if the market does end up bottoming at -40% that would be the 3rd market crash in 25 years, roughly 3X the historical rate.
Does this mean that investors should sell all their stocks now and sit in cash, waiting for the carnage to end?
Not if you believe in buying incredible bargains, many of which might bottom a lot earlier than the broader market.
For example, Altria (MO) bottomed in November 2008, while the market bottomed on March 9th, 2009.
Incredible Bargains Are All Around Us
Bloomberg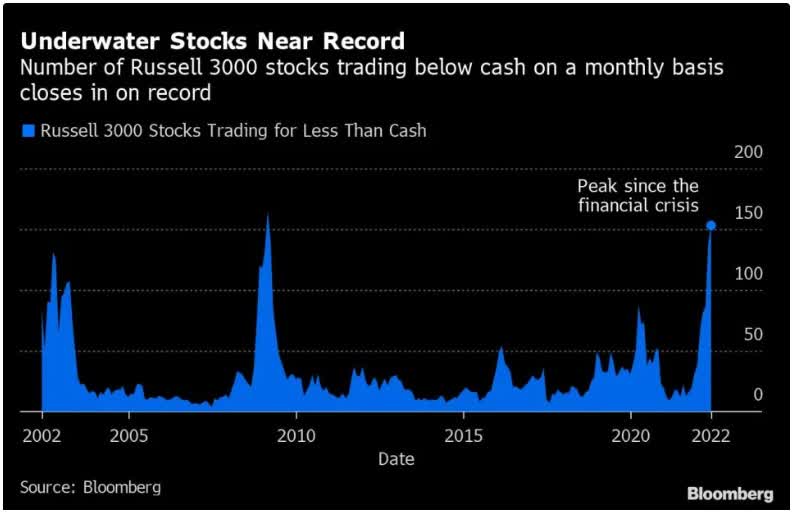
Today 5% of US stocks are trading for less than the cash on their balance sheets, a record according to Bloomberg.
And here’s a shocking fact that explains why I refuse to try to time the market and sit in cash waiting for “the dust to settle”.
Why Market Timing Is The Worst Thing Investors Can Try
According to a new study from Citigroup, missing just the 2 best single-day gains in the S&P 500 each year cuts your annual long-term returns by 80%.
That’s over the last 50 years. But over the last decade? The S&P 500, including this bear market, is up 16% CAGR. Missing those 2 best days per year? A total of 20 market days? Your total return would have been 10%.
Not 10% per year, but 10% in total. That’s -19% adjusted for inflation. During one of the greatest bull markets in US history.
What about market timing over longer time frames?
JPMorgan Asset Management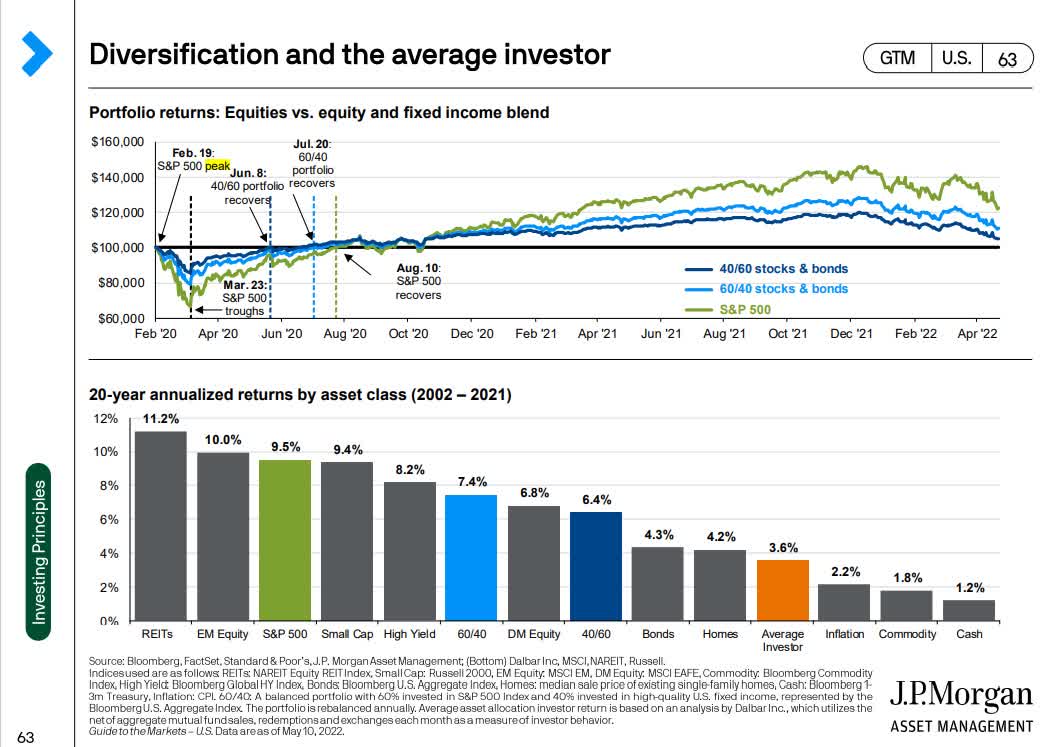
This is how the average investor has done over the last 20 years. 3.6% annual returns, about 2/3 worse than buying and holding the S&P 500. Heck a conservative 40/60 stock/bond portfolio managed to double the returns of the average investor over half an investing lifetime.
The reason according to JPMorgan? Market timing.
Or consider this shocking fact. According to Bank of America’s head of quantitative analysis, over the last 90 years, the S&P 500’s inflation-adjusted return was 1,150X.
Missing just the 10 best days of each DECADE, 90 days in total, reduced that to… -94%.
In other words, rather than make a fortune, market timers lost virtually all their money.
What’s the takeaway? Time in the market, not marketing timing, is the most important first step to retiring in safety and splendor.
Jill Mislinki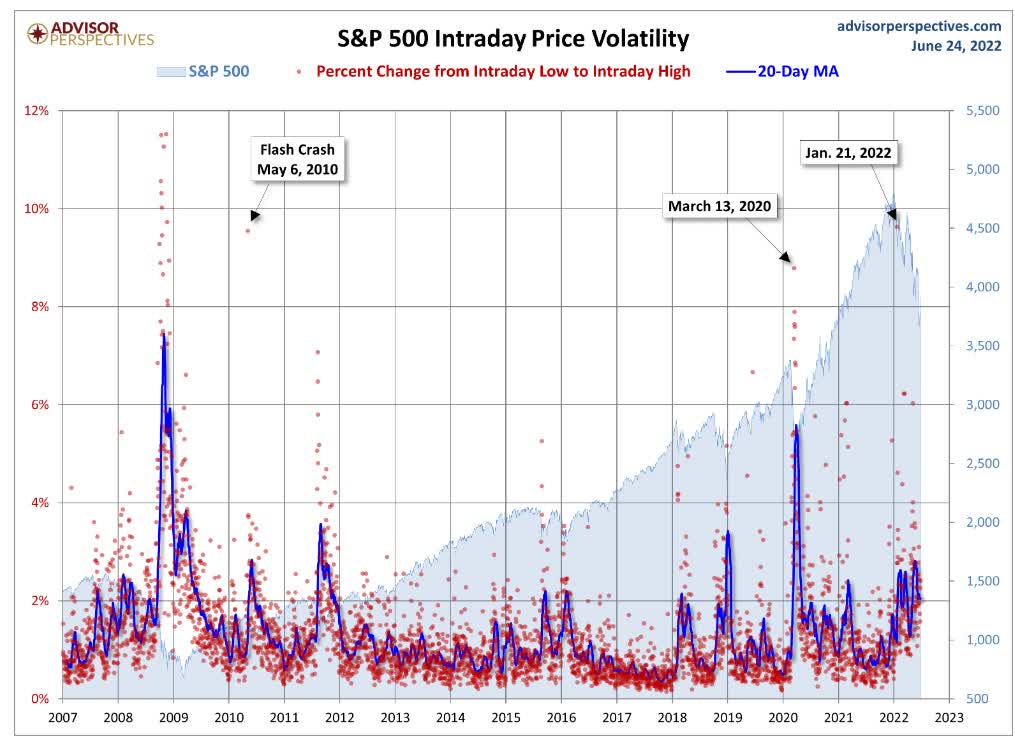
BUT if we have to stay invested at all times because 80% of the market’s best days come within 2 weeks of the worst days, how can we possibly stay sane, safe, and disciplined when stocks can swing as much as 7% in a single day, as the Nasdaq did on January 24th, 2022?
I can show you all the math in the world about the safest ways to compound income and wealth, but if you get scared out of the market for emotional or financial reasons, then it won’t help you at all.
But this is where the power of asset allocation, diversification, and ETFs comes in.
Let me show you why three ETFs can be just the ticket to helping you build a high-yield retirement portfolio of your dreams. One that is 90% likely to help you retire rich and stay rich in retirement, no matter what happens with the stock market or economy in the coming years and decades.
3 Dividend ETFs You’ll Want To Own In The Next Market Crash
As part of the Dividend Kings 45-part Preparing For Recession Series, I’m exploring every facet of recessions, bear markets, risk management, asset allocation, and portfolio construction and management.
That includes analyzing dozens of ETFs to help our members find the right combination of assets to optimize their sleep well at night retirement portfolios.
Here are three wonderful defensive (recession-resistant), low volatility ETFs that can combine with high-yield blue-chips to create a truly extraordinary retirement portfolio.
iShares U.S. Consumer Staples ETF: 22 Years Of Great Returns And Low Volatility
Portfolio Fundamentals
(Source: Morningstar)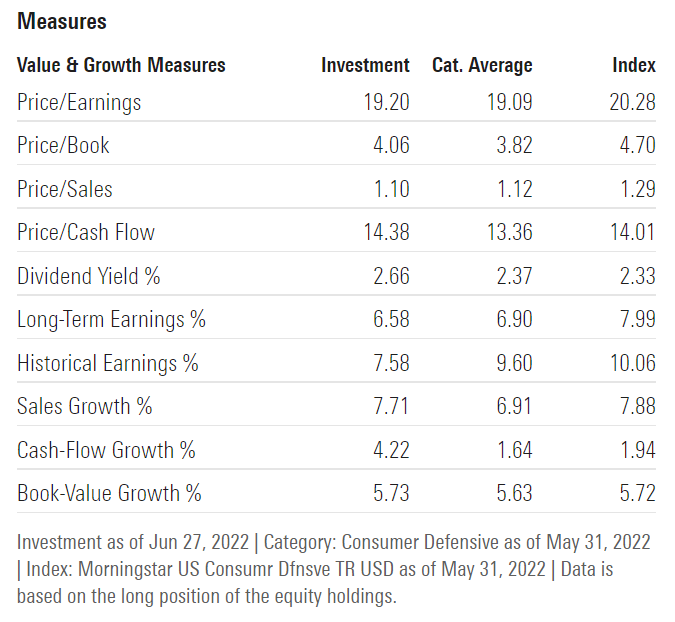
Consumer staples are one of the hottest sectors this year thus the 19.2 PE, though the 14.4X cash flow is still reasonable.
(Source: Morningstar)
65% wide moat is exceptional as is A- financial health.
52% payout ratio vs 70% safe for this sector according to rating agencies.
(Source: Morningstar)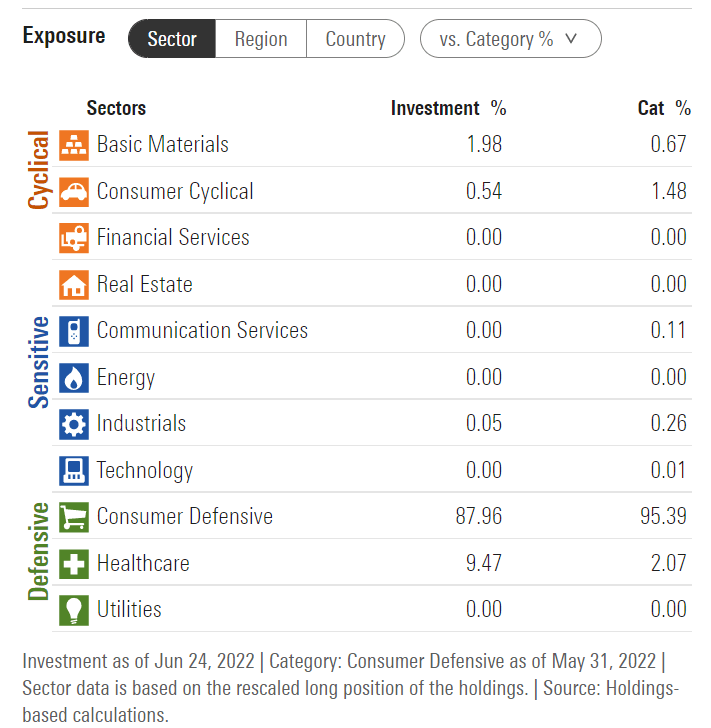
IYK is overweight healthcare vs its peers, which might explain why it’s the best performing consumer staples ETF.
- healthcare was one of the best performing sectors of the last 20 years
(Source: Morningstar)
(Source: Morningstar)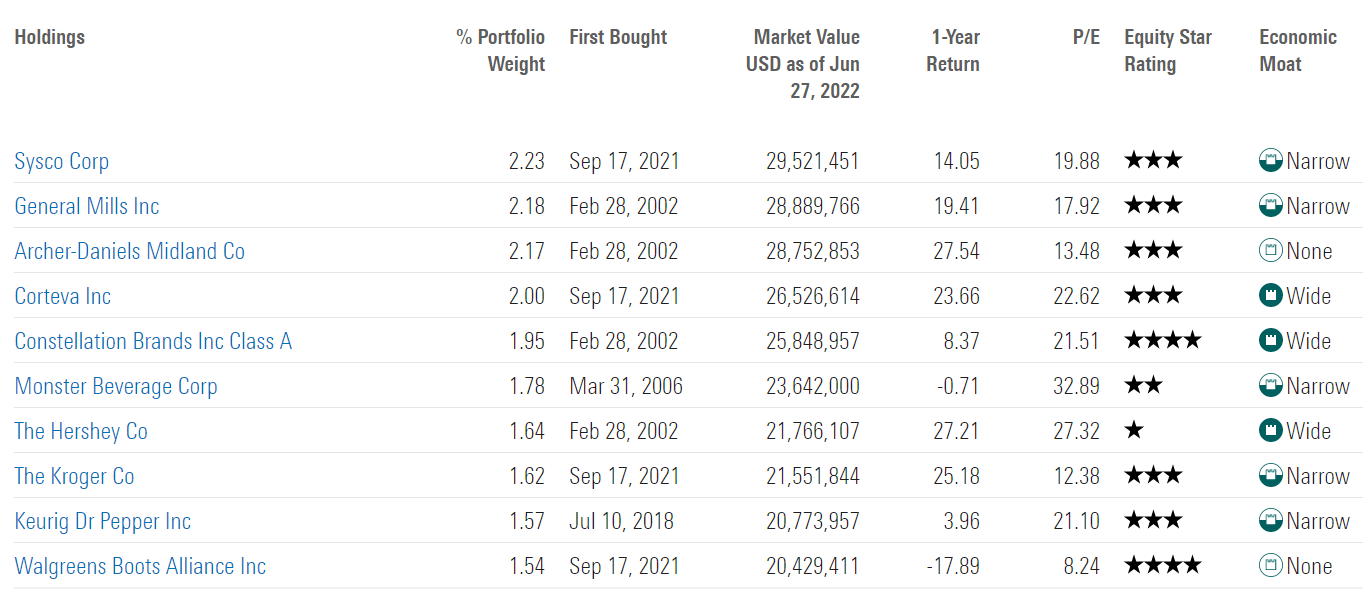
(Source: Morningstar)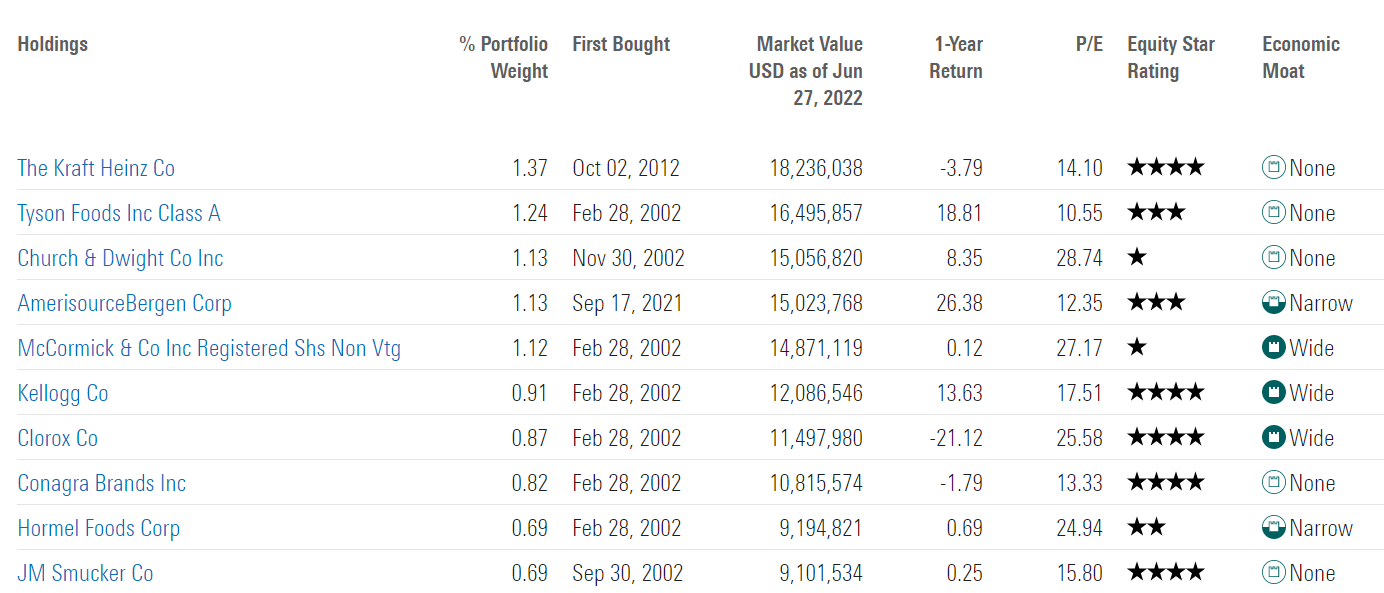
This is a concentrated portfolio with the top 10 holdings making up 64% of the portfolio.
The top 4 names are Ultra SWAN dividend kings and represent 45% of the portfolio, packed to the rafters with dividend aristocrats, champions, and kings.
Vanguard Health Care ETF: A Great Way To Profit From One Of The Most Important Parts Of The Economy
Portfolio Fundamentals
(Source: Morningstar)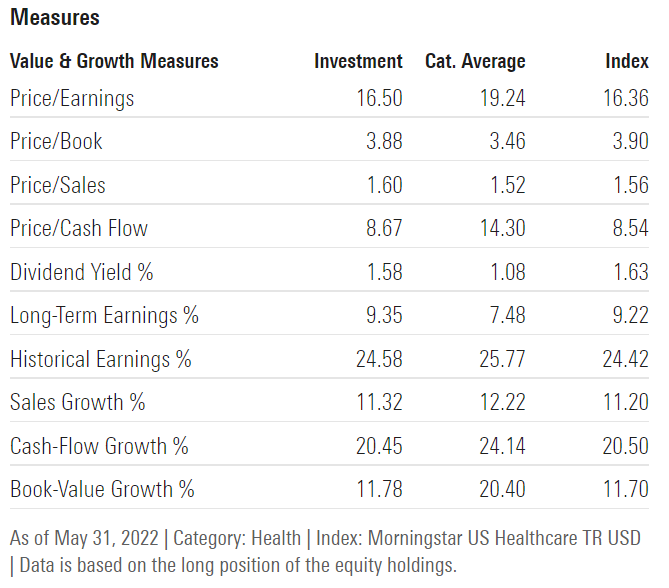
8.7X cash flow is a highly attractive valuation, and the PE is below the average healthcare ETF by a significant amount.
(Source: Morningstar)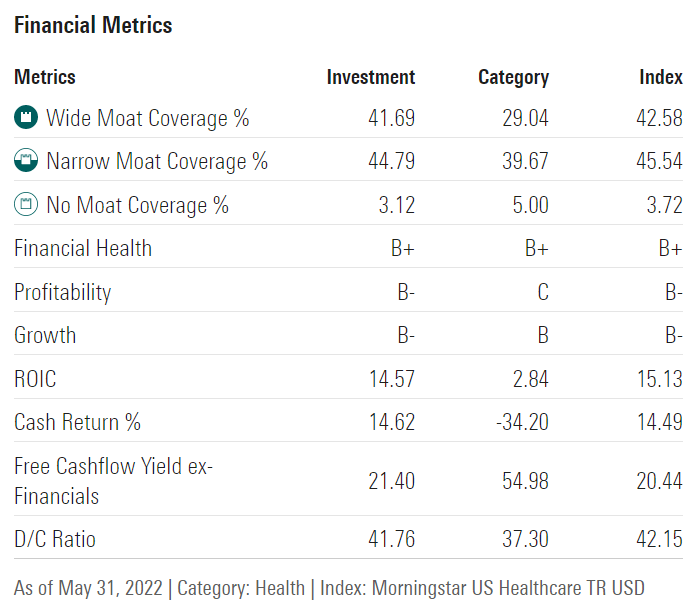
Very moaty and financially strong healthcare giants. A very safe 42% payout ratio vs 60% safe for the sector according to rating agencies.
(Source: Morningstar)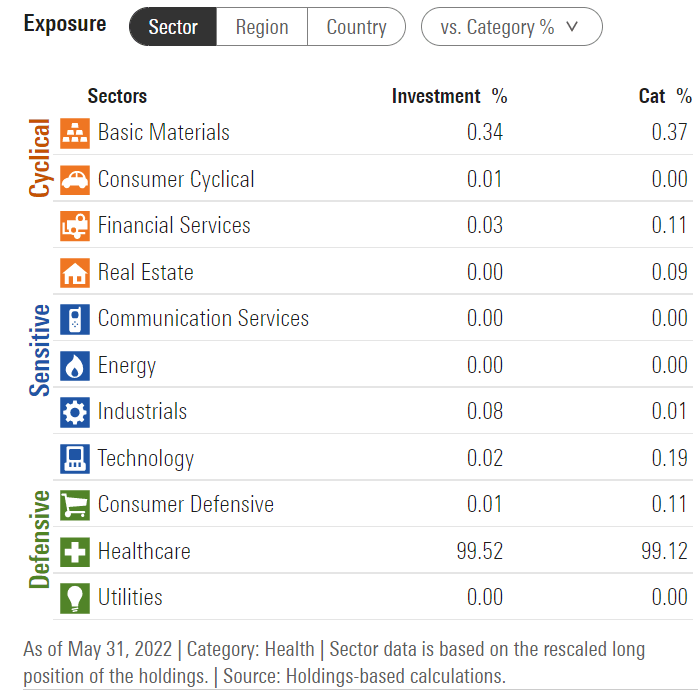
Effectively a pure-play healthcare ETF, just like its peers.
(Source: Morningstar)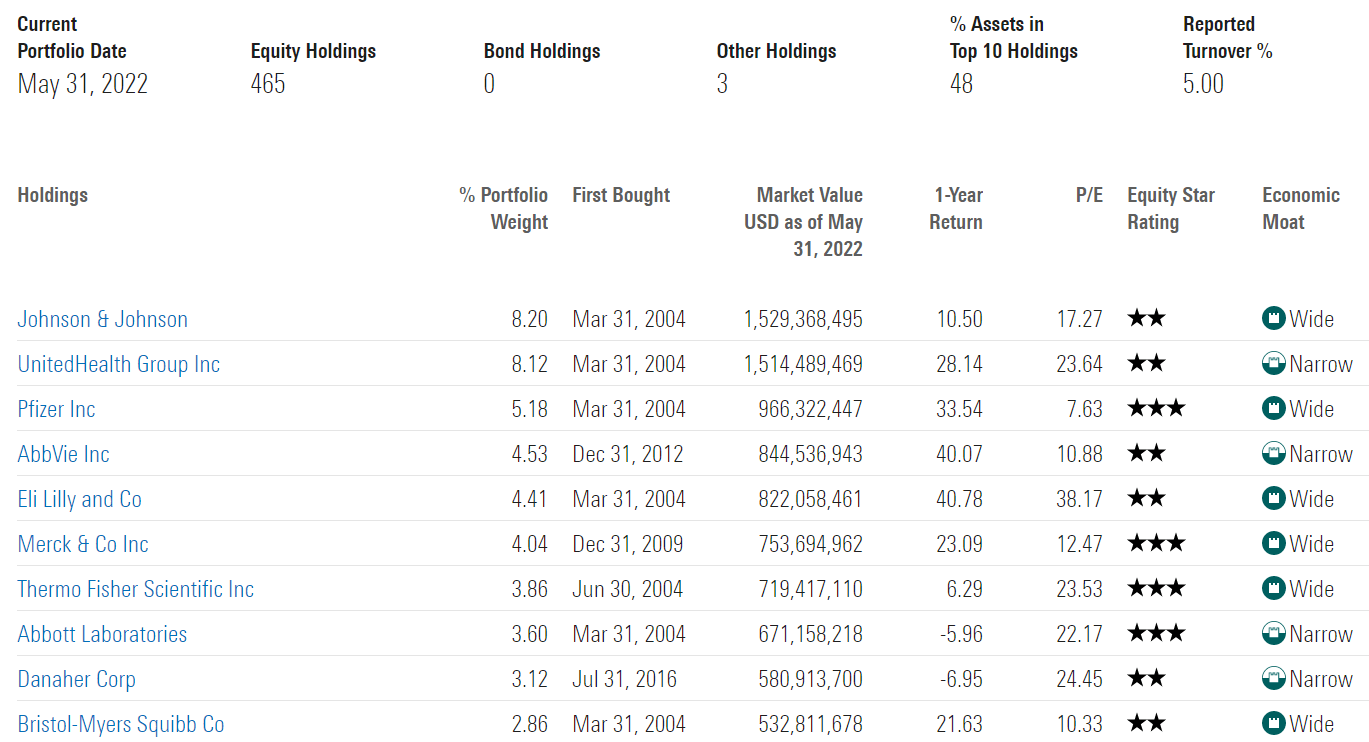
(Source: Morningstar)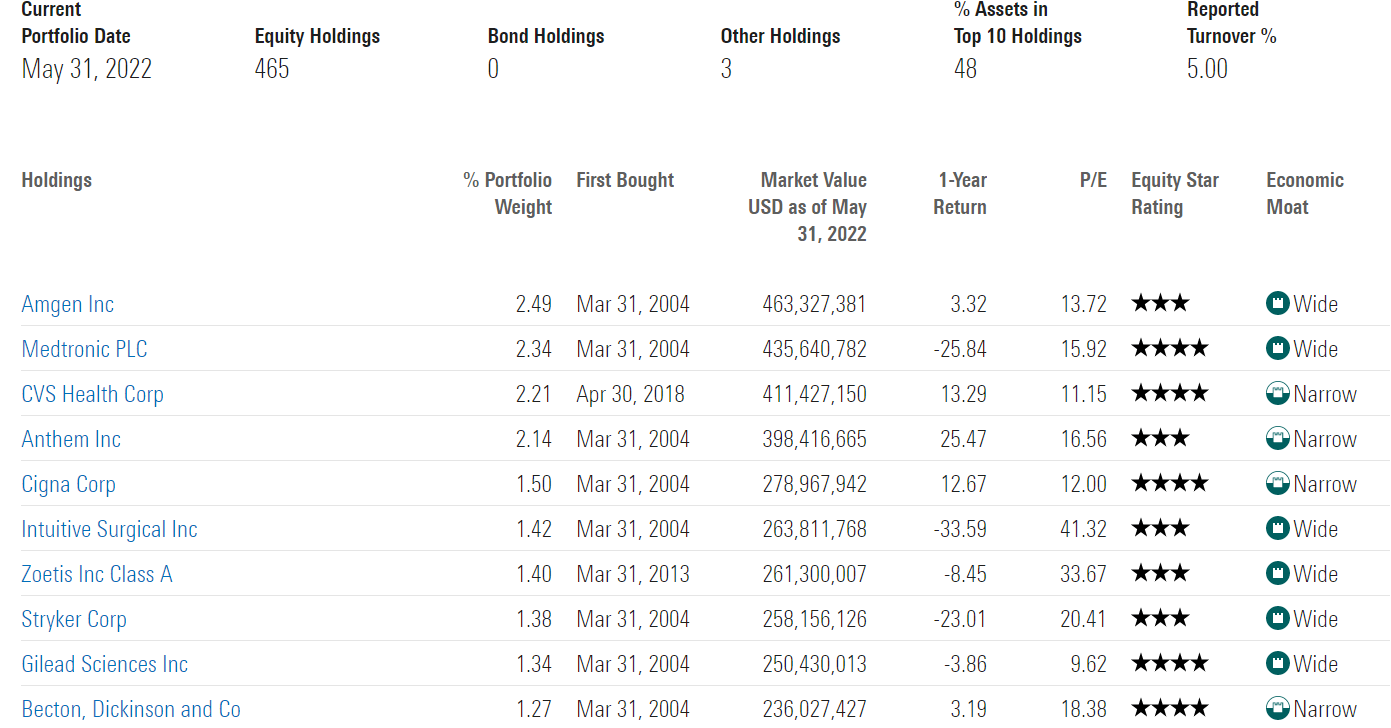
(Source: Morningstar)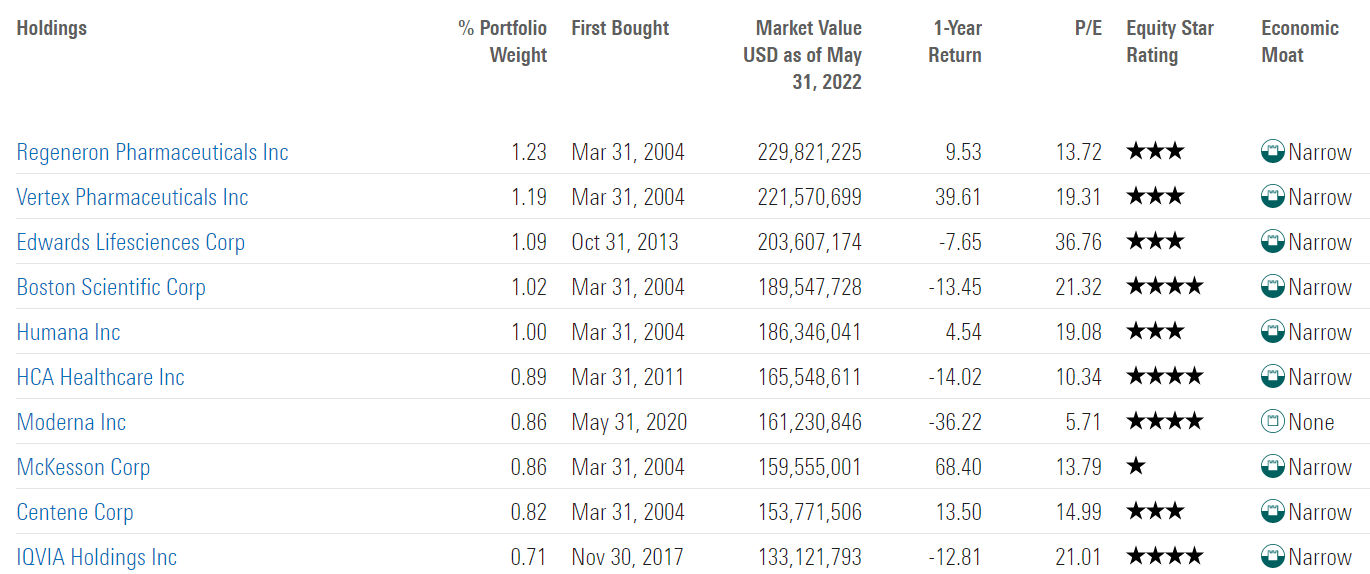
This is a concentrated portfolio with the top 10 holdings making up 48% of the portfolio despite owning 465 companies.
The top 2 names are Ultra SWANs and makeup 16%. Lots of dividend aristocrats, champions, and kings.
Vanguard Utilities ETF: Boring Is Beautiful
Portfolio Fundamentals
(Source: Morningstar)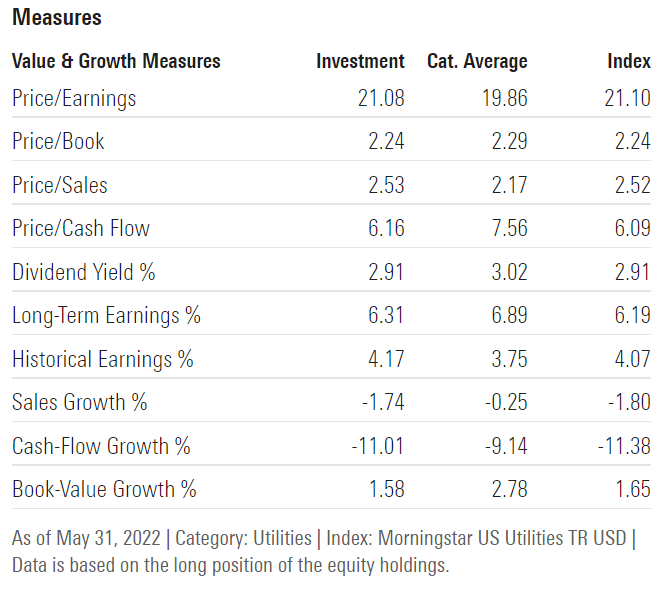
Utilities are expensive in terms of PE though relatively reasonably priced based on operating cash flows.
(Source: Morningstar)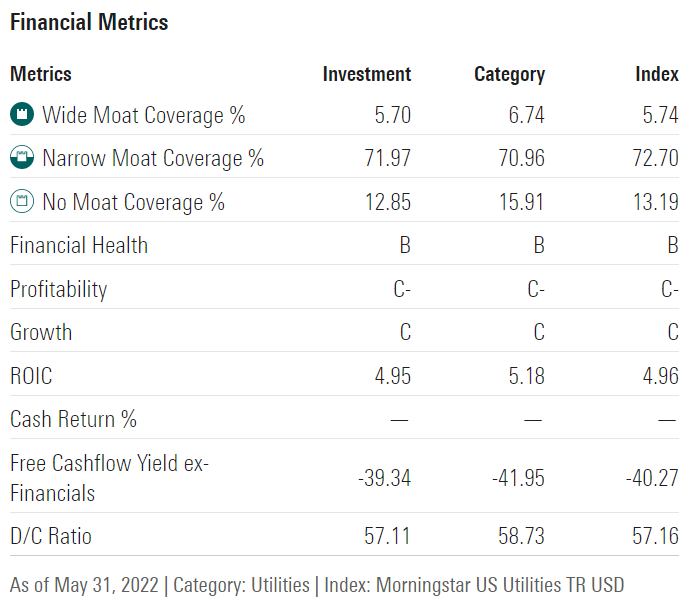
This is a narrow moat sector with high leverage (supported by steady cash flows) and the 57% payout ratio is well below the 75% safety guideline from rating agencies.
(Source: Morningstar)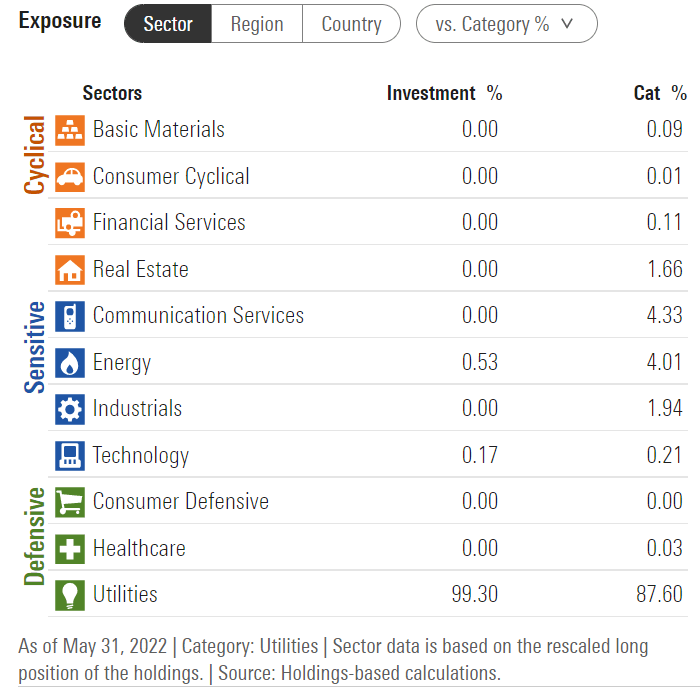
This is effectively a pure-play utility ETF unlike most of its peers which have telecom and energy exposure as well.
(Source: Morningstar)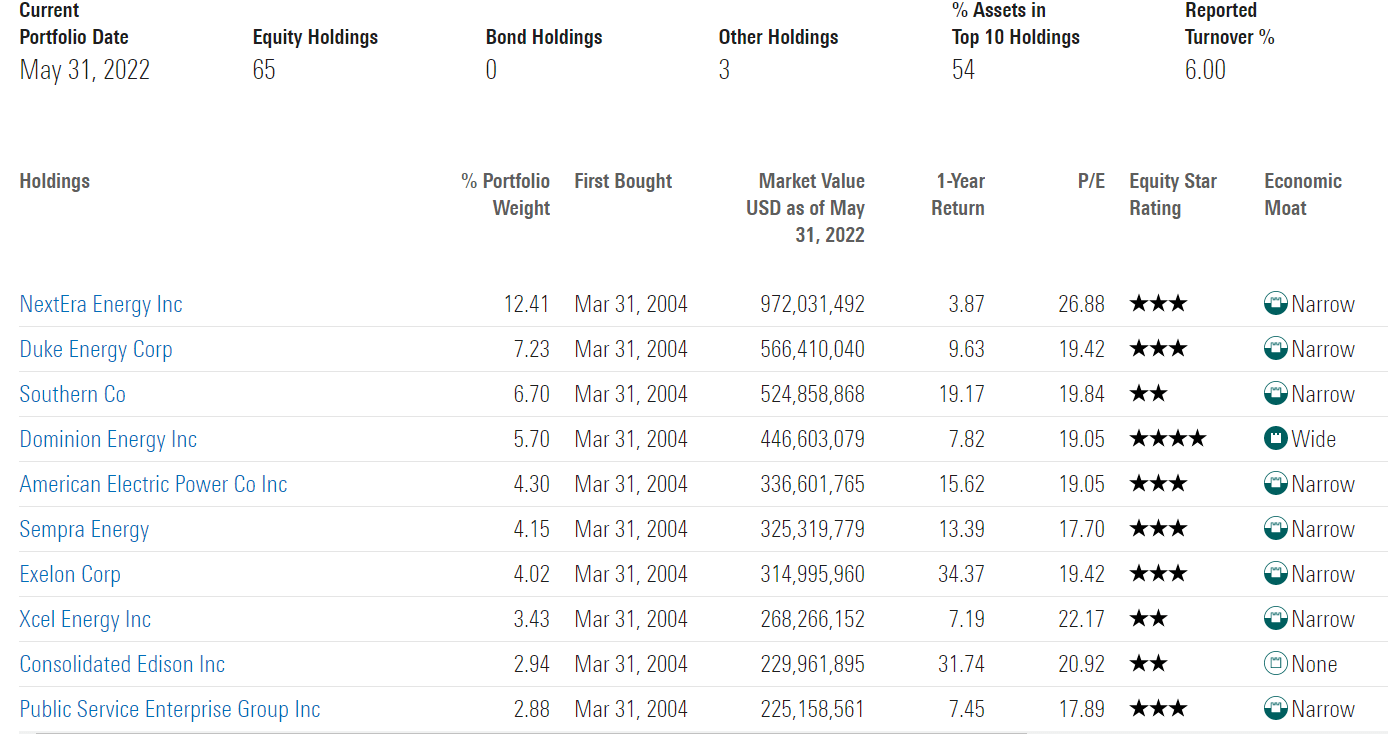
(Source: Morningstar)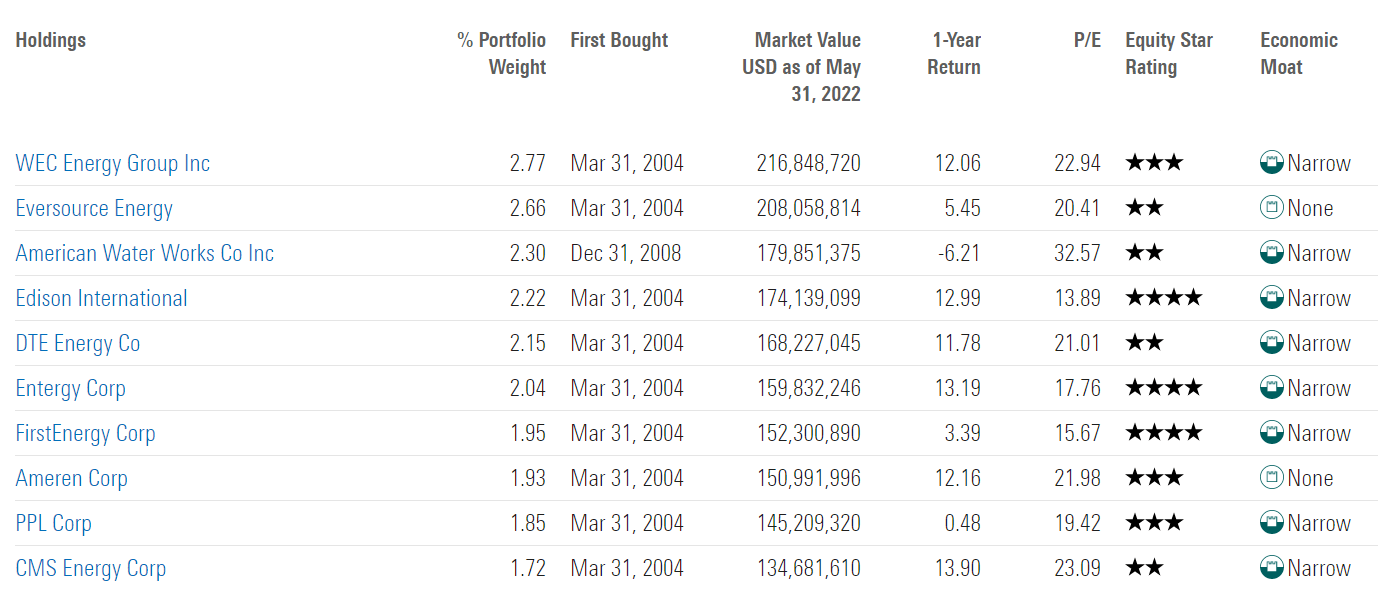
(Source: Morningstar)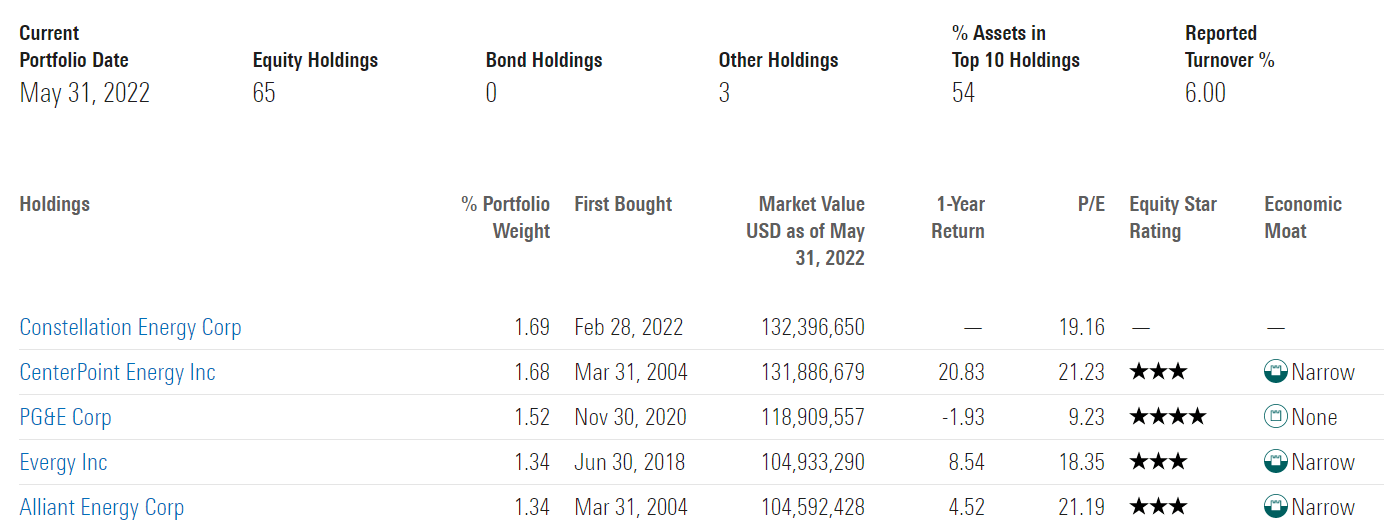
This is a concentrated portfolio with the top 10 holdings making up 54% of the portfolio. Lots of dividend aristocrats, champions, kings, and Super SWANs.
Historical Return Data: ETFs You Can Trust To Do Their Jobs
“History doesn’t repeat itself, but it does rhyme” – Mark Twain
Past performance is no guarantee of future results, but studies show that blue-chips with relatively stable fundamentals over time offer predictable returns based on yield, growth, and valuation mean reversion.
Bank of America
So let’s take a look at how each ETF has done historically, since their inception dates.
iShares U.S. Consumer Staples ETF Since July 2000
(Source: Portfolio Visualizer Premium)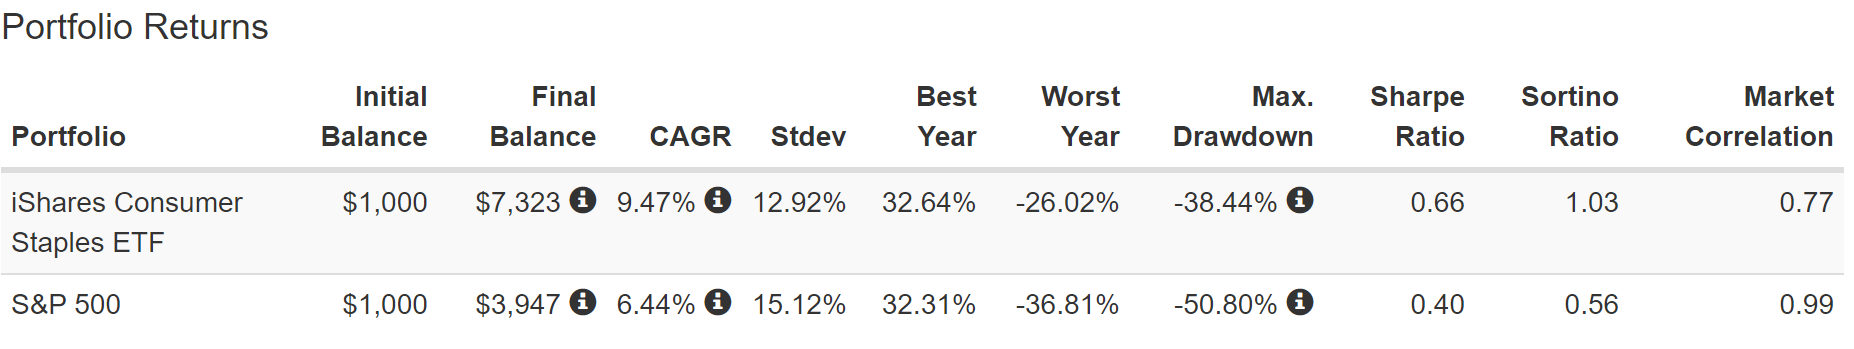
(Source: Portfolio Visualizer Premium)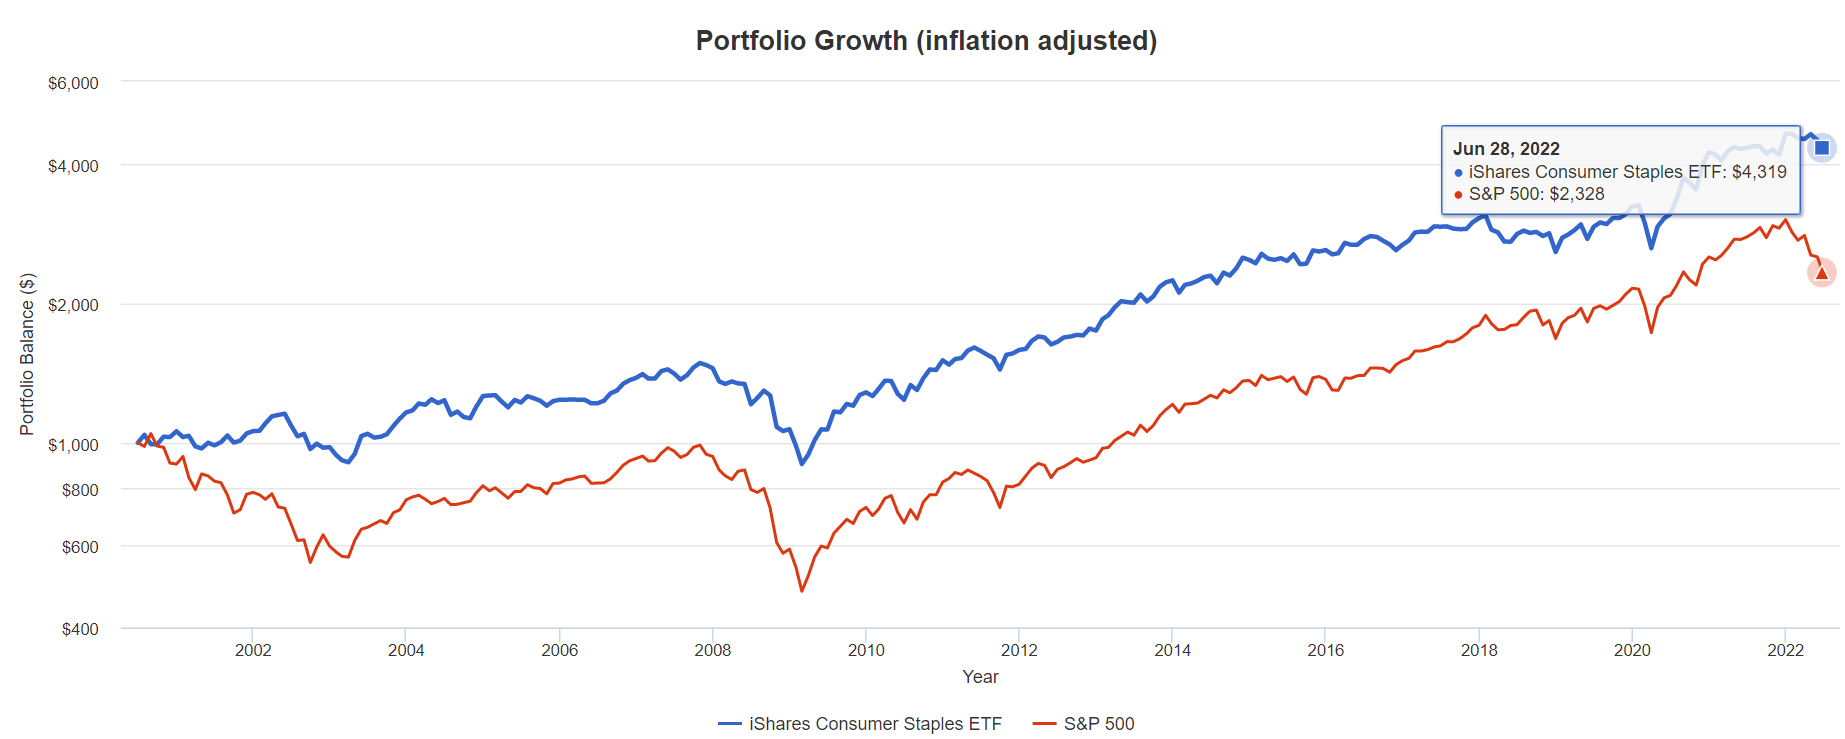
(Source: Portfolio Visualizer Premium)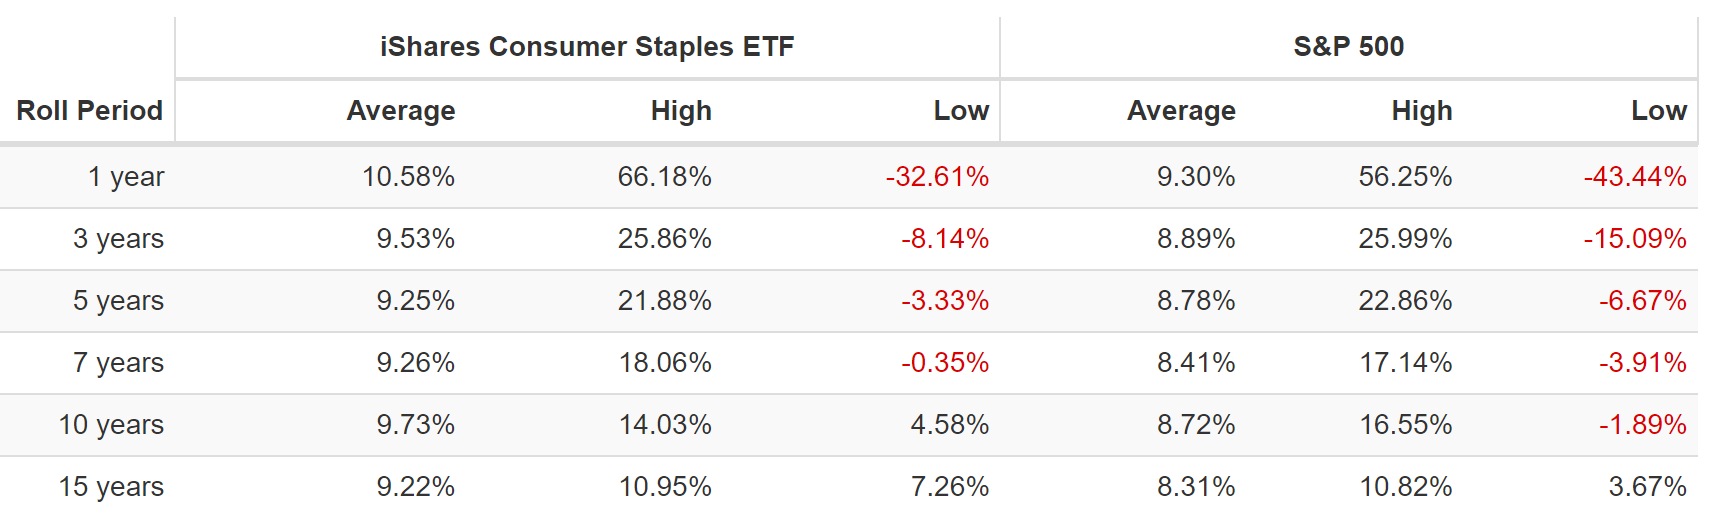
IYK has beaten the market over time by a wide margin not thanks to superior growth, but slow and steady growth, dividends, and low volatility.
- 13% annual volatility vs 15% and 38% peak decline in the Great Recession vs 51%
(Source: Portfolio Visualizer Premium)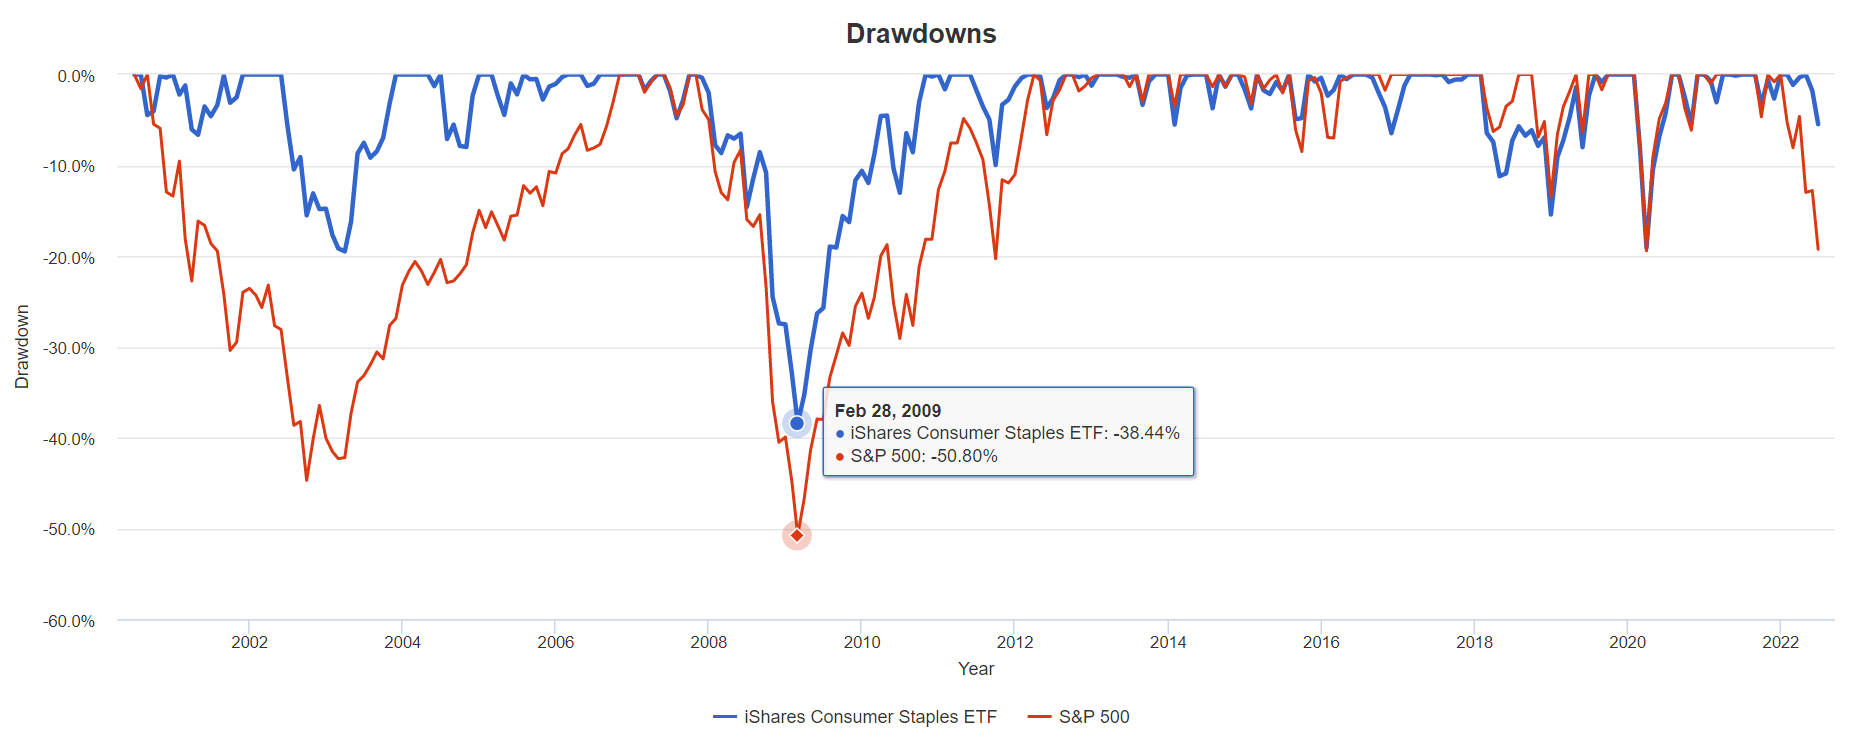
(Source: Portfolio Visualizer Premium)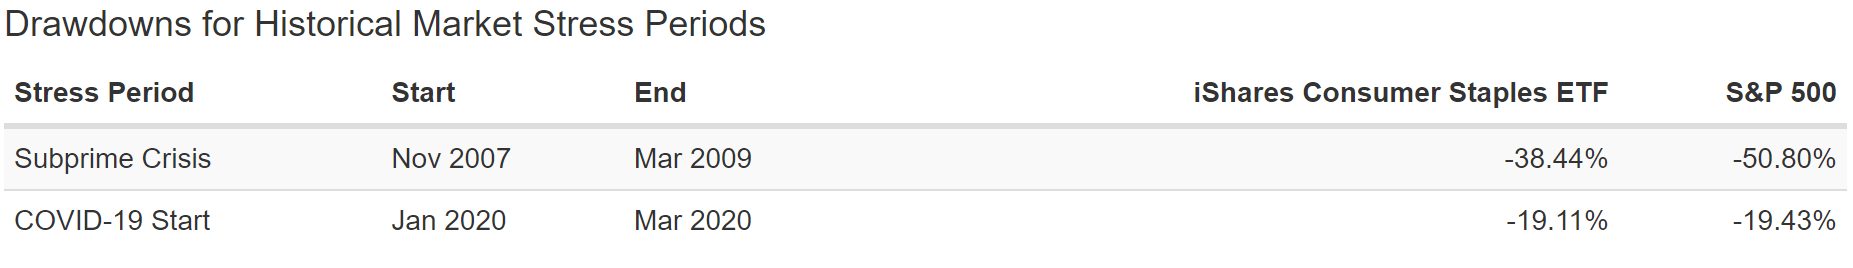
(Source: Portfolio Visualizer Premium)
Consumer staples are one of two sectors that traditionally goes up a bit in recent recessions (healthcare is the other).
In this bear market, IYK is down 2% vs the market’s 19%.
(Source: Portfolio Visualizer Premium)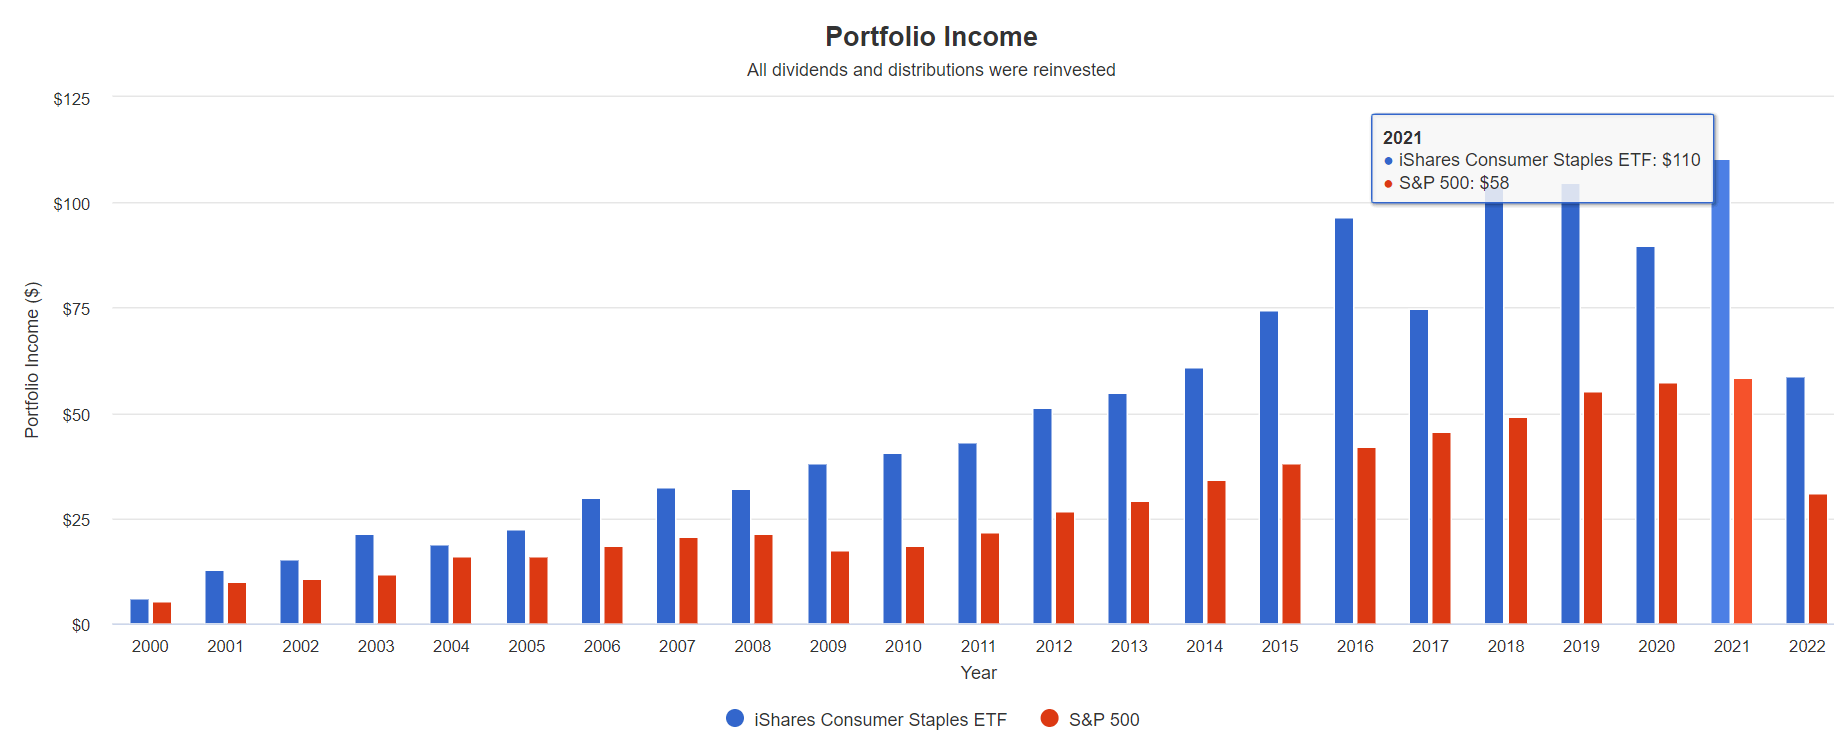
| Portfolio | 2001 Income Per $1,000 Investment | 2021 Income Per $1,000 Investment | Annual Income Growth | Starting Yield | 2021 Yield On Cost |
| S&P 500 | $10 | $58 | 9.19% | 1.0% | 5.8% |
| iShares U.S. Consumer Staples ETF | $13 | $110 | 11.27% | 1.3% | 11.0% |
(Source: Portfolio Visualizer Premium)
IYK has delivered 2% faster annual income growth over time, which compounds over 20 years to nearly 2X the annual income.
| Analyst Consensus Income Growth Forecast | Risk-Adjusted Expected Income Growth | Risk And Tax-Adjusted Expected Income Growth |
Risk, Inflation, And Tax Adjusted Income Growth Consensus |
| 11.1% | 7.7% | 6.6% | 4.0% |
(Source: DK Research Terminal, FactSet, Morningstar)
Morningstar’s analysts expect similar growth in the future which translates into 4% real expected income growth.
- 2X better than the S&P 500
- 8X better than a 60/40
Vanguard Health Care ETF Since February 2004
(Source: Portfolio Visualizer Premium)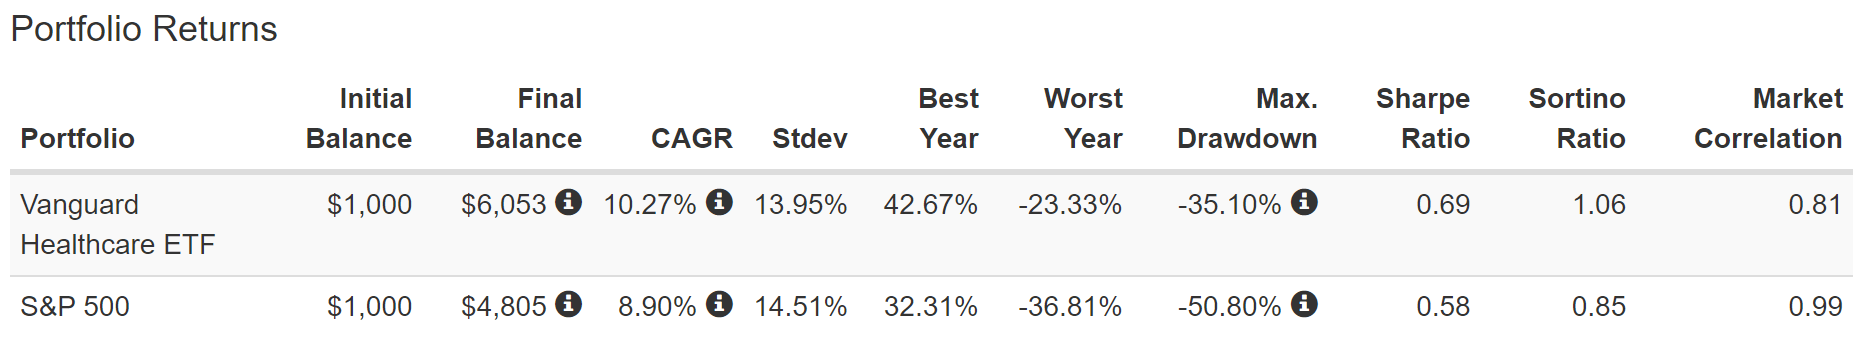
(Source: Portfolio Visualizer Premium)
(Source: Portfolio Visualizer Premium)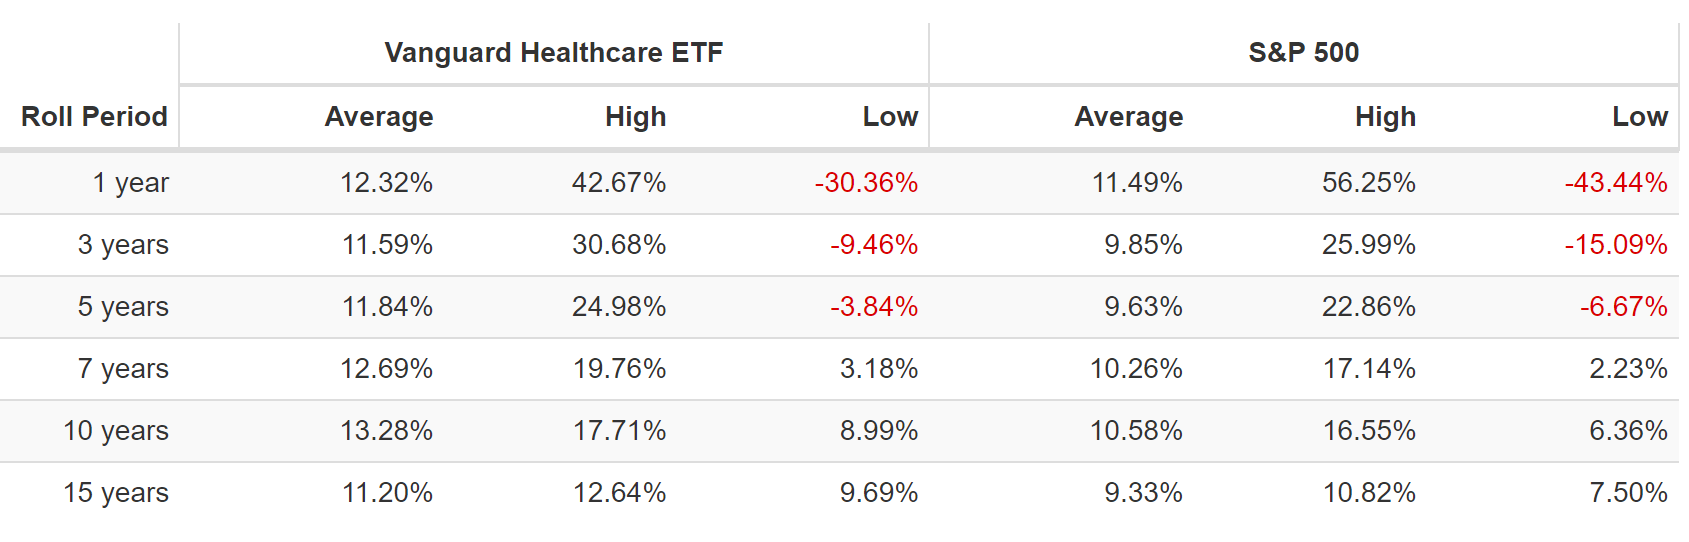
Healthcare is the other sector that has historically gone up a bit in recent recessions, and VHT has consistently beaten the S&P by falling less in bear markets and mostly keeping up during economic expansions.
- other than the Pandemic bubble
(Source: Portfolio Visualizer Premium)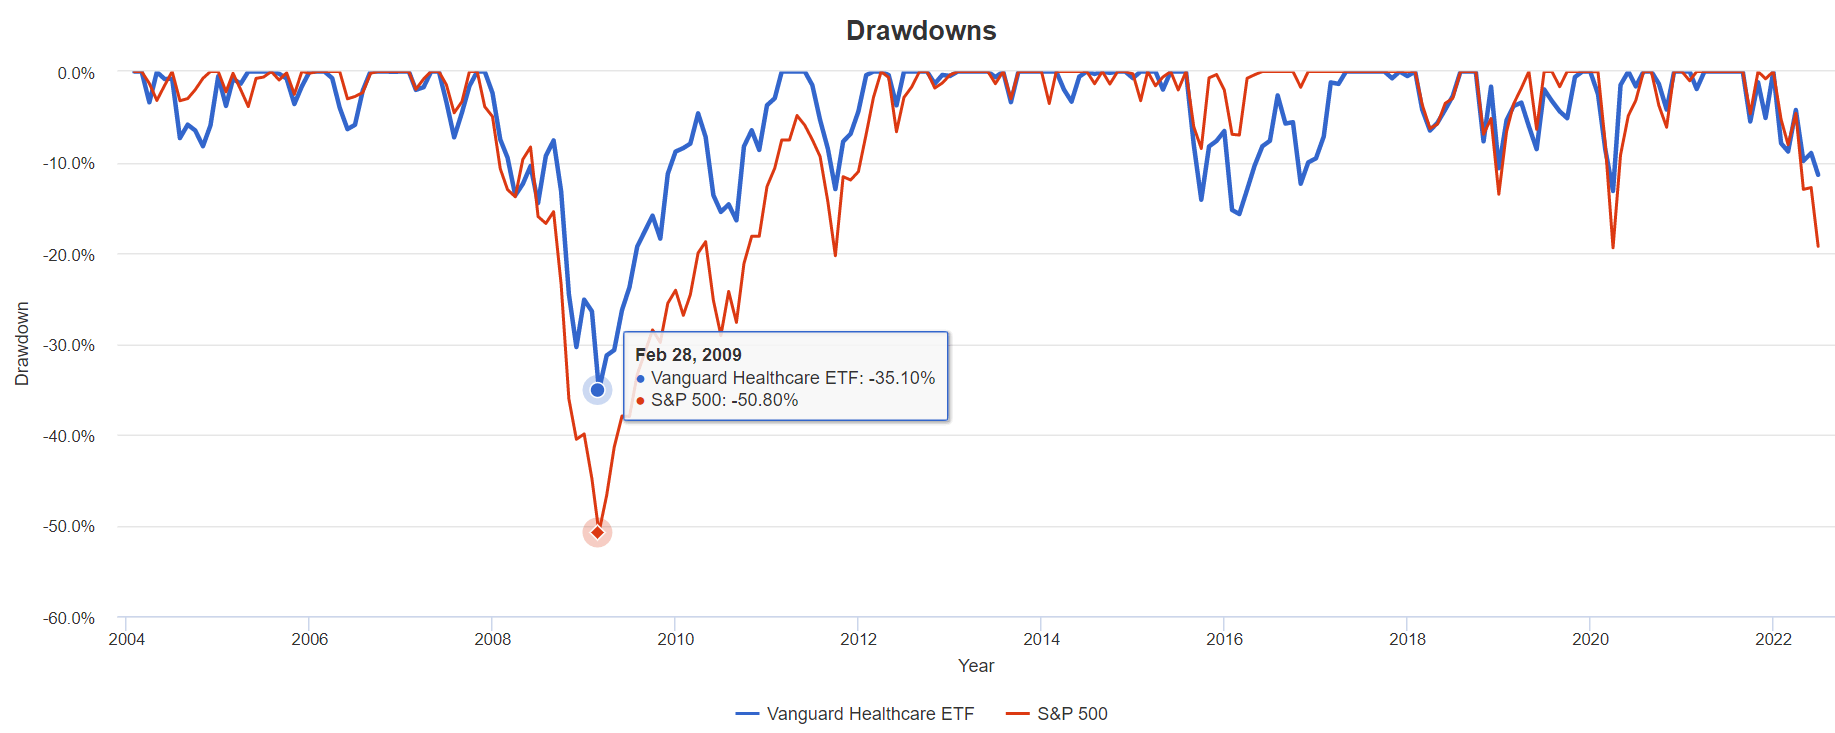
(Source: Portfolio Visualizer Premium)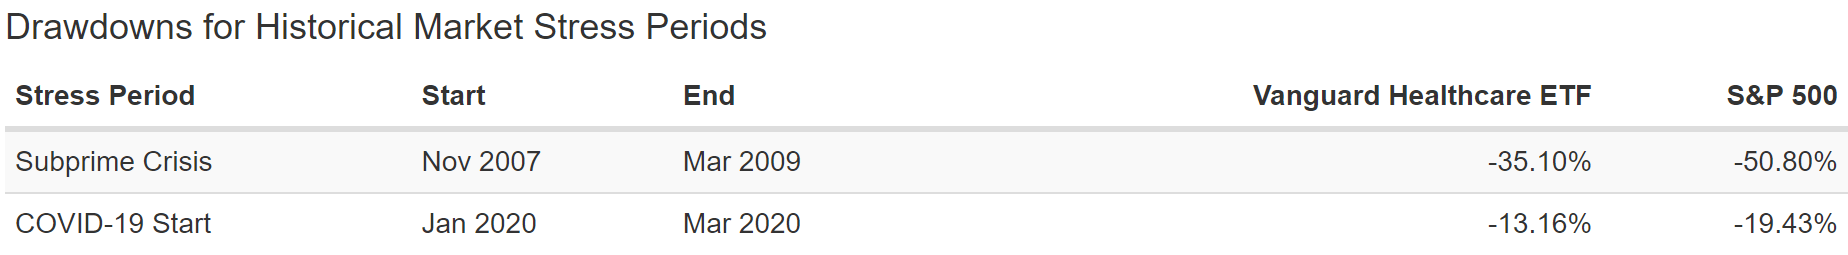
(Source: Portfolio Visualizer Premium)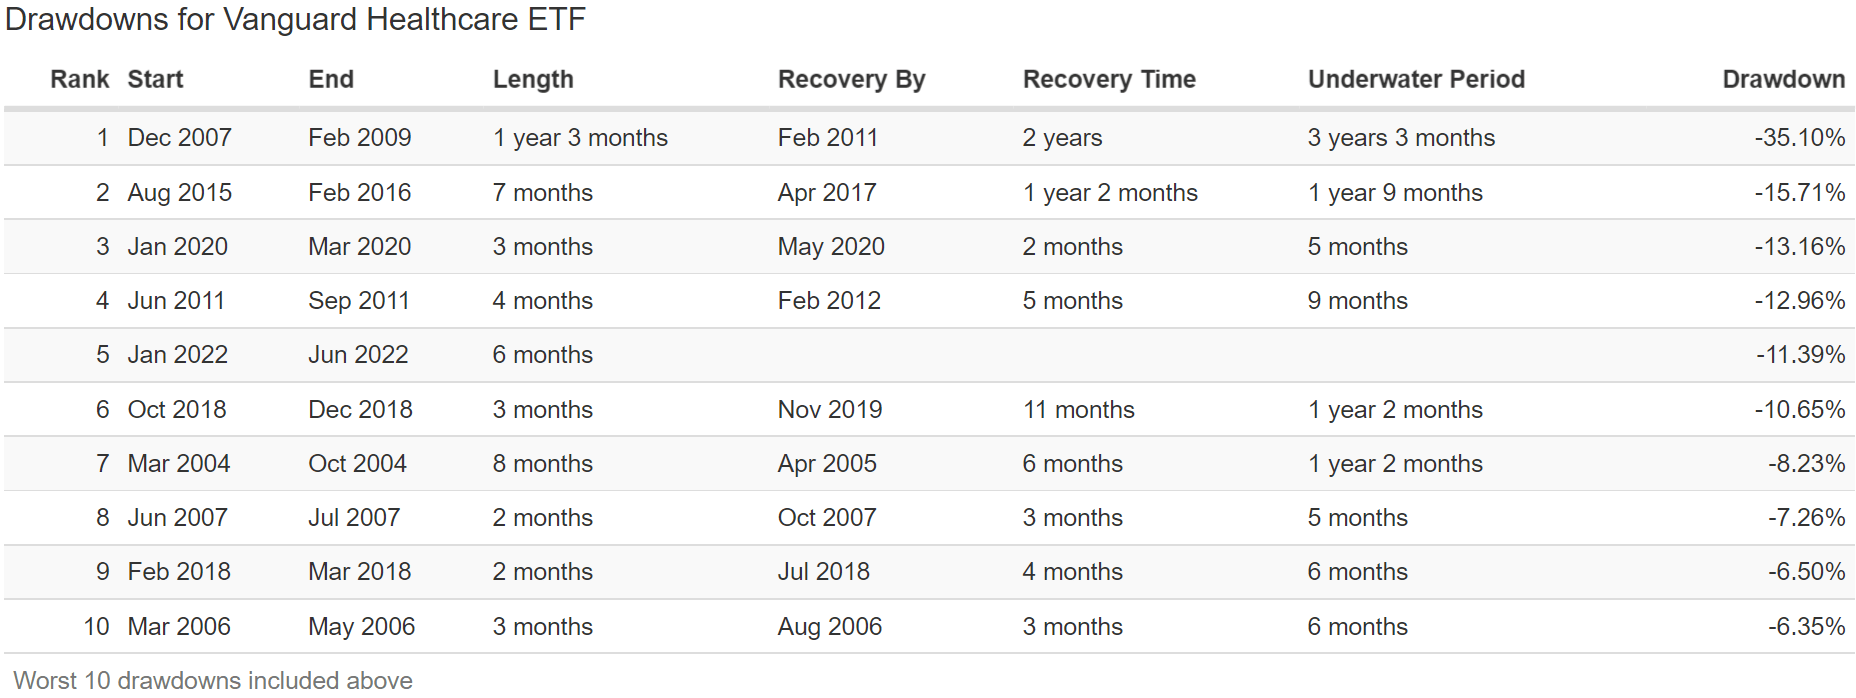
During the Pandemic, VHT was second only to bonds and QQQ in terms of small declines, and in this bear market, it’s down 11% vs the S&P 500’s 19%.
(Source: Portfolio Visualizer Premium)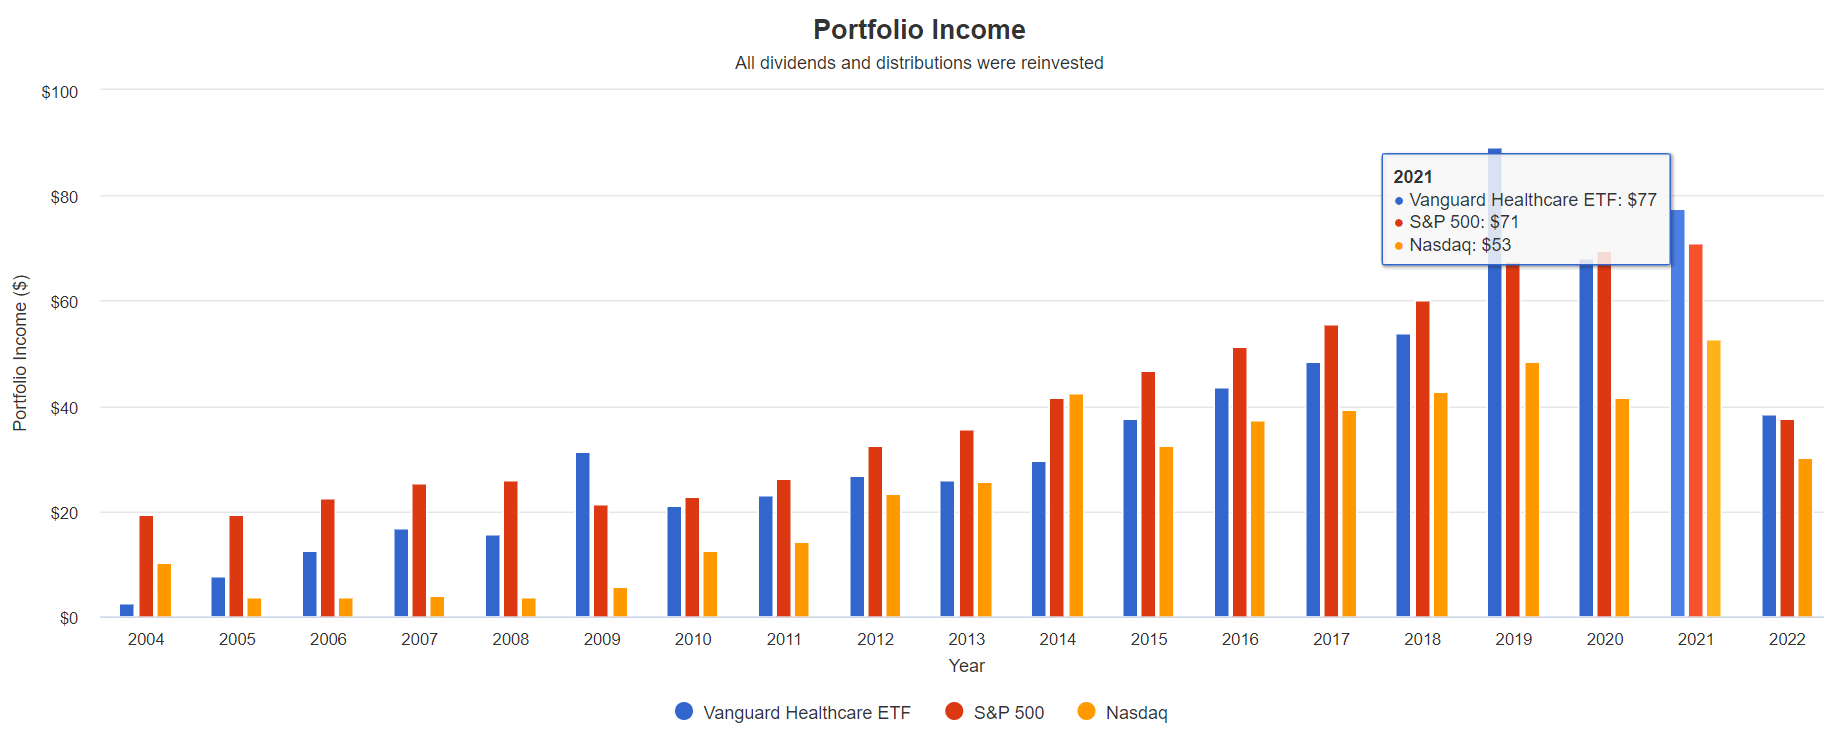
VHT has experienced dividend recession following the Great Recession and in the last few years, though is generally a good source of rising annual income.
| Portfolio | 2005 Income Per $1,000 Investment | 2021 Income Per $1,000 Investment | Annual Income Growth | Starting Yield | 2021 Yield On Cost |
| S&P 500 | $19 | $71 | 8.59% | 1.9% | 7.1% |
| Nasdaq | $4 | $53 | 17.53% | 0.4% | 5.3% |
| Vanguard Healthcare ETF | $8 | $77 | 15.20% | 0.8% | 7.7% |
(Source: Portfolio Visualizer Premium)
In fact, since 2005 it’s delivered annual income growth almost as strong as the Nasdaq’s and almost 2X better than the S&P 500.
| Analyst Consensus Income Growth Forecast | Risk-Adjusted Expected Income Growth | Risk And Tax-Adjusted Expected Income Growth |
Risk, Inflation, And Tax Adjusted Income Growth Consensus |
| 16.3% | 11.4% | 9.7% | 7.1% |
(Source: DK Research Terminal, FactSet, Morningstar)
Morningstar’s analysts expect similar growth in the future which translates into 7.1% real expected income growth.
- 3.5X better than the S&P 500
- 14X better than a 60/40
Vanguard Utilities ETF Since February 2004
(Source: Portfolio Visualizer Premium)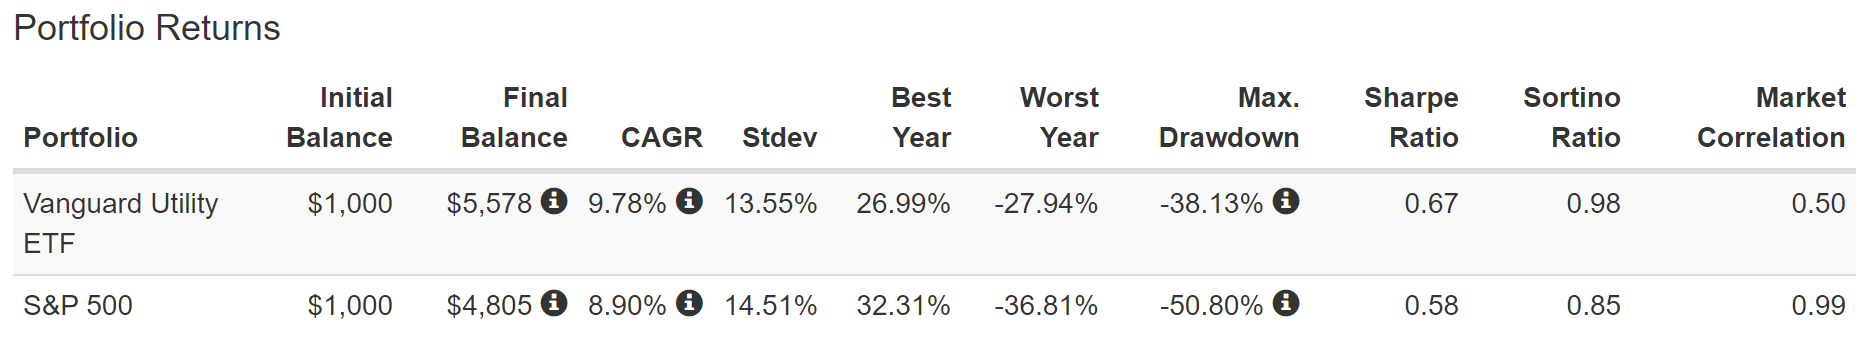
(Source: Portfolio Visualizer Premium)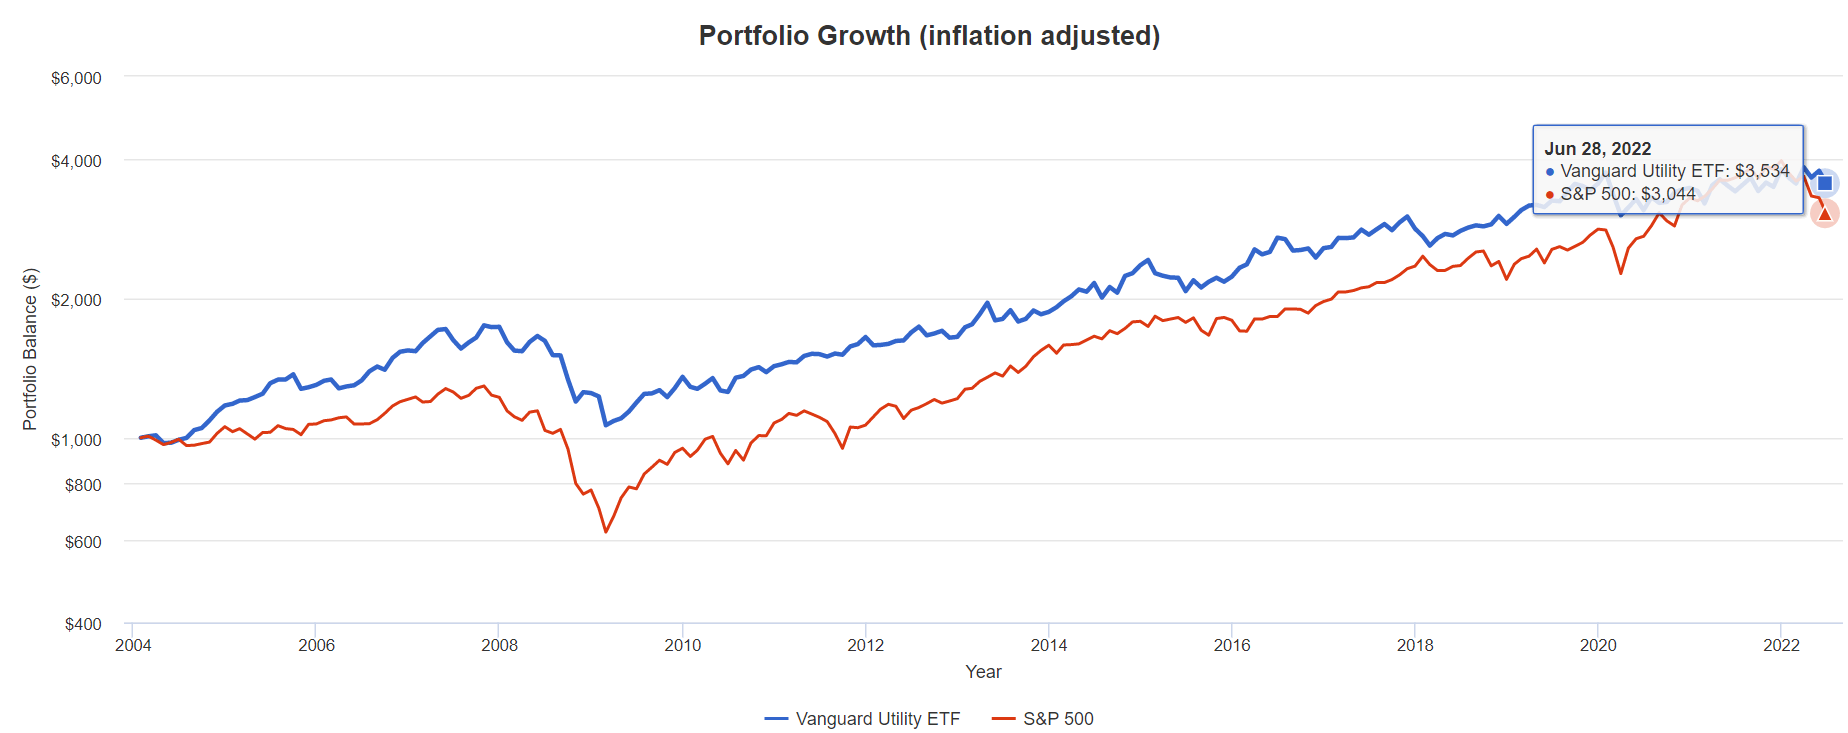
(Source: Portfolio Visualizer Premium)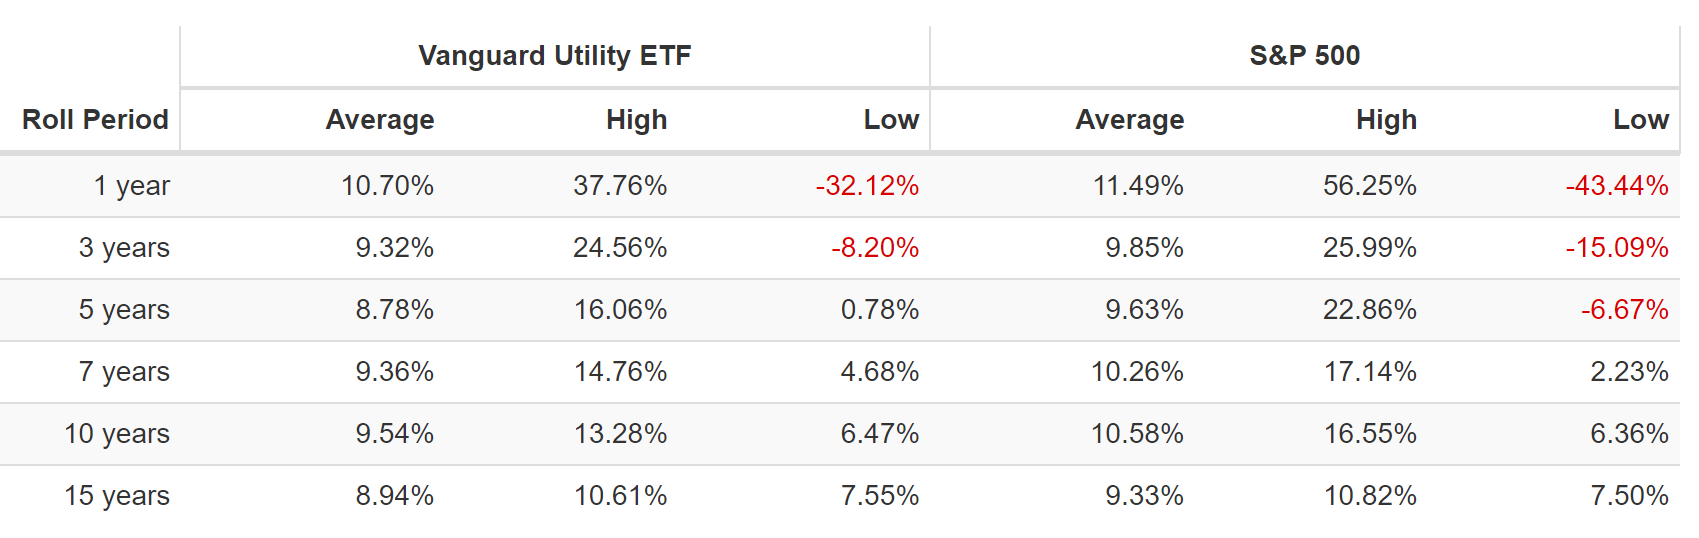
VPU has beaten the market since 2004 but not because of superior growth.
- low volatility in bear markets
- the tailwind of falling interest rates almost the entire time pushing up the PE of these companies
- in the future interest rates are expected to be roughly where they are now
- lack of falling rates means slow-growing utilities are expected to modestly underperform the market
(Source: Portfolio Visualizer Premium)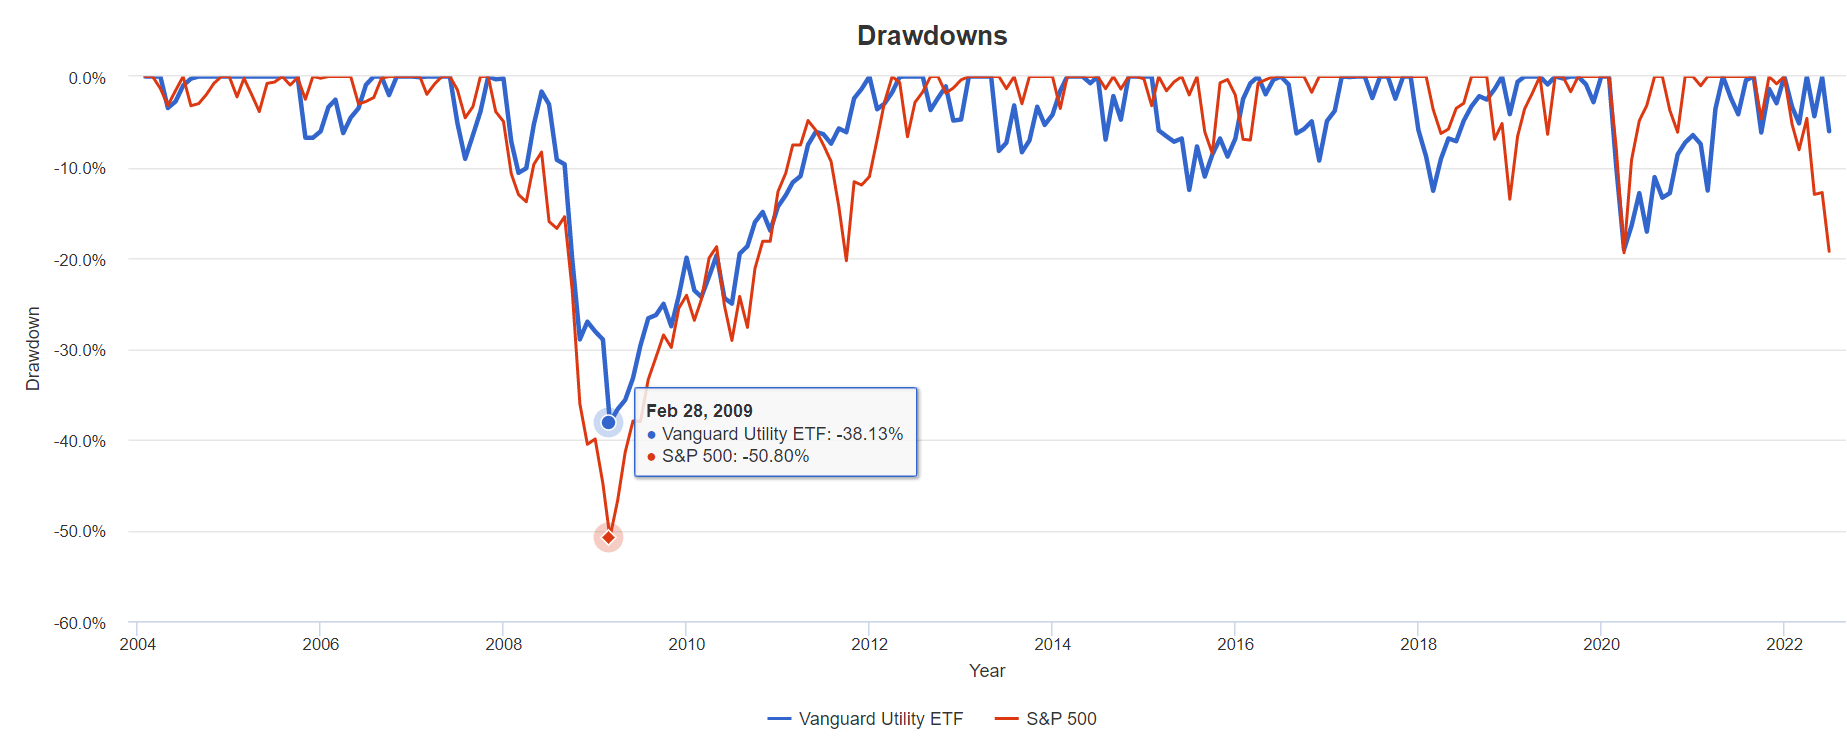
(Source: Portfolio Visualizer Premium)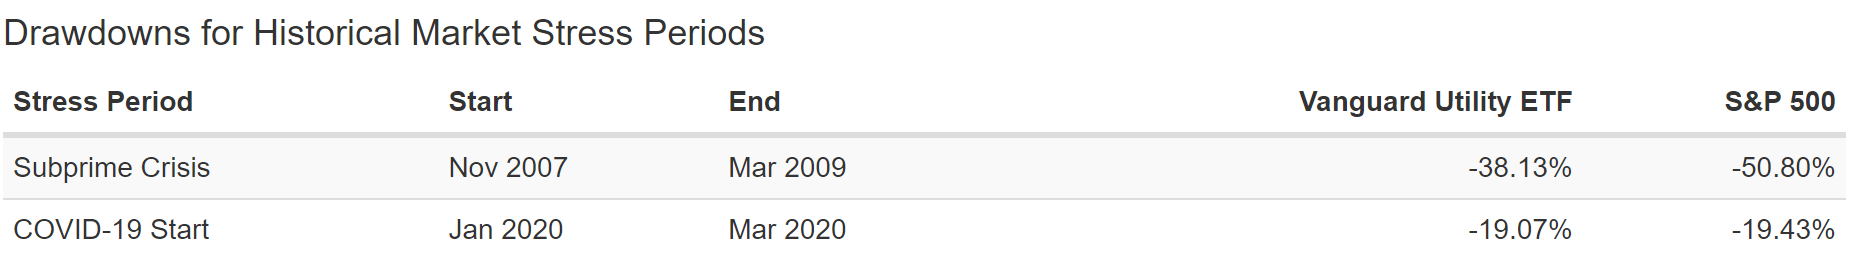
(Source: Portfolio Visualizer Premium)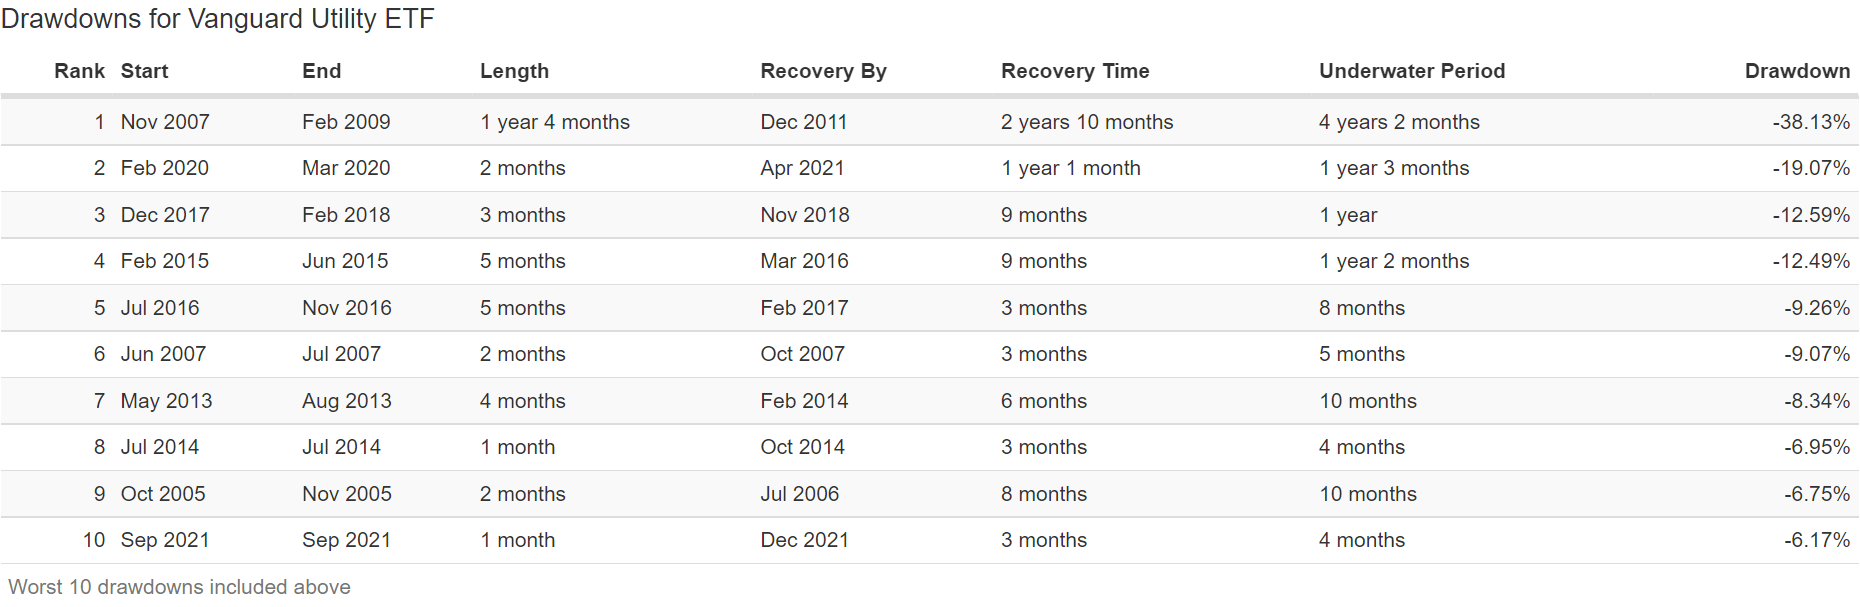
VPU is down 2% this year vs -19% for the S&P 500. In most downturns, utilities are defensive though they weren’t in the Pandemic.
(Source: Portfolio Visualizer Premium)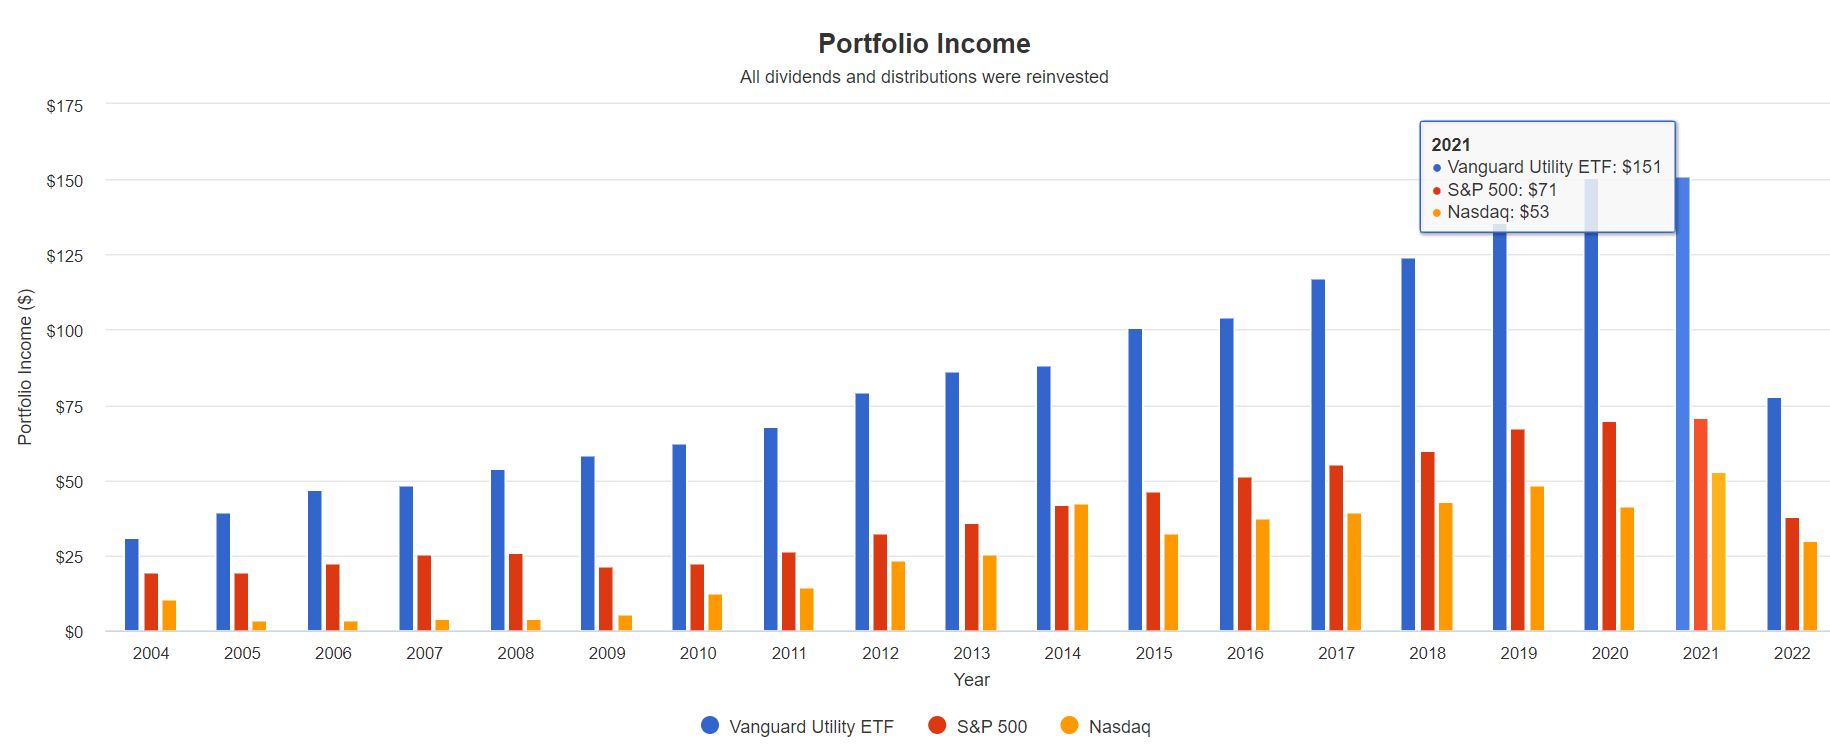
VPU has never experienced an annual decline in annual dividends, though in 2021 it did experience a freeze.
| Portfolio | 2005 Income Per $1,000 Investment | 2021 Income Per $1,000 Investment | Annual Income Growth | Starting Yield | 2021 Yield On Cost |
| S&P 500 | $19 | $71 | 8.59% | 1.9% | 7.1% |
| Nasdaq | $4 | $53 | 17.53% | 0.4% | 5.3% |
| Vanguard Utilities ETF | $40 | $151 | 8.66% | 4.0% | 15.1% |
(Source: Portfolio Visualizer Premium)
VPU managed to deliver the same dividend growth rate as the S&P 500 but with a much higher yield.
| Analyst Consensus Income Growth Forecast | Risk-Adjusted Expected Income Growth | Risk And Tax-Adjusted Expected Income Growth |
Risk, Inflation, And Tax Adjusted Income Growth Consensus |
| 8.1% | 5.7% | 4.8% | 2.3% |
(Source: DK Research Terminal, FactSet, Morningstar)
Morningstar’s analysts expect similar growth in the future which translates into 2.3% real expected income growth.
- slightly better than the S&P 500
- almost 5X better than a 60/40
Stress Testing The Future (Only For ETFs With 10+ Year Histories, Multiple Market Cycles)
Historical backtesting is great but we need to know what kind of returns and volatility are likely in the future.
- In the last 15-23 years, we’ve suffered 2 of the worst economic catastrophes since the Great Depression
- 3 major bear markets
- including the 2nd worst market crash in US history
- inflation ranging from -2.5% to 8.6%
- interest rates ranging from 0.3% to 6.5%
In other words, the last two decades were so extreme, that it creates a good statistical data source for stress testing for the next 75 years.
- barring recessions and bear markets worse than the Great Recession or Pandemic this analysis is likely to be highly accurate
Here I’m stress testing every ETF with a 10+ year track record.
- 90% statistical significance with that time frame
75-Year Monte Carlo Simulation: Stress Testing Your Optimized Portfolio
- 5,000 simulations
- post-tax earnings (highest tax bracket) for conservatism
- 4% withdrawals- (though can test various withdrawal rates)
- you can also stress test what happens if we get a lost decade at the start of the 75-year period
- starting value $510K average retired couples savings
iShares U.S. Consumer Staples ETF
(Source: Portfolio Visualizer Premium)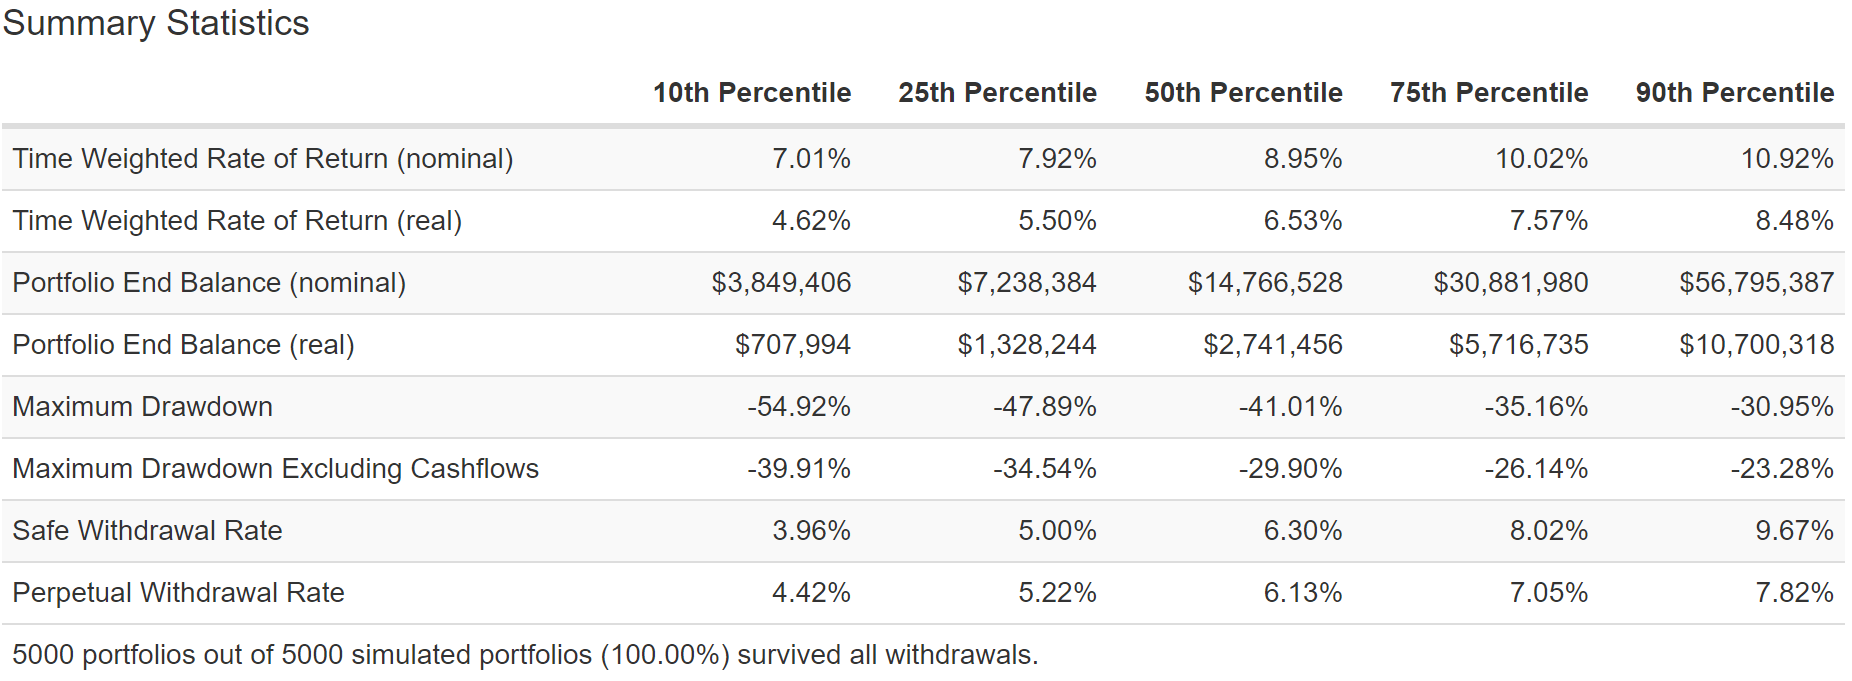
IYK is 80% likely to deliver 4.6% to 8.5% inflation-adjusted returns and suffer a 23% to 40% bear market sometime in the next 75 years.
Vanguard Healthcare ETF
(Source: Portfolio Visualizer Premium)
VHT is 80% likely to deliver between 6.7% and 10.8% long-term inflation-adjusted returns and suffer a 24% to 40% bear market sometime in the next 75 years.
Vanguard Utilities ETF
(Source: Portfolio Visualizer Premium)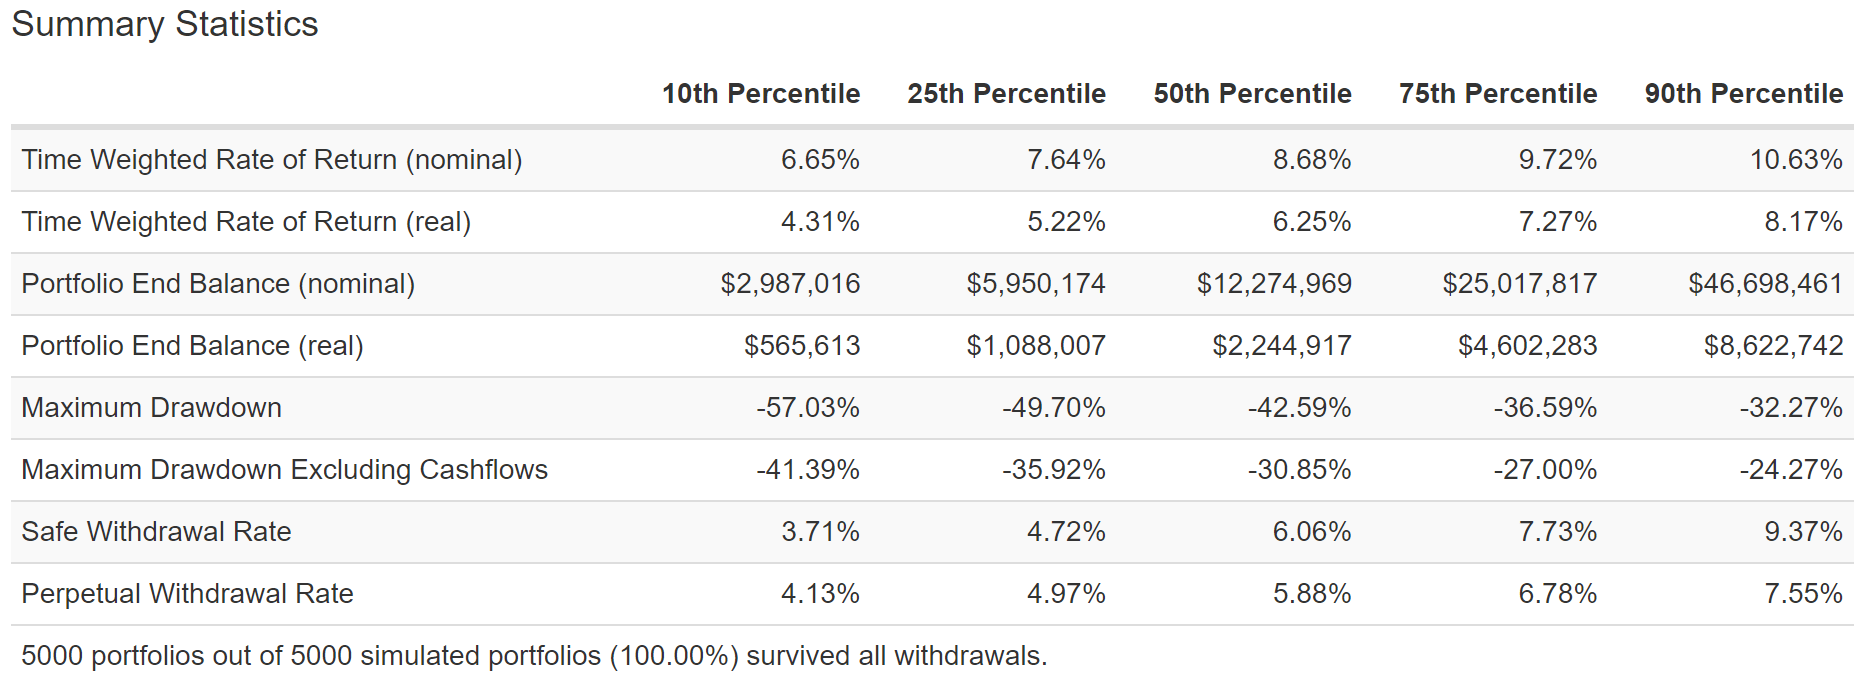
VPU is 80% likely to deliver 4.3% to 8.2% inflation-adjusted returns and suffer a 24% to 42% bear market sometime in the next 75 years.
75-Year Monte Carlo Simulation: Great Depression 2.0 Worst-Case Scenario
This isn’t just a stress test, it’s a doomsday scenario tester for any portfolio.
- not just a lost decade for stocks
- literally the worst years of returns over 75 years…packed together, back to back, in the first 10 years
This is equivalent to another Great Depression.
- Goldman Sachs puts the probability of this scenario (triggered by nuclear war with Russia) at approximately 2.5%
- the worst-case scenario is the 10th percentile of this scenario
- 0.25% probability
- 1 in 400 chance event
S&P 500 Great Depression 2.0 Worst-Case Scenario
(Source: Portfolio Visualizer Premium)
Nasdaq Great Depression 2.0 Worst-Case Scenario
(Source: Portfolio Visualizer Premium)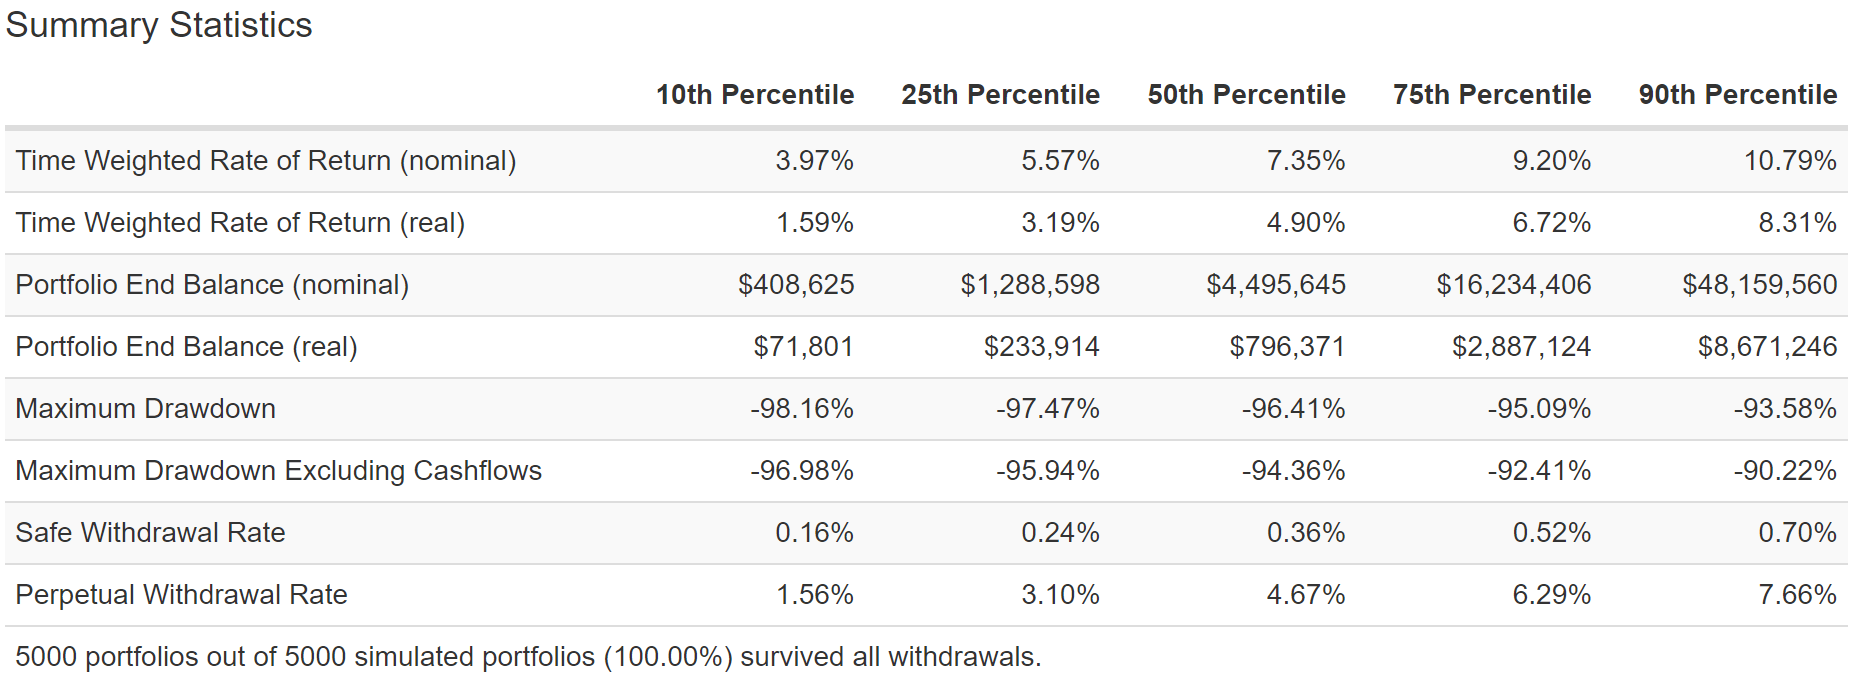
In the worst-case scenario, of another Great Depression, there is a 10% chance that the S&P 500 falls as much as 81%.
The Nasdaq could crash as much as 97%.
- not actually likely but even if it did happen zero portfolio failures even in this ultimate-worst case scenario
60/40 Great Depression 2.0 Worst-Case Scenario
(Source: Portfolio Visualizer Premium)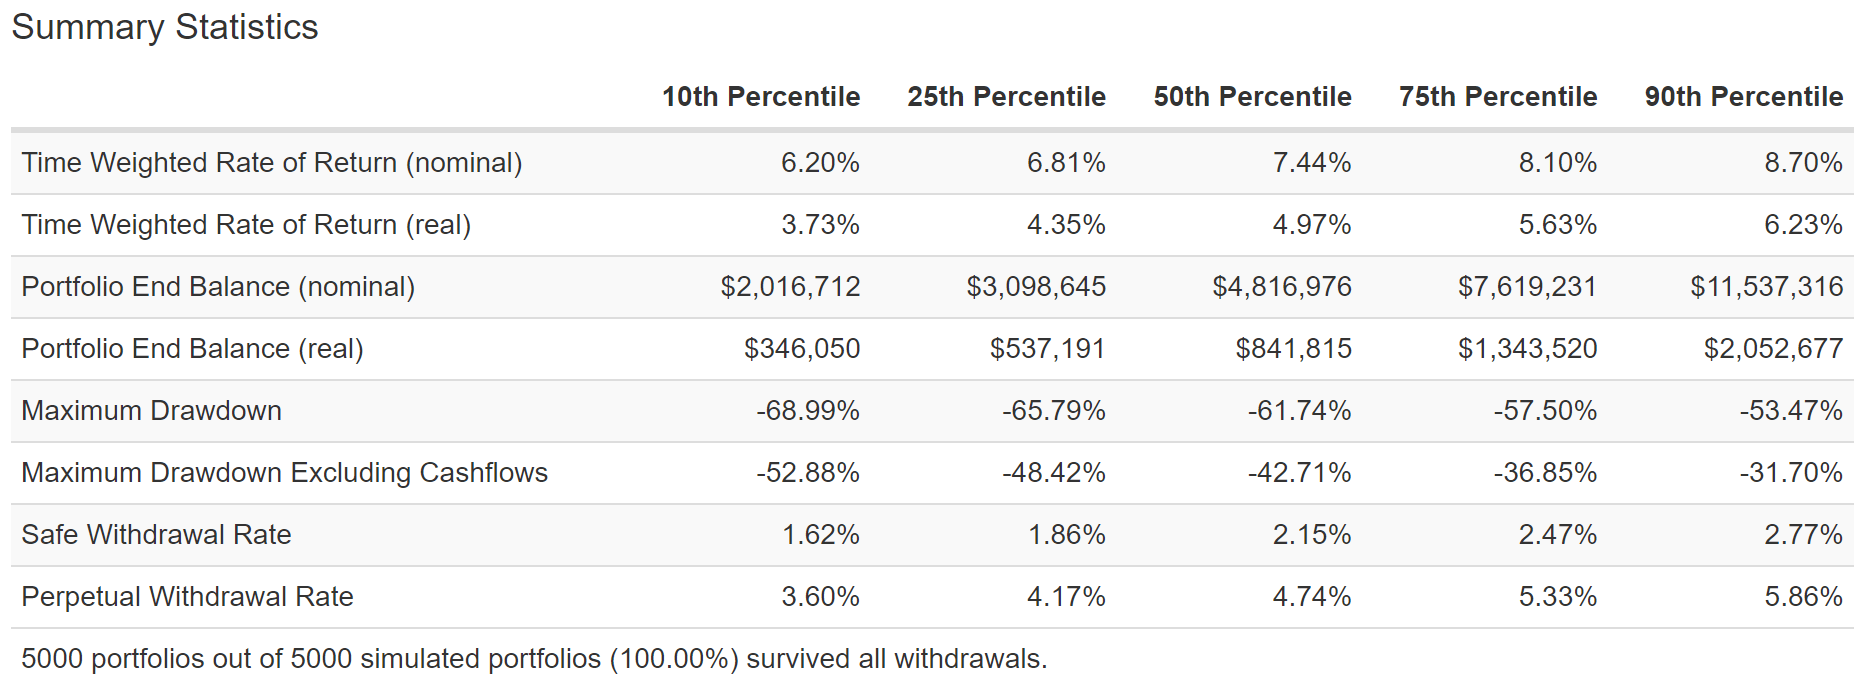
A 60/40, worst-case, during another Great Depression, has a 10% probability of falling 53%.
- compared to an 81% decline in the S&P 500
- and 97% decline in the Nasdaq
How about these sector ETFs?
iShares U.S. Consumer Staples ETF
(Source: Portfolio Visualizer Premium)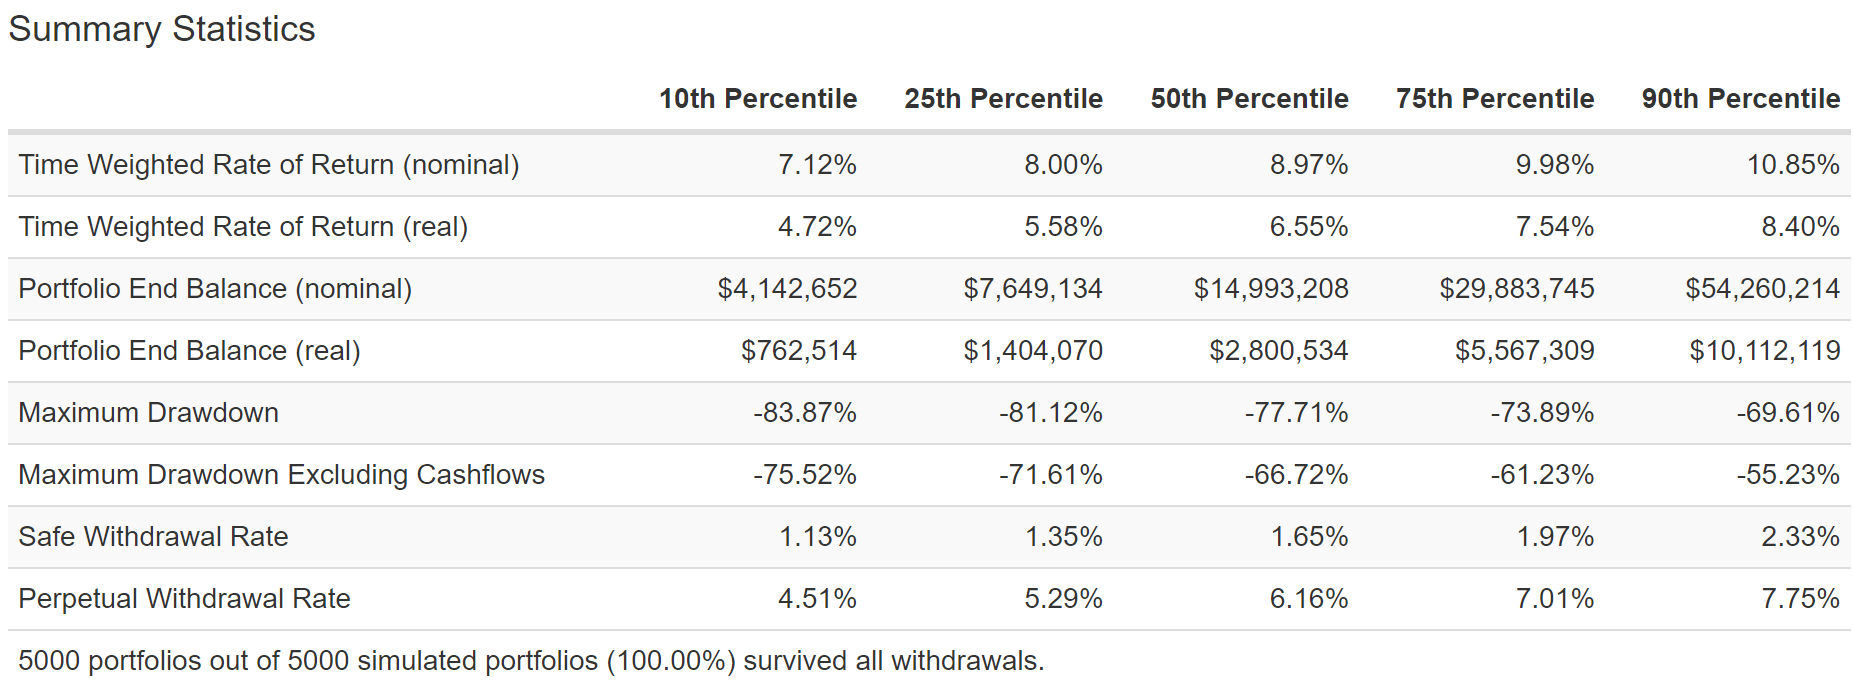
Even in a stock market crash worse than John Hussman has ever forecast, IYK’s peak decline of 76% is less than the 81% decline in the S&P 500 and it survives.
Vanguard Healthcare ETF
(Source: Portfolio Visualizer Premium)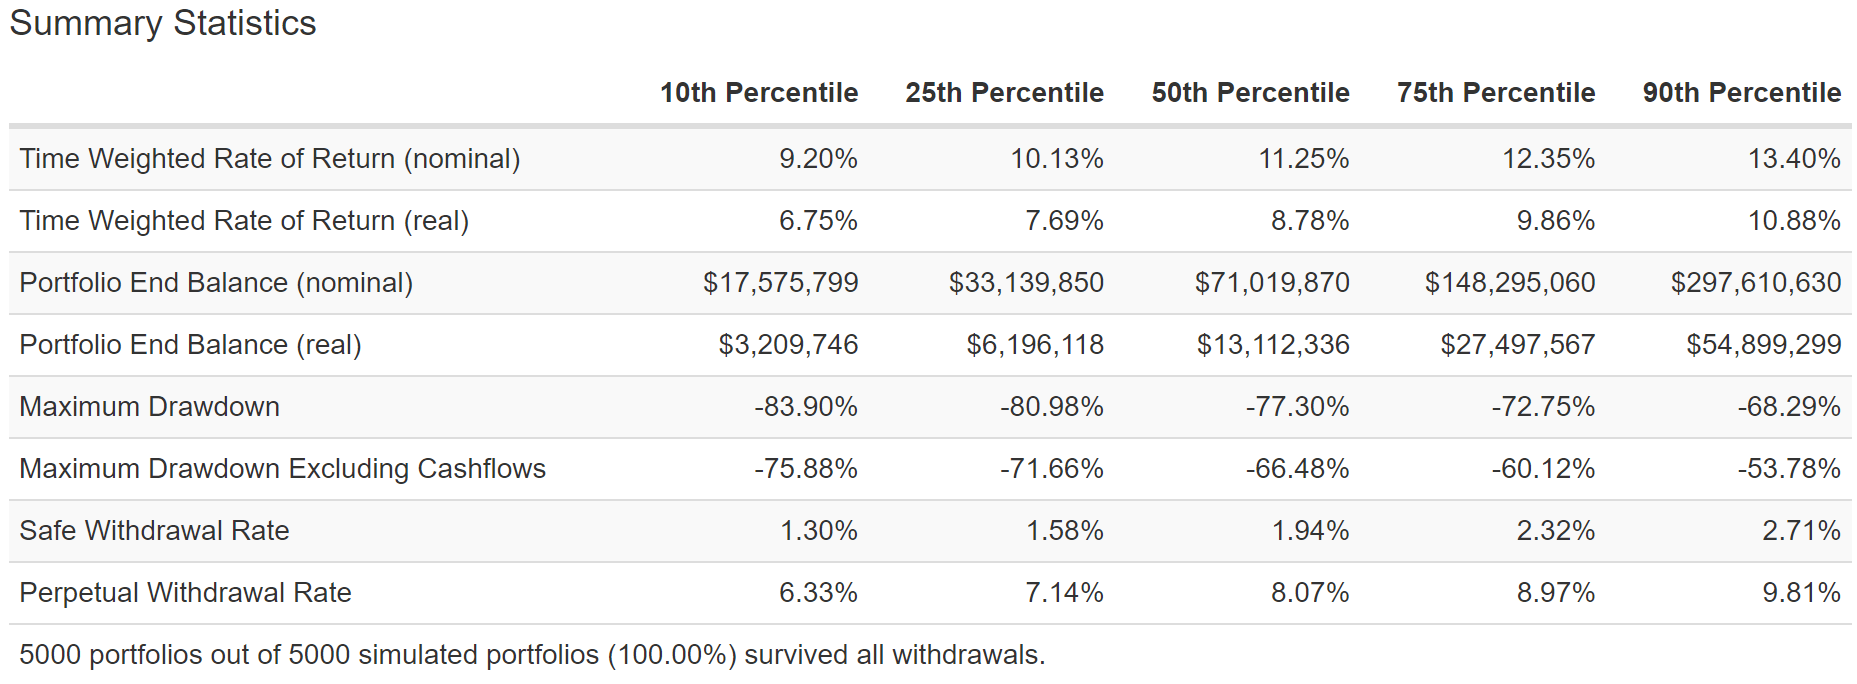
Even in the worst-case scenario VHT also acts somewhat defensive vs the S&P 500 and survives, with a minimum safe withdrawal rate 30% higher than the broader market.
Vanguard Utilities ETF
(Source: Portfolio Visualizer Premium)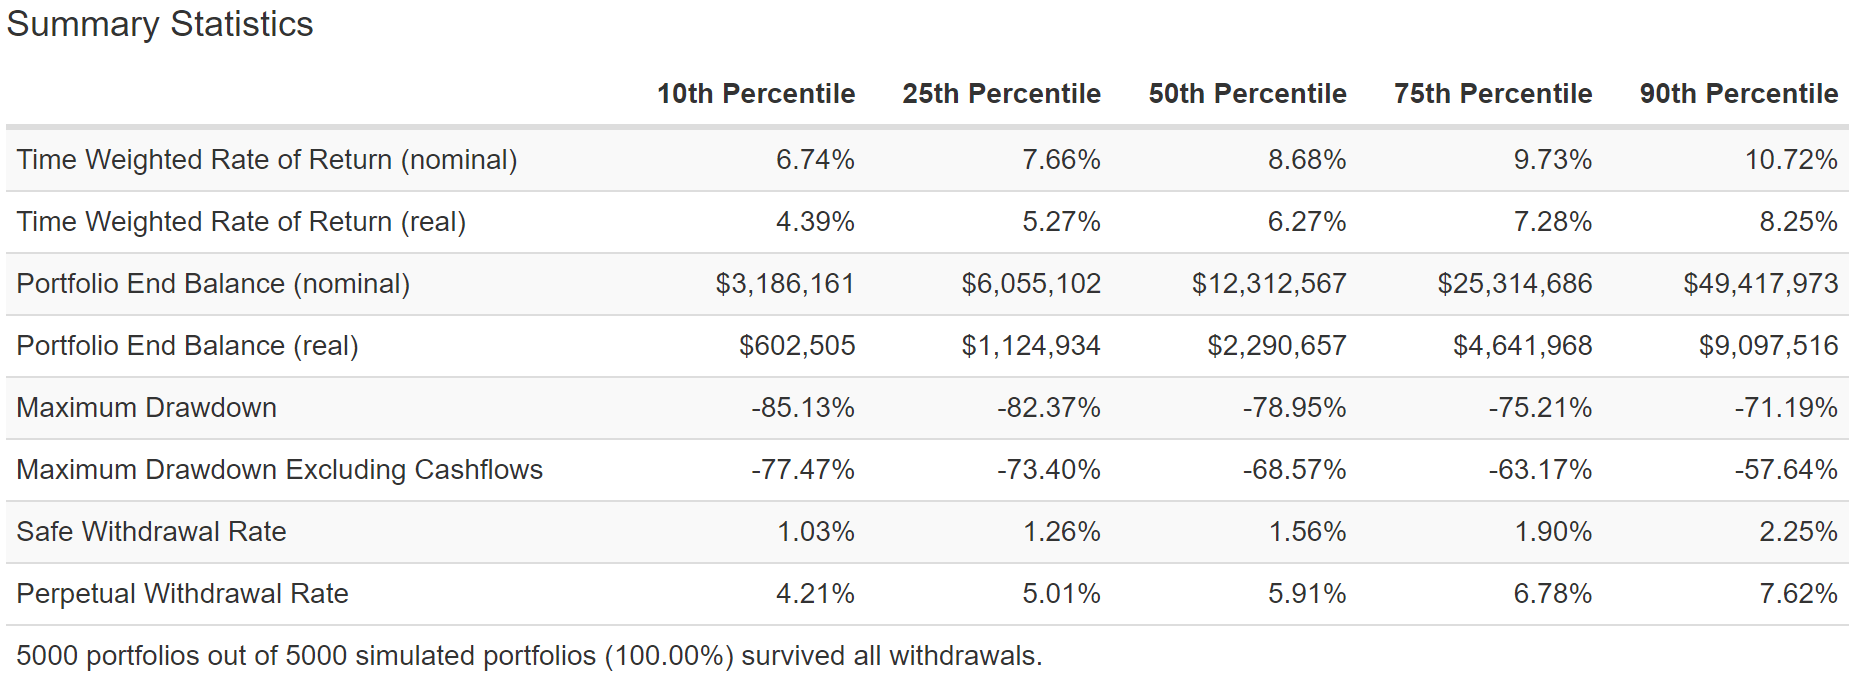
Even in the worst-case scenario, VPU manages to fall less than the S&P 500 and never once goes to zero, even with a 4% withdrawal rate.
Bottom Line: If you own a diversified blue-chip portfolio (which most ETFs represent) the chance of total failure even in a doomsday scenario is so close to zero you don’t have to worry about them.
- as long as the global economy survives stocks will go up over the long-term
- and if it doesn’t we’ll likely to be too dead to care
How To Use These Defensive ETFs To Construct The Ultimate Sleep Well At Night Retirement Portfolio
What if you want a high-yielding portfolio, that offers safe and growing income, with great long-term returns and very low volatility in even the most extreme market downturns? Then the Zen Extraordinary Ultra SWAN or Z.E.U.S strategy might be just what you’re after.
The ZEUS structure is:
- 33% stocks ETFs
- 33% cash and bonds (long-term recession optimized)
- 33% individual blue-chips
Let me show you how combining these three kinds of assets can help you potentially achieve the portfolio of your dreams.
Consider the following low volatility portfolio that I’ll be exploring in more detail in the rest of this article.
- Vanguard High Dividend Yield ETF (VYM) 8.33%
- iShares U.S. Consumer Staples ETF (IYK) 8.33%
- Vanguard Health Care ETF (VHT) 8.33%
- Vanguard Utilities ETF (VPU) 8.33%
- Vanguard Extended Duration Treasury ETF (EDV) 28.33%
- Vanguard Short-Term Treasury ETF (VGSH) – cash – 5%
- Enbridge (ENB): 11.11%
- British American Tobacco (BTI): 11.11%
- Altria (MO): 11.11%
I’ve linked to articles about each of the above ETFs and companies for anyone interested in learning more about them.
This ZEUS High-Yield/Low Volatility portfolio has almost 3X the yield of a 60/40 and analysts expect almost 3% stronger long-term returns to deliver 2% higher safe withdrawal rates.
(Source: Portfolio Visualizer Premium)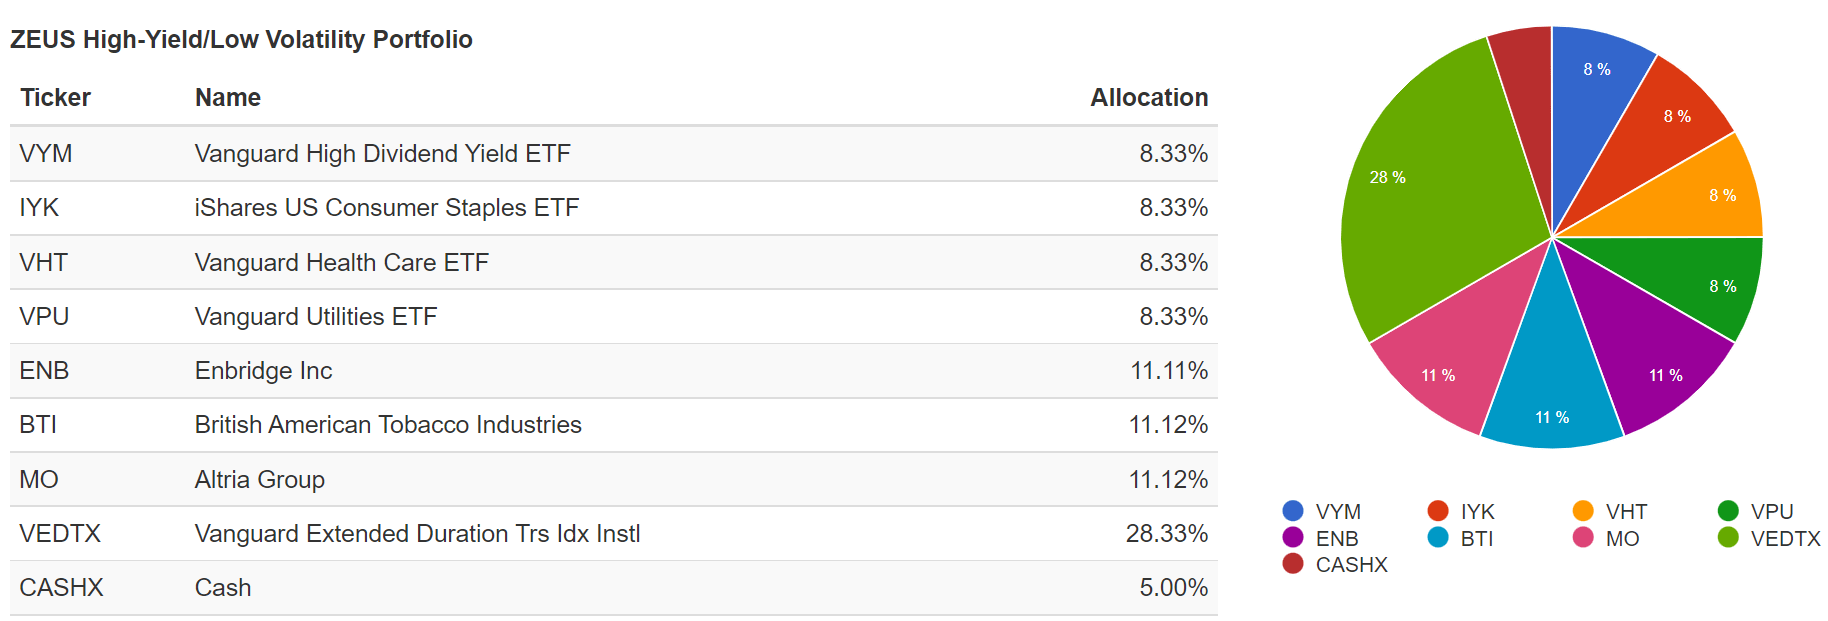
Why is this portfolio so amazing? Take a look at its fundamentals.
| Metric | 60/40 | ZEUS High-Yield/Low Volatility |
| Yield | 1.6% | 4.3% |
| Growth Consensus | 5.1% | 5.2% |
| LT Consensus Total Return | 6.7% | 9.5% |
| Risk-Adjusted Expected Return | 4.7% | 6.7% |
| Safe Withdrawal Rate (Risk And Inflation-Adjusted Returns) | 2.2% | 4.2% |
(Source: DK Research Terminal, FactSet, Morningstar)
Almost 3X the yield of a 60/40 portfolio, and with potentially 3% higher long-term returns and double the safe withdrawal rate.
Inflation-Adjusted Consensus Total Return Potential: $510K Average Retired Couple Savings
| Time Frame (Years) | 4.2% CAGR Inflation-Adjusted 60/40 | 7.0% Inflation-Adjusted ZEUS High-Yield/Low Volatility Portfolio Consensus | Difference Between ZEUS High-Yield/Low Volatility Portfolio Consensus and 60/40 |
| 5 | $627,455.04 | $716,394.11 | $88,939.06 |
| 10 | $771,503.60 | $1,005,719.19 | $234,215.59 |
| 15 | $948,622.24 | $1,411,891.98 | $463,269.73 |
| 20 | $1,166,403.05 | $1,982,102.93 | $815,699.88 |
| 25 | $1,434,181.09 | $2,782,601.00 | $1,348,419.91 |
| 30 | $1,763,434.51 | $3,906,390.63 | $2,142,956.12 |
(Source: DK Research Terminal, FactSet, Morningstar)
Analysts expect a 60/40 to deliver turn $510K into about $1.8 million, adjusted for inflation, over the next 30 years.
They expect the ZEUS HYLV portfolio to deliver over $2 million better real returns.
| Time Frame (Years) |
Ratio ZEUS High-Yield/Low Volatility Portfolio and 60/40 Vs 60/40 |
| 5 | 1.14 |
| 10 | 1.30 |
| 15 | 1.49 |
| 20 | 1.70 |
| 25 | 1.94 |
| 30 | 2.22 |
(Source: DK Research Terminal, FactSet, Morningstar)
More than double the returns of a 60/40? Yes, please I’ll have some of that.
What evidence do we have that this ZEUS portfolio can actually deliver around 9.5% long-term returns?
Historical Returns Since December 2007 (Annual Rebalancing)
(Source: Portfolio Visualizer Premium)
Over the last 15 years, ZEUS HYLV beat the S&P 500 but with just 10% annual volatility, 38% less than the broader market.
- Its volatility matched that of a 60/40
- but with a peak decline of just 15% vs 31%
- half the declines of a 60/40 and less than 1/3 that of the S&P 500
And look at how ZEUS HYLV’s negative volatility-adjusted total returns (Sortino ratio) compare:
- 71% better than the S&P 500
- 57% better than a 60/40
- 26% better than the Nasdaq in one of the best tech bull markets in history
(Source: Portfolio Visualizer Premium)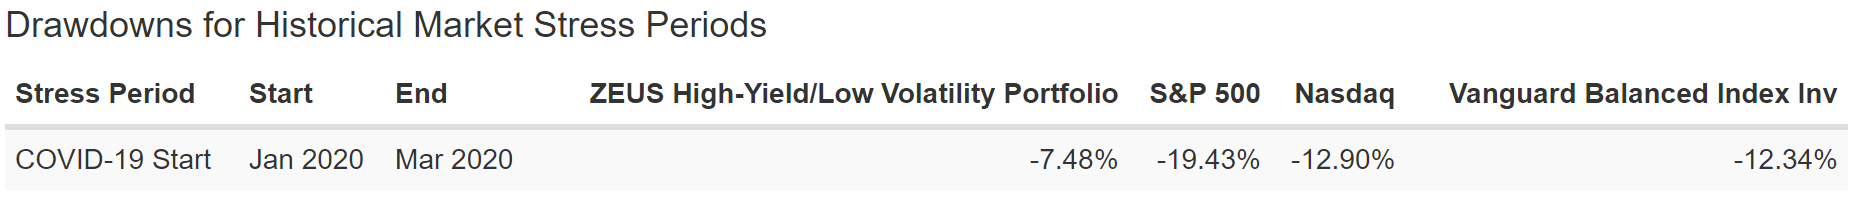
During the Pandemic, the market fell 20% in March 2020, the Nasdaq 13%, a 60/40 12%, and ZEUS HYLV just 7.5%.
(Source: Portfolio Visualizer Premium)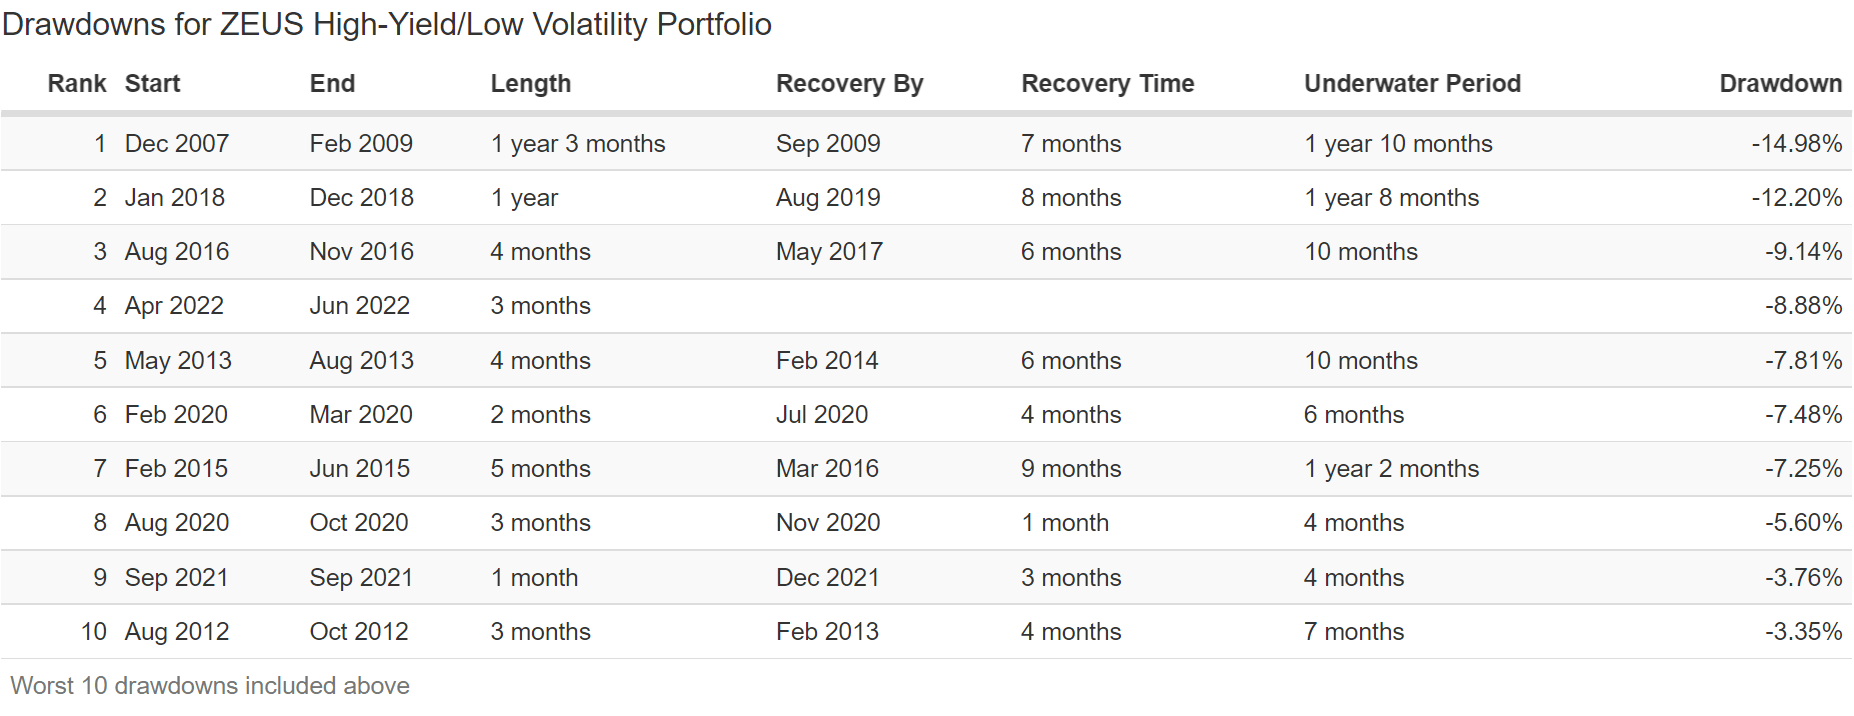
During the 2nd worst market crash in US history, ZEUS HYLV fell 15%, not even a bear market.
In this bear market, despite the worst bond bear market in history, and energy and tobacco recently falling off a cliff, it’s down 9%.
- 60/40 -17%
- S&P 500 -19%
- Nasdaq -29%
Stress Testing The Future: 75-Year Monte Carlo Simulation
(Source: Portfolio Visualizer Premium)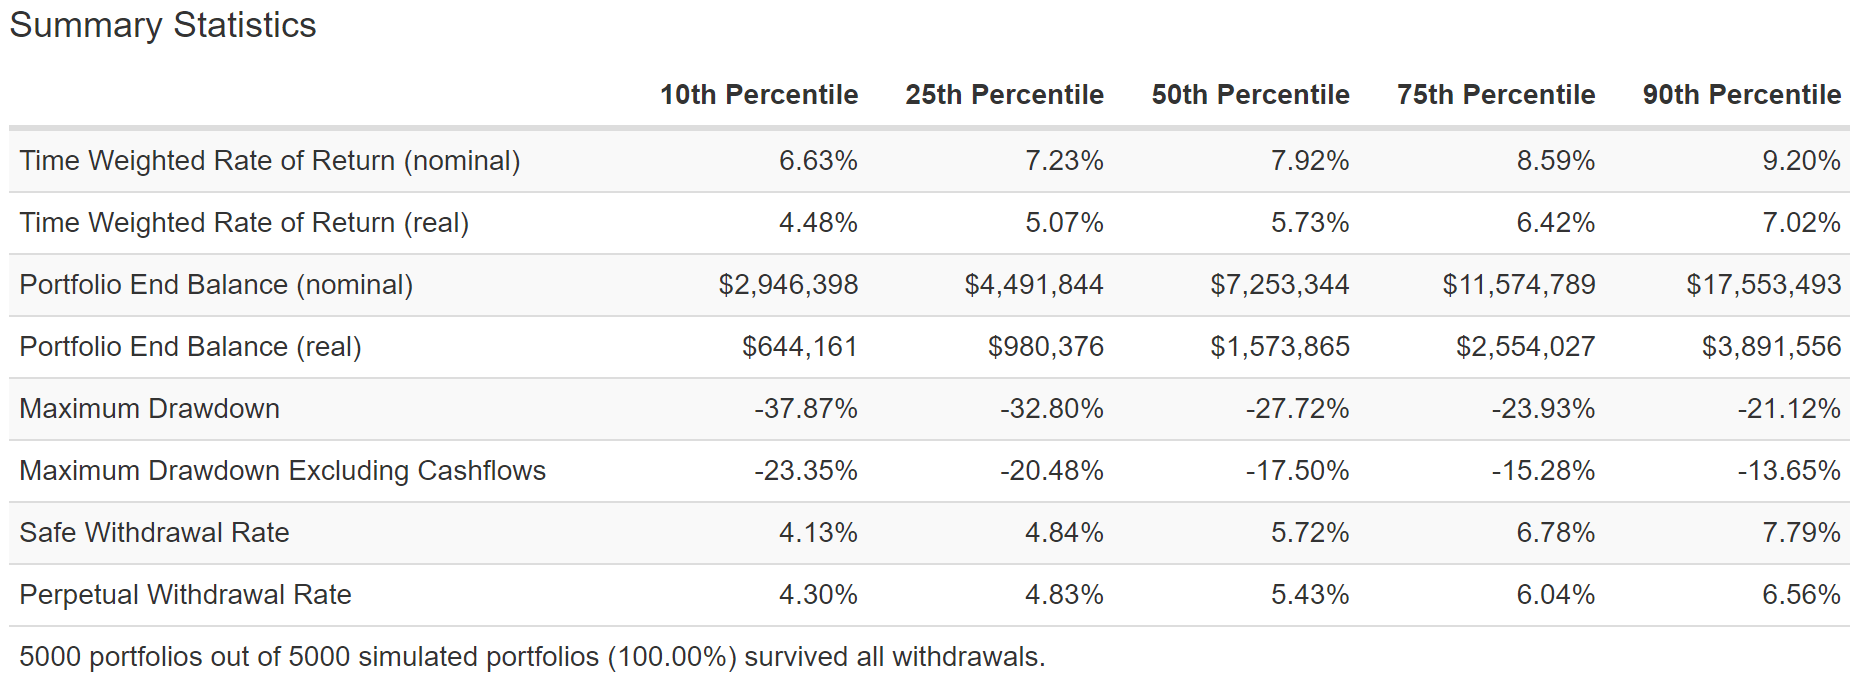
Over the next 75 years, there is an 80% statistical probability that this portfolio suffers a 14% to 23% peak decline (not counting withdrawals).
The base case is a 17.5% decline at some point, which isn’t even a bear market.
The safe withdrawal rate is 80% likely to be 4.1% to 7.8%, far above the 4.2% analysts expect.
And what about the doomsday scenario?
Stress Testing Great Depression 2.0: The Worst Economy In Us History
Remember that according to Goldman this scenario is a 1 in 400 chance event (assuming the war in Ukraine never ends).
- if it does the risk falls to less than 1 in 1,000
How does ZEUS High-Yield/Low Volatility likely perform in an economic catastrophe so extreme that not even legendary permabear John Hussman dares predict it?
(Source: Portfolio Visualizer Premium)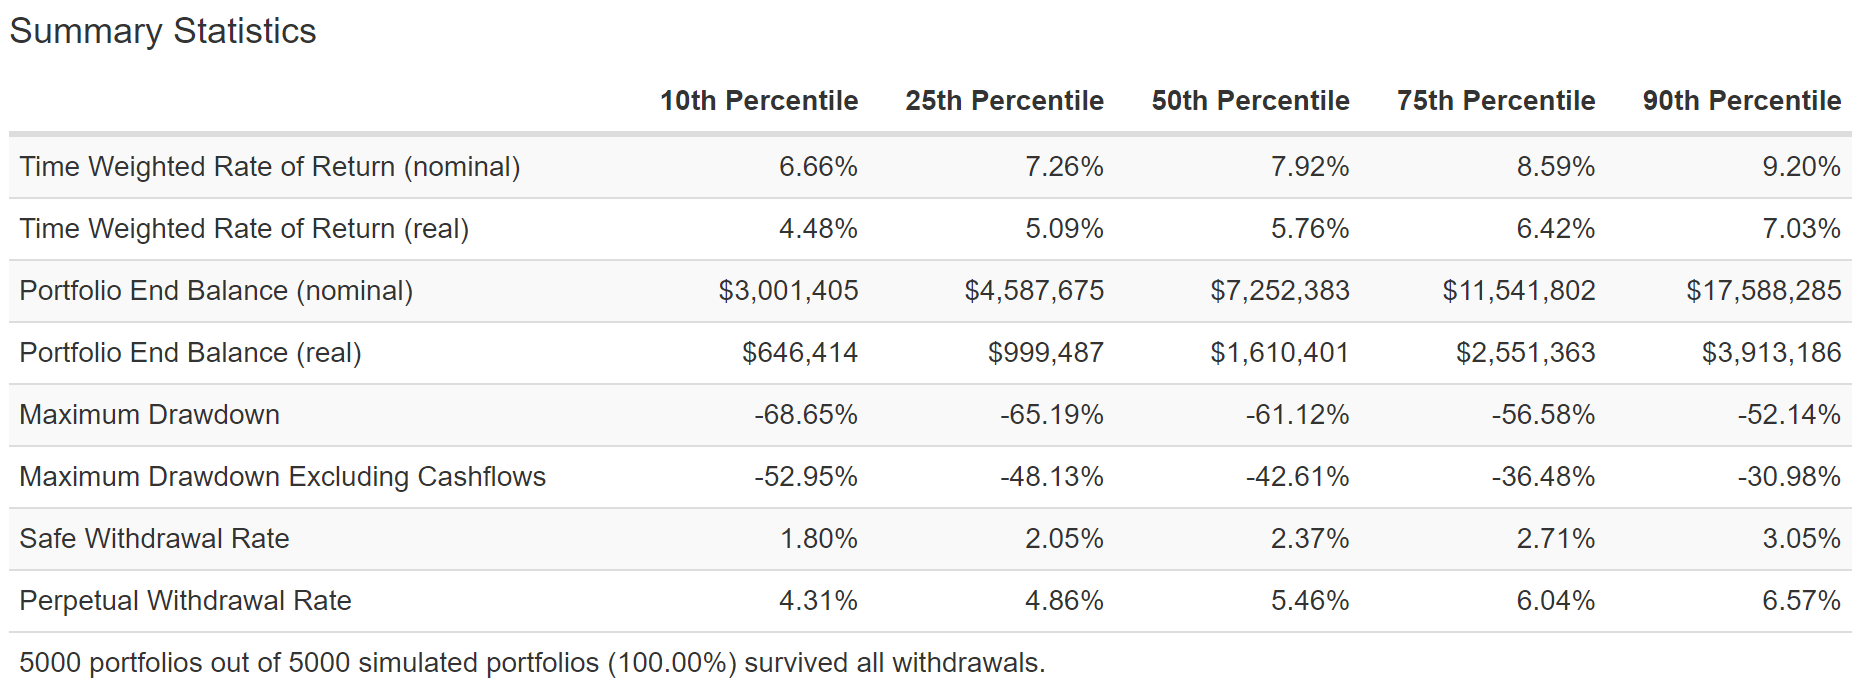
Even in this doomsday scenario, the peak decline is 53%, matching a 60/40. But note that the base case is a 43% peak decline, even if we experienced a 10-year severe recession on part with the Great Financial Crisis.
(Source: Portfolio Visualizer Premium)
Even in this doomsday scenario, the probability of earnings very solid 5+% returns (sufficient for a 3% annual withdrawal rate) is 82% over the next 40% years and 96% over the next 50 years.
And even with 4% annual withdrawals during this doomsday scenario, after 75 years the worst-case simulated inflation-adjusted portfolio balance is $646,000, 27% higher than when it started.
- the probability of this portfolio failing to survive for 75 years, even in a worst-case doomsday scenario is as close to zero as you can ever get on Wall Street
- without the literal apocalypse making all investing moot
What’s Actually Likely
Portfolio Visualizer Premium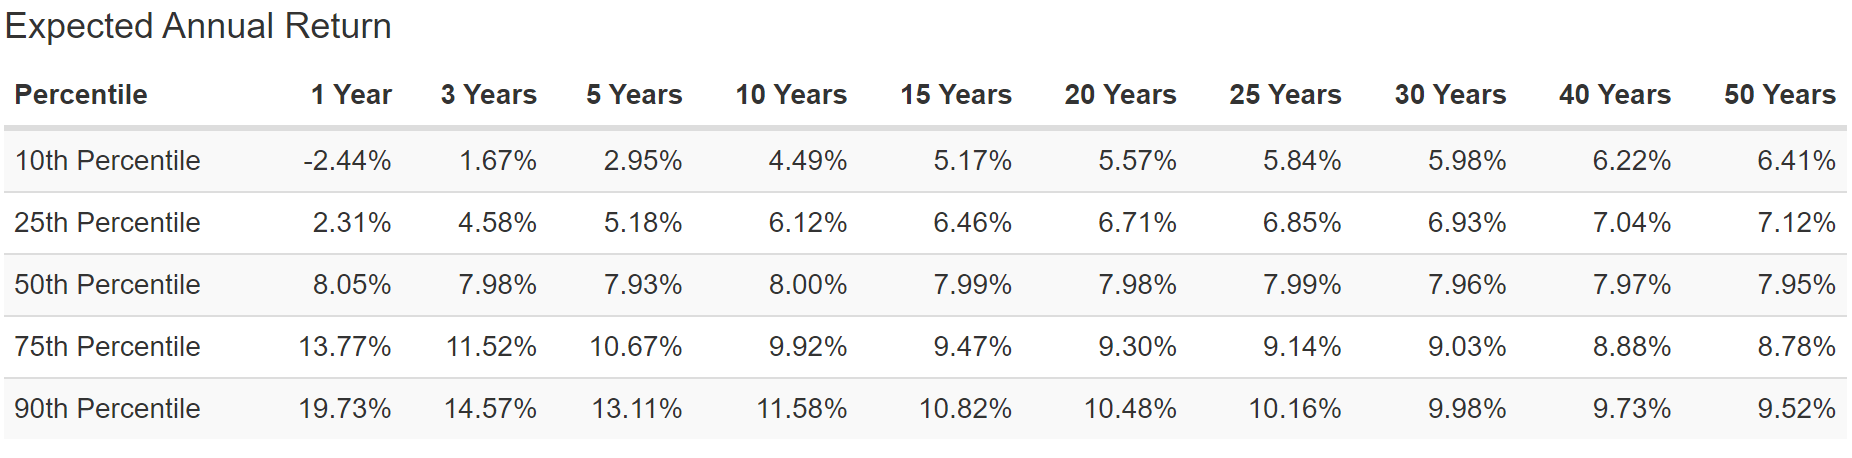
What kind of inflation-adjusted returns are required to fund a comfortable retirement? If you’re using a 4% withdrawal rate then 6.5% to adjust for long-term inflation. A 3% withdrawal rate, about 2X the safe level according to FactSet, requires a 5.5% annual return. What is the probability of this portfolio earning over 5% annual returns for the next 30 years?
Portfolio Visualizer Premium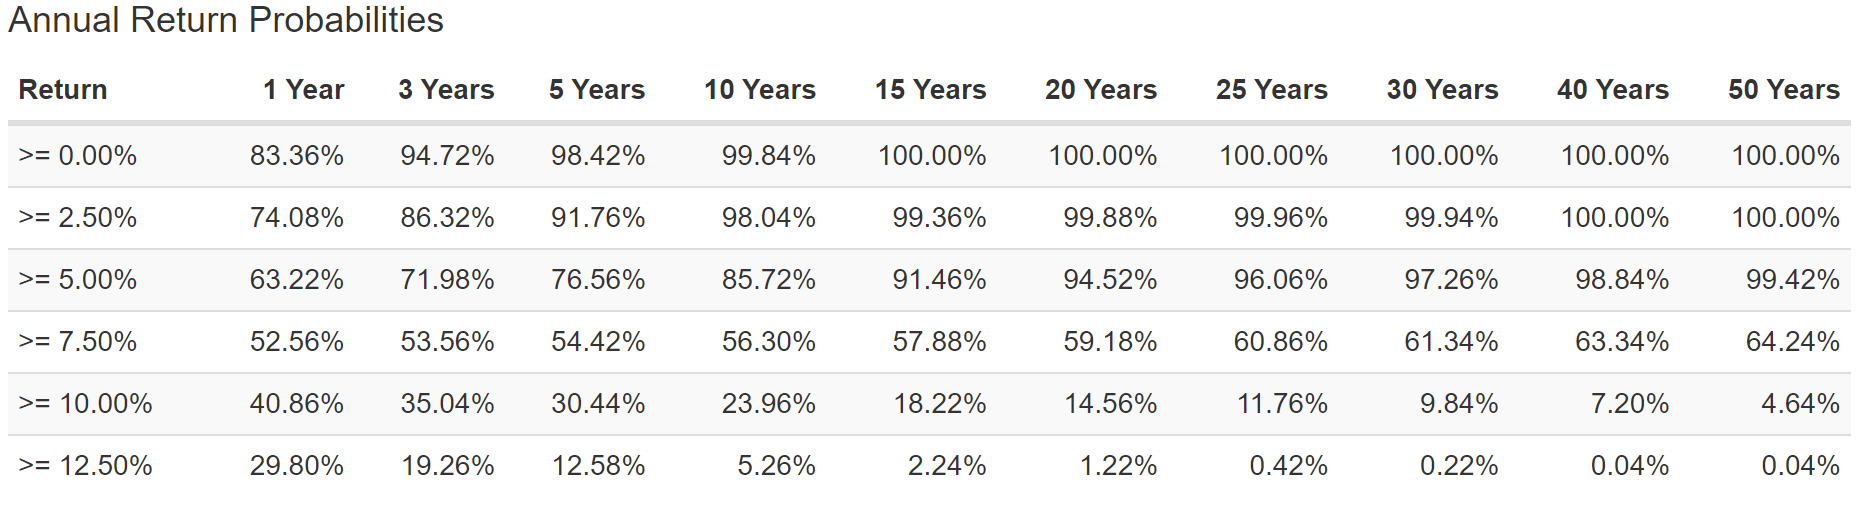
About 97%. Over the next 50 years? 99.4% What about the probability of earning 7.5% returns and thus allowing for a safe 5% withdrawal rate?
- 61% over the next 30 years
- 64% over the next 50 years
What about the probability of losses?
Portfolio Visualizer Premium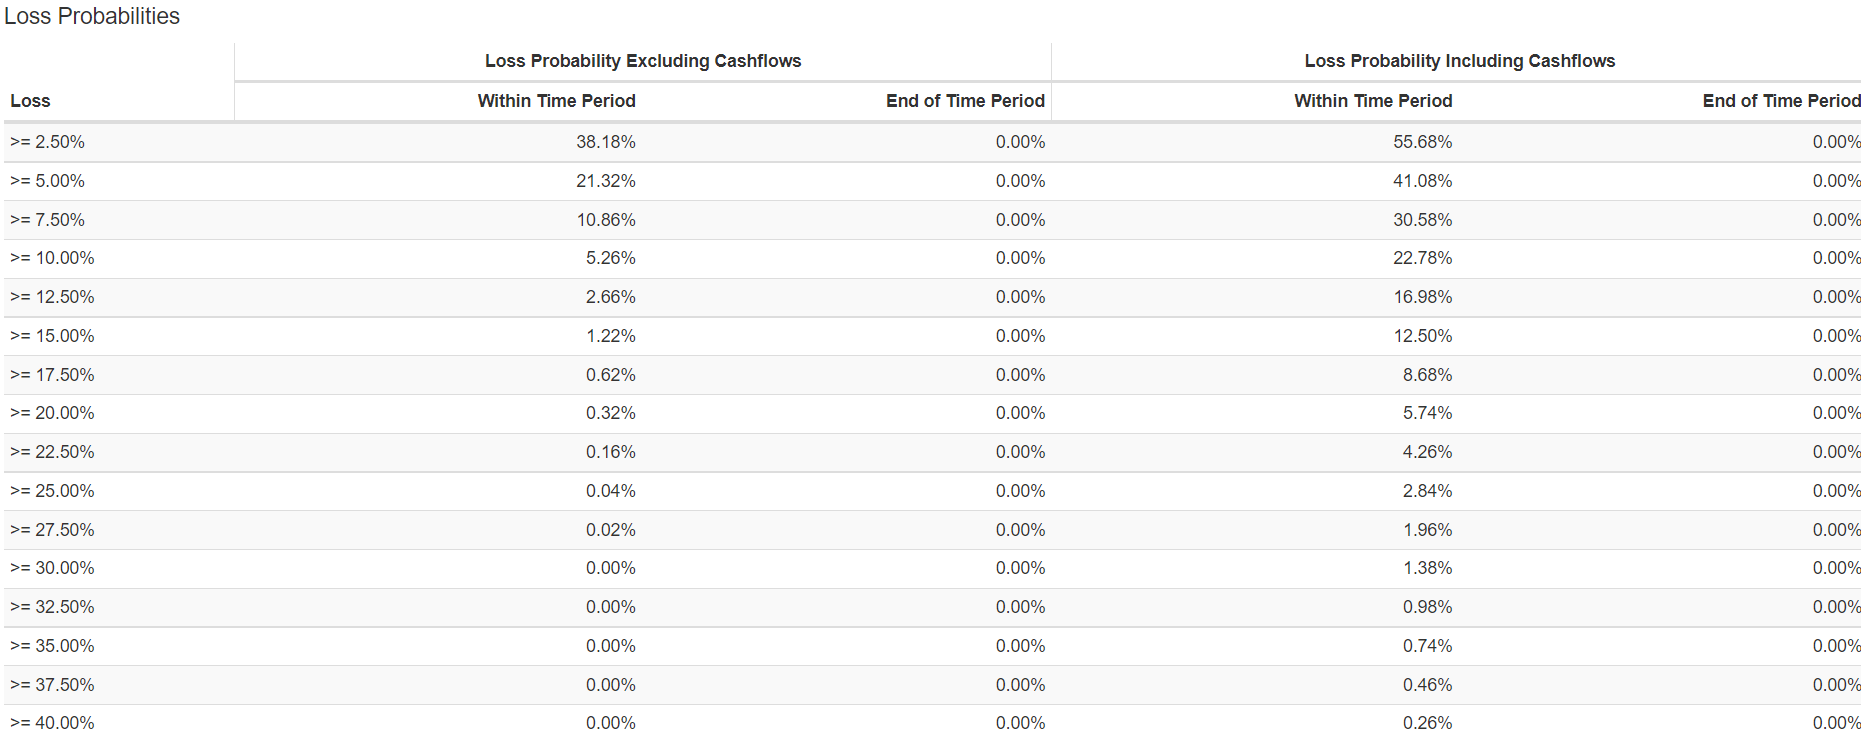
The probability of suffering a permanent loss is effectively zero, as is the probability of this portfolio ever falling 30% or more.
- the 60/40 fell 31% during the Great Recession
- this portfolio fell 15%
The statistical probability of a 20% bear market any time in the next 75 years? 0.32% or just 1 in 313, basically as likely as the doomsday scenario we modeled earlier.
Bottom Line: The Right ETFs Can Help You Build The Ultimate Sleep Well At Night Retirement Portfolio
Do we live in a scary world right now? You bet.
We face the highest inflation in 40 years, and JPMorgan, Nordea, and commodities futures markets think we’ll peak at 9.2% inflation around October.
Daily Shot 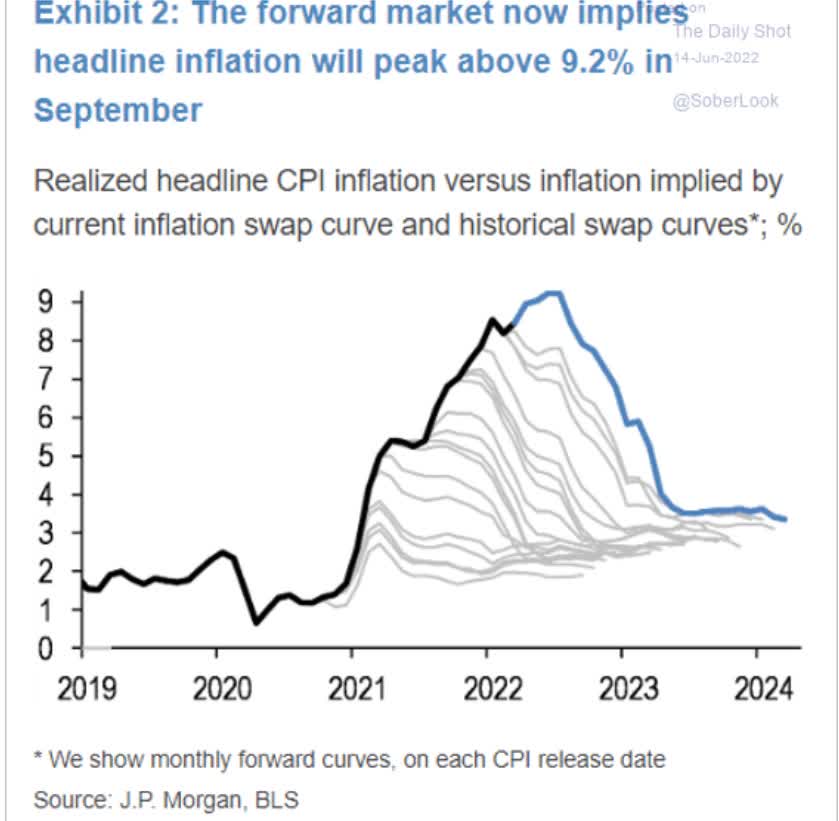
Meanwhile, in Europe, Russia is steadily putting the screws to our NATO allies.
Shell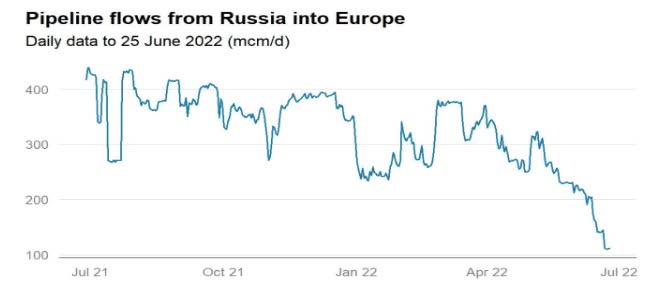
Natural gas exports to the EU are down about 75% in the last year and come winter Europe might literally be freezing.
- as well as rationing gas
- and shutting down numerous sectors of its economies
How bad is the EU energy crisis?
- German producer price inflation just hit a record 33.6%
- driven by a nearly 150% increase in natural gas prices
- and those prices are likely to keep rising if Russia keeps reducing its gas exports
EU inflation could soon surpass the 11% that the Bank of England thinks is coming in the coming months.
Some estimates of recession risk in Europe are at 90% and that estimate has been climbing by the month.
Meanwhile, in the US, where our energy and inflation situation is comparatively much better, we still might be facing a mild recession in 2023.
Deutsche Bank
Deutsche Bank is one of the 16 most accurate economist teams in the world according to MarketWatch which tracks economic forecasts.
And they expect -3.1% GDP growth in Q3 2023, and -0.4% in Q4, with positive growth resuming in 2024.
- -0.5% GDP growth next year
- the 2nd mildest recession in US history
- behind -0.4% growth in 2001
But even with this relatively optimistic “hard landing” forecast, Deutsche Bank expects US stocks to bottom around -40%, 3,000 on the S&P.
- Morgan Stanley, Bridgewater, Bank of America, UBS, and Soc Gen all agree
Think about how weird this economy and market are today. The 2nd mildest recession in history AND we might still experience the 3rd 40+% crash in 25 years.
But as I’ve explained earlier, market timing is the worst mistake you can make. So how on earth can a sane investor stay safe and remain on track to retire in safety and splendor?
By harnessing the incredible power of low volatility dividend ETFs like IYK, VHT, and VPU.
When combined with the hedging power of cash and bonds, as well as low volatility, high-yield Ultra SWAN dividend aristocrats ENB, BTI, and MO, you create a ZEUS High-Yield/Low Volatility retirement portfolio that:
- yields a very safe 4.2% vs 1.6% for a 60/40
- is expected to deliver 9.5% long-term returns vs 6.7% for a 60/40
- delivered 9.2% annual returns since 2007 vs 6.6% 60/40 and 8.8% S&P 500
- could potentially help the average retired couple earn an extra $2.1 million in inflation-adjusted wealth compared to a 60/40
- turn $510K in average retirement savings into $4 million after 30 years
- deliver a safe withdrawal rate of 4.2% vs 2.2% for a 60/40
- fell 8% in the pandemic crash vs 12% for a 60/40
- fell 15% in the Great Recession vs 31% for a 60/40
- is down 9% in the 2022 bear market vs -17% for a 60/40
- 10% long-term annual volatility (equal to a 60/40) and 40% less than the S&P 500
- 0.32% chance of experiencing a 20+% bear market in the next 75 years
- 97% likely to deliver 5+% returns over the next 30 years
- 99.4% likely to deliver 5+% returns over the next 50 years
Higher and safer yield, better returns, lower long-term volatility, AND half the declines of a 60/40 in every bear market since 2007?
- 1/3 the peak declines of the S&P 500
This portfolio built entirely of blue-chip Ultra SWANs and blue-chip ETFs is 97% likely to deliver a comfortable or even rich retirement over the next 30 years, and 99.4% likely over the next 50 years.
Or to put it another way, if your savings were invested in this ZEUS High-Yield/Low Volatility portfolio, you have essentially nothing to worry about from any of the scary risks we face today.
Because remember we’ve stress-tested against a doomsday scenario that includes a worse economy than the Great Depression, lasting a full decade and causing an 81% market crash.
This is the essence of sleep well at night long-term income investing. If you know with 90+% statistical confidence that you are going to retire in safety and splendor, then nothing the market does in the short-term will scare you into making a costly mistake.
If you know your hard-earned money is working even harder for you, protected by the some of the world’s best companies, with the strongest balance sheets, and the full faith and credit of the United States, you can truly achieve the zen of smart investing in scary markets.
And that, my friends, is how you stop praying for luck on Wall Street and start making your own.
“Luck is what happens when preparation meets opportunity.” – Seneca the Younger
Be the first to comment