

Feverpitched/iStock via Getty Images
Over the past few months, I’ve recommended buying three homebuilders on Seeking Alpha – PulteGroup (NYSE:PHM), M/I Homes (NYSE:MHO) and Hovnanian Enterprises (NYSE:HOV). Investors continue to have remarkably little faith in the earnings capacity of these companies:
- Let’s start with Pulte. Wall Street analysts, per Seeking Alpha, expect this $52 stock to earn $9.19 per share in 2022. That’s a paltry 5.6 P/E ratio, or a sad 30% of the market multiple.
- M/I Homes? This $51 stock is expected to earn $14.16 a share, for an even more paltry 3.6 P/E, and an even sadder 20% of the market multiple.
- Hovnanian? I blush as I write this. This $97 stock has no Wall Street coverage (interesting, right?), but the company gave a 2022 forecast in its fiscal Q4 earnings release whose midpoint is $29.25 per share. That’s a 3.3 multiple. Might be the NYSE’s lowest multiple.
These stunning P/E ratios obviously say that investors expect very bad things to happen to homebuilder earnings – sharp and sustained declines, possible bankruptcy risk, etc. If Hovnanian’s EPS this year is only half its forecast, or $15, that’s still only a 6.5 P/E, or a 15% earnings yield (E/P). I bet you would be OK with a 15% yield. The market is therefore implying a far worse outcome than a 50% EPS decline.
Is that fear realistic? To see, in this report I’ll present to you:
- The 2022 outlook
- The longer-term supply/demand story
- A liquidation valuation
Spoiler alert – Pulte, M/I and Hovnanian are seriously cheap. 50%+ upsides are reasonable.
The 2022 outlook – the backlog tells the tale
A homebuilder’s backlog is an excellent forecaster of year-ahead homes closed and therefore revenues. For example, over the past decade, Pulte’s beginning of the year backlog explained 90% of that year’s sales. So pay careful attention to this chart, which shows combined backlog history of the three builders:
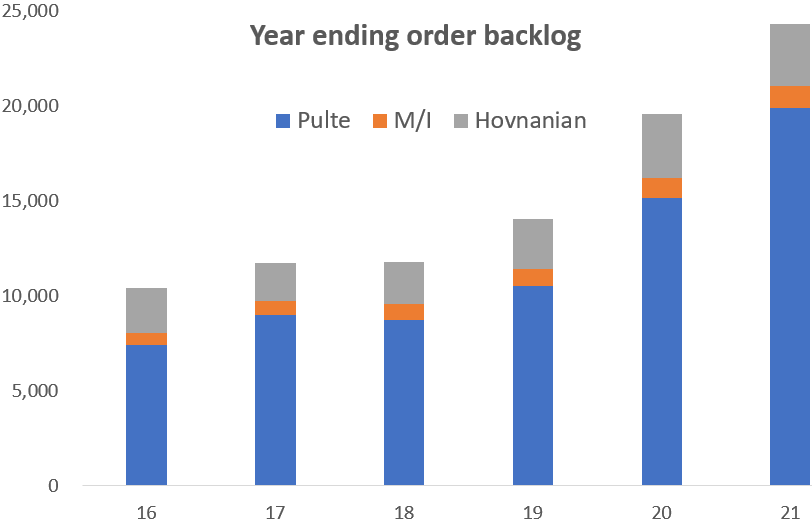
The 2021 figures actually understate the builders’ earnings potential. Supply chain disruptions have caused homebuilders to delay developing and selling homes until the managements are more confident that they can deliver finished homes in a timely manner. So ’21 backlogs could have been even higher.
To further highlight the builders’ bright ’22 prospects, here is some guidance by peer KB Home (NYSE:KBH) from two weeks ago (my additions in parentheses):
“Housing revenues in the range of $7.2 billion to $7.6 billion.” (versus $5.7 billion in ’21)
“Average selling price in the range of $480,000 to $490,000”. (versus $422,700 in ’21)
“Housing gross profit margin in the range of 25.4% to 26.2%” (versus 24.4% in ’21)
“Return on equity in excess of 26%.” (versus 20% in ’21)
Net/net, I’m not worried about Pulte, M/I or Hovnanian meeting earnings expectations for this year.
The longer-term supply/demand story
Like any business, earnings prospects for homebuilders depend upon the outlook for demand and supply of their product. I’ll therefore review the supply and demand stories, then put them together to see how earnings should shake out.
Net/net, I expect Pulte, M/I and Hovnanian to maintain roughly their EPS levels for the next five years.
The supply outlook – steady as she goes.
The business of homebuilders is to supply new housing units to the existing housing stock. This chart shows a history of the industry’s housing starts as a percent of the housing stock at that time, to arrive at a “growth in the housing stock” figure:
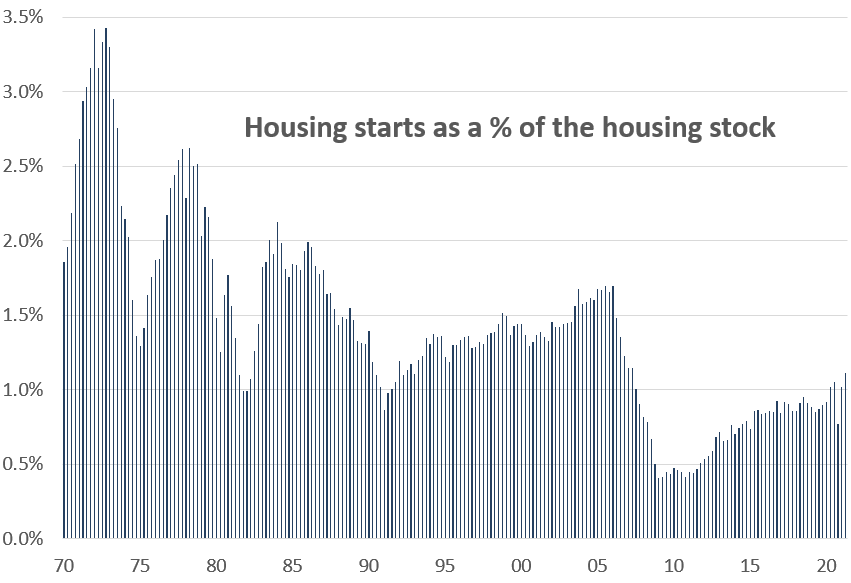
The chart shows that the supply of new homes is very low at present, outside of the post-’07 housing crisis era. Is the direction of demand likely to make that supply too much, too little or just about right?
The housing demand outlook – crosswinds
I believe the most important measure of housing demand is the amount of vacant housing. Luckily for us, The Census Bureau is on the case; they’ve been tracking housing vacancy data since 1965. Here are their numbers:
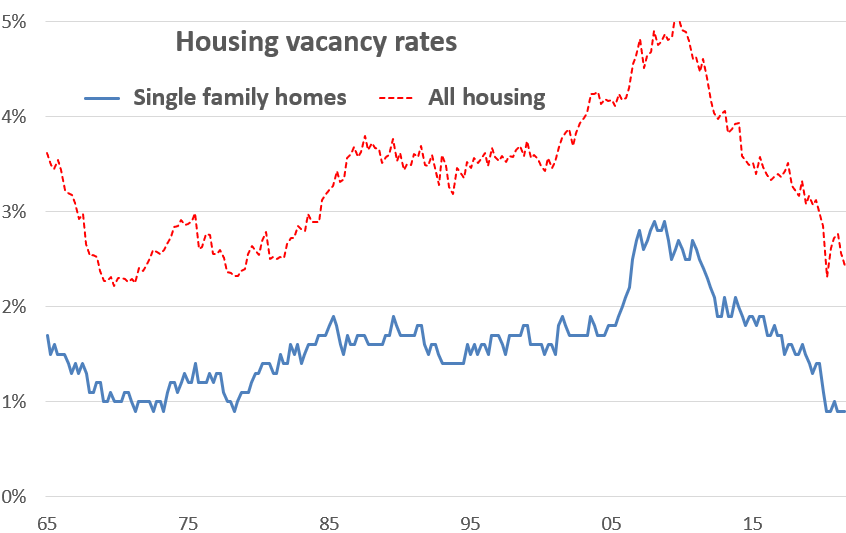
Housing vacancies, both for single family and total housing markets, are currently at the lowest levels for the past 56 years! That’s why we keep getting stories like this one:
“The latest reading of housing inventory levels doesn’t look good for would-be homebuyers. As of December, there were just 1 million homes listed for sale on Zillow. That’s down 18% from December 2020, and down 38% from December 2019, when there were nearly 1.7 million homes for sale. This means the housing market is tighter right now than it was heading into the hypercompetitive 2021 spring housing market.” (Fortune magazine, January 18, 2022)
I’ll quantify the shortfall. This chart shows the excess or shortage of housing units compared to a “normal” 3.5% vacancy rate:
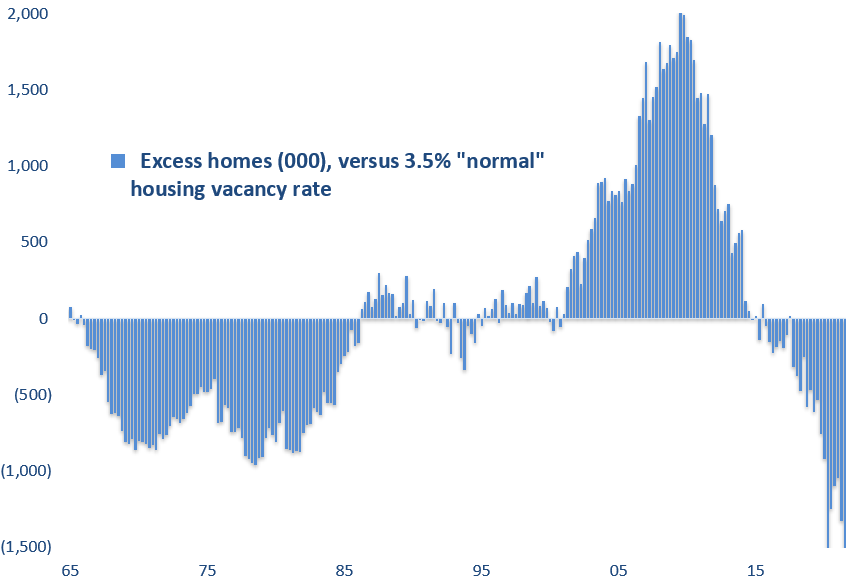
A shortage of 1.5 million homes! By the way, if you’re thinking that the U.S. is in for another housing bust like during the financial crisis, think again. Going into the ‘08 crisis, the country was sitting on a 1 million housing unit excess. That’s a far, far cry from the current 1.5 million shortage.
I am not ignoring reasons to be concerned about housing demand. Two key ones are:
- Slowing population growth, to less than 0.5% at present. Fewer people added means less demand for new housing. Partly offsetting this fact is that the large Millennial cohort has entered its peak homebuying years.
- Housing has gotten less affordable recently. Affordability is a function of household income, home prices and mortgage rates. Here is how those three factors have combined over the past 30 years:
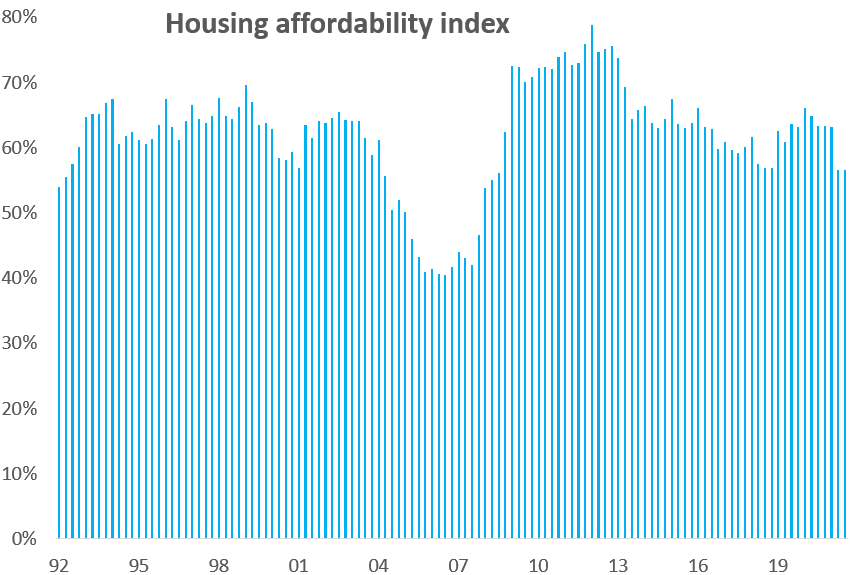
This data is the NAHB’s estimate of what percentage of U.S. households can afford the average home. The chart shows that affordability at present was at the lower end of the range for Q3 ‘21. I estimate that mortgage payments are now 13% higher than Q3 because of a further rise in home prices and a sharp increase in the mortgage rate. As a result, the affordability index is well lower than Q3, which of course squeezes demand.
Putting supply and demand together, I expect more of the same construction activity.
For the past year and a half, homebuilders have been constructing at about a 1.1 million unit pace. Considering the pluses and minuses for demand, I expect builders can roughly maintain that 1.1 million rate for the foreseeable future, say the next five years. I also expect home price gains to slow sharply, to perhaps 2-4% a year.
That is a far cry from the sharp decline that investors have priced into these stocks, and support for my belief that Pulte, M/I and Hovnanian can maintain their ’22 EPS levels for the next five years or so. My other two major assumptions behind my longer-term EPS view are:
- Gross margins will get squeezed somewhat as home price increases moderate and labor costs rise.
- The builders will use the substantial free cash flow they are generating to buy back significant amounts of stock (Pulte and M/I) or pay down lots of debt (Hovnanian).
I reviewed these assumptions in detail in the Seeking Alpha articles I linked to above.
Valuation. A liquidation analysis.
I already noted the bottom-of-the-barrel P/E ratios of the builders. To highlight what the market prices implicitly assume, here’s a liquidation analysis. I add four values:
- Book value
- The market value above book value of homes under construction, assuming the 25% gross margin that builders are currently earning
- The market value above book value for land owned and optioned. I assume that Pulte and M/I land has a 3-year average life that has appreciated by 40%, while Hovnanian’s land position has a 2-year average life with 30% appreciation.
- Hovnanian has tax loss carryforwards that are worth a $150 million present value.
Here are my results:
Liquidation values Author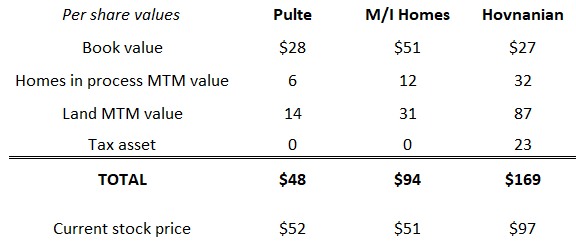
M/I and Hovnanian already are selling at well below their liquidation values. But remember that these companies also have value as operating companies – they will be buying land and selling homes for many, many years ahead. That operating company value is not reflected in the liquidation calculation. And it has value. For example, peer Toll Brothers (NYSE:TOL) earned a median 18% return on shareholders’ equity over the past 30 years, including an expected 24% this year. You would certainly pay well over par value for an investment that yields 18%, even if that return varies with housing cycles.
Net/net, these stocks are quite cheap. I add the value investor caveat that I have no idea when investors will agree with me. But 50%+ returns are usually worth the wait.
Be the first to comment