

Prostock-Studio/iStock via Getty Images
Thanks to the sell-off in REITs this year, there are a number of strong Medical REITs on sale at attractive prices. Hoya Capital Income Builder makes it easy to spot them.
Although Medical REITs have slightly outperformed the REIT average this year (see chart below), that isn’t saying much, since the average total return for the REIT sector overall YTD is a dismal (-26.01%).
Hoya Capital Income Builder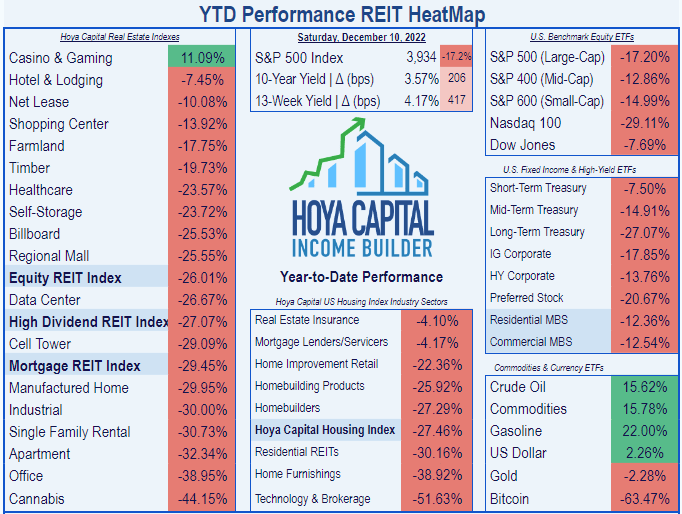
Amid the carnage, the average Yield for the sector has soared to 4.93%, and the average Price/FFO has fallen to just 15.7. Yet there are three Healthcare REITs showing strong growth in revenue and cash flow, that are available at even more attractive prices. Still more remarkably, while most Medical REITs were forced to cut or suspend dividends in response to the COVID crisis, all three of these companies maintained or increased their dividends.
This article spotlights growth, balance sheet, dividend, and valuation metrics for Medical Properties Trust (MPW), Community Healthcare Trust (CHCT), and Global Medical REIT (GMRE).
Medical Properties Trust
Medical Properties Trust
Established in 2003 and headquartered in Birmingham, Alabama, MPW owns 434 properties, primarily hospitals (80%), leased to 54 tenants in 10 countries, primarily in the U.S. and Europe. MPW is the second-largest non-governmental owner of hospitals in the world.
Medical Properties Trust website
The company develops new hospitals as well as acquiring, expanding, and renovating existing ones.
Medical Properties Trust website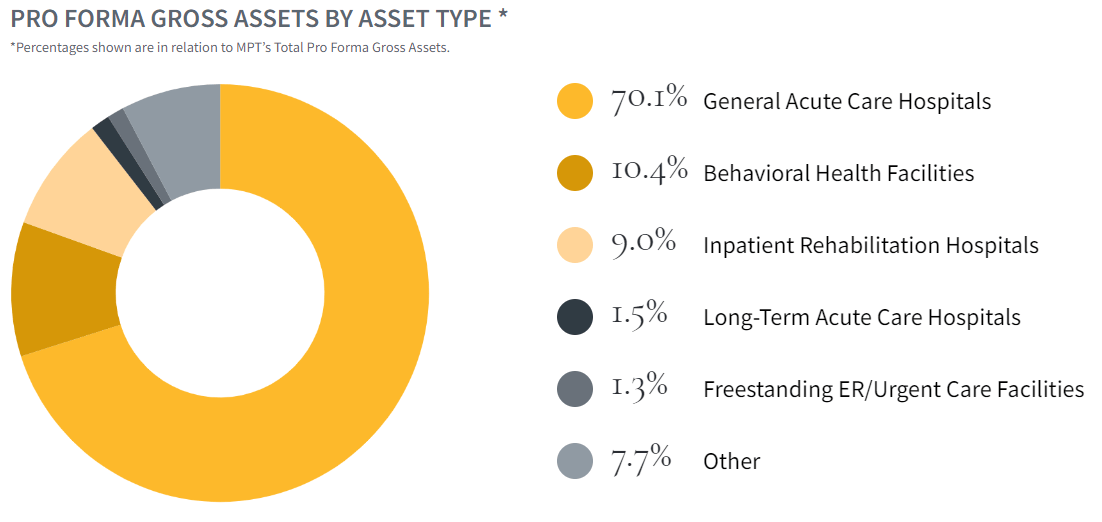
The core of MPW’s business model is unlocking the value of hospital real estate for growth, through two mechanisms:
- Sale/Leaseback
- Investments in hospital operators
This allows hospital operators to improve their financial positions, gain liquidity, reduce taxes, and increase operating flexibility, all while maintaining control over the facility. The weighted average lease is an ultra-lengthy 17.6 years.
Medical Properties Trust website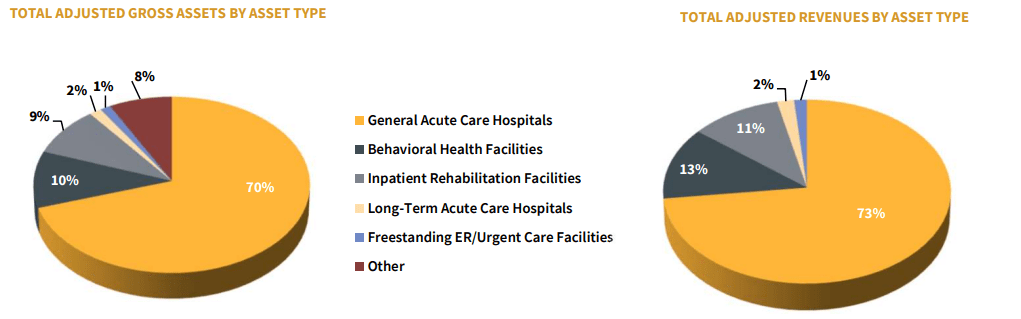
Latest quarterly returns showed Adjusted FFO up 6.9% YoY, (5.9% on a per-share basis), and net income per share attributable to stockholders up 27.5%.
The biggest knock against MPW is a lack of diversification in its tenant roster. Its largest tenant accounts for 29.5% of Q3 2022 revenues, and its top 5 account for 58.5%, making the health and success of these operators crucial to MPW’s results.
Q3 2022 Earnings Supplemental for Medical Properties Trust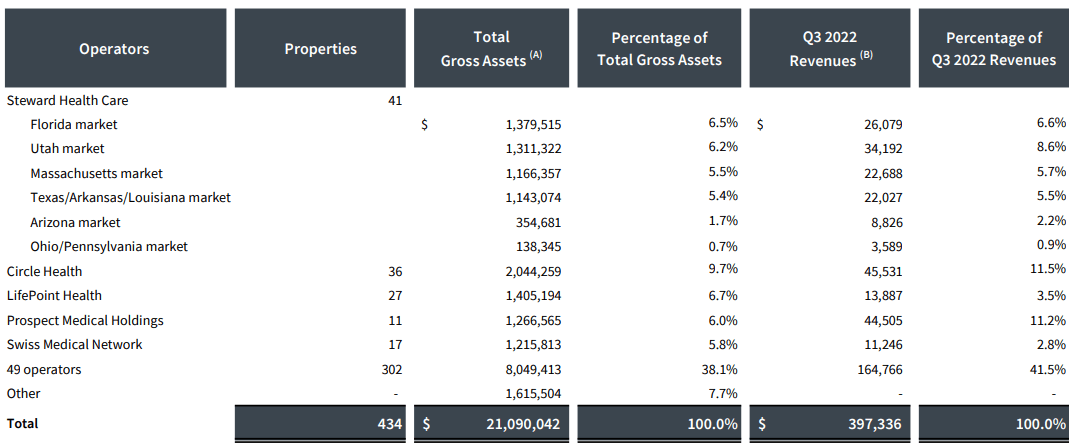
Growth
Although the rate of growth in revenues for MPW slowed sharply this year, and cash flow backpedaled, the 3-year growth rates are FROG-worthy double digits across the board, and continued sizzling, right through the pandemic.
| Metric | 2019 | 2020 | 2021 | 2022* | 3-year CAGR |
| FFO (millions) | $536 | $758 | $976 | $1075 | — |
| FFO Growth % | — | 41.4 | 28.8 | 10.1 | 26.1% |
| FFO per share | $1.30 | $1.57 | $1.75 | $1.81 | — |
| FFO per share growth % | — | 20.8 | 11.5 | 3.4 | 11.7% |
| TCFO (millions) | $494 | $618 | $812 | $744 | — |
| TCFO Growth % | — | 25.1 | 31.4 | (-8.4) | 14.6% |
*Projected, based on Q3 2022 results
Balance sheet
MPW’s balance sheet is bond rated, but the company’s debt ratio is a little high at 45%. Its liquidity of 1.86, coupled with its double-digit growth rates, qualifies Medical Properties Trust as a bona fide FROG. The weighted average interest rate on the company’s debt is 3.463%, with maturities building to a peak in 2026.
| Company | Liquidity Ratio | Debt Ratio | Debt/EBITDA | Bond Rating |
| MPW | 1.86 | 45% | 6.6 | BB+ |
| Medical REIT avg | 2.02 | 30% | 7.4 | — |
| Overall REIT avg | 1.90 | 25% | 6.2 | — |
Source: Hoya Capital Income Builder, TD Ameritrade, and author calculations
Dividends
MPW pays an inflation-beating 9.83% yield. The company’s 3-year dividend growth rate of 4.4% is far better than the Medical REIT average, and the Dividend Score of 11.19 is nothing short of sensational. With a payout ratio of 60%, the Dividend Safety score assigned by Seeking Alpha Premium is a picture perfect C+.
| Company | Div. Yield | 3-yr Div. Growth | Div. Score | Payout | Div. Safety |
| MPW | 9.83 | 4.4% | 11.19 | 60% | C+ |
| Medical REITs | 4.93 | (-4.3)% | 4.32 | 70% | C |
| REITs overall | 3.86 | 6.3% | 4.61 | 59% | C |
Source: Hoya Capital Income Builder, TD Ameritrade, Seeking Alpha Premium
Dividend Score projects the Yield three years from now, on shares bought today, assuming the Dividend Growth rate remains unchanged.
Valuation
At a Price/FFO ratio of just 6.5, and a 27.6% discount to NAV, Medical Properties Trust is dirt cheap.
| Company | Div. Score | Price/FFO ’22 | Premium to NAV |
| MPW | 11.19 | 6.5 | (-27.6)% |
| Medical REIT average | 4.32 | 15.7 | (- 2.9)% |
| Overall REIT average | 4.61 | 17.1 | (-15.0)% |
Source: Hoya Capital Income Builder, TD Ameritrade, and author calculations
Bottom line: MPW
MPW offers a practically irresistible combination of strong growth, inflation-beating dividends that are unlikely to be cut, and dirt cheap price.
Community Healthcare Trust
Community Healthcare Trust
Founded in 2014, and headquartered in Franklin, Tennessee, small-cap CHCT owns over 160 medical facilities totaling some 35 msf (million square feet) spread across 34 U.S. states, currently enjoying 90.8% occupancy.
CHCT website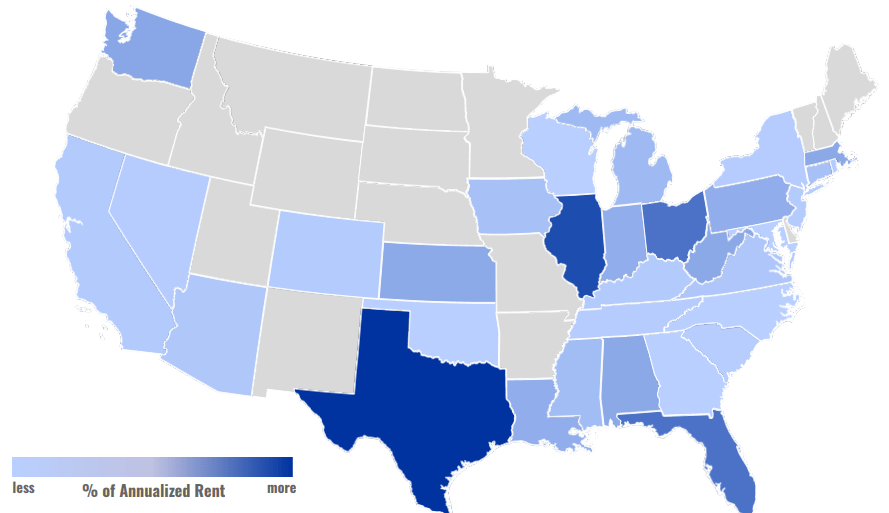
About 30% of CHCT’s revenue comes from MOBs (medical office buildings), with 16% from AIBs (acute inpatient behavior facilities), and another 19% from IRFs (inpatient rehab facilities). The full breakdown is shown below.
CHCT Q3 2022 Earnings Supplemental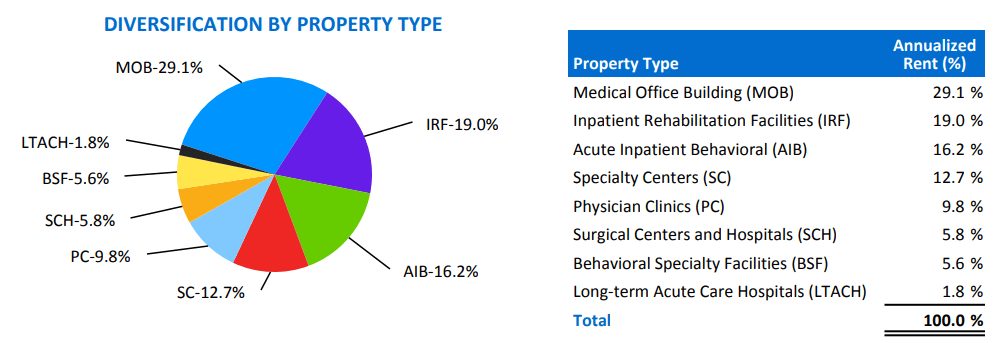
The core of CHCT’s business model is leveraging the personal relationships between the management team and a wide array of medical providers, built up over many years in the medical real estate business, to discover off-market or lightly-marketed acquisition opportunities in secondary markets. Thus, they avoid competitive bidding and secure properties at favorable prices, resulting in cap rates well above average.
Latest quarterly results for CHCT show FFO up 4.0% from Q3 2021 (3.6% on per-share basis), and AFFO up 7.2% (6.8% per share), according to the company’s Q3 2022 earnings supplemental. Rental income is up 6.5% and NOI (net operating income) is up 6.7% (5.0% per share). Adjusted EBITDAre is up 6.6%. The company has added a net $53 million worth of properties thru the first nine months of this year, bringing the total portfolio value to $890 million. This is a significantly slower pace than in previous years, but still solid, given the interest rate environment.
The biggest knock against CHCT is its occupancy rate, which was expected to stabilize in the low 90’s, but at times has dipped into the high 80’s, with significant consequences for internal growth. Tenant diversification is also far from ideal, with the top two tenants accounting for 20% of ABR.
CHCT Q3 2022 Earnings Supplemental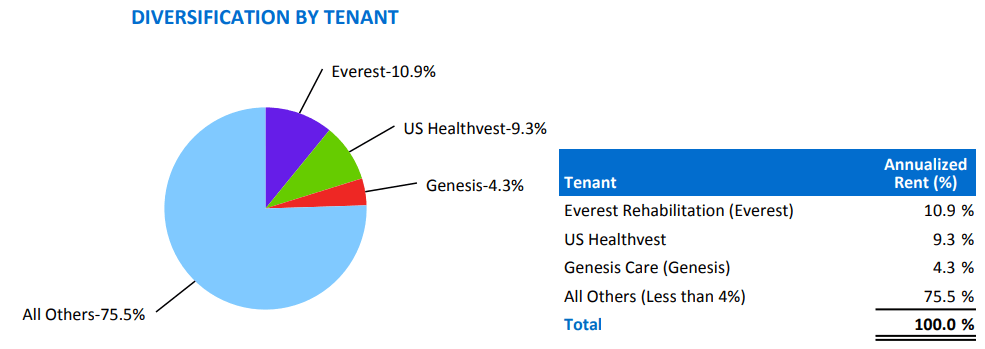
Growth
Like MPW, the revenue and cash flow growth rates for CHCT have slowed significantly this year, but the 3-year growth rates remain FROG-worthy double digits. CHCT kept growing, right through the pandemic.
| Metric | 2019 | 2020 | 2021 | 2022* | 3-year CAGR |
| FFO (millions) | $32.1 | $45.0 | $52.9 | $54.7 | — |
| FFO Growth % | — | 40.2 | 17.6 | 3.4 | 19.4% |
| FFO per share | $1.67 | $2.04 | $2.35 | $2.27 | — |
| FFO per share growth % | — | 22.2 | 15.2 | (-3.4) | 10.8% |
| TCFO (millions) | $32.4 | $48.4 | $56.3 | $59.8 | — |
| TCFO Growth % | — | 49.4 | 16.3 | 6.2 | 22.7% |
*Projected, based on Q3 2022 results
Balance sheet
CHCT maintains a superb all-weather balance sheet, with excellent liquidity and ultra-low debt. But for its small size, CHCT would be a FROG. So I classify it as a Tadpole until it reaches $1.4 billion in market cap.
| Company | Liquidity Ratio | Debt Ratio | Debt/EBITDA | Bond Rating |
| CHCT | 2.44 | 18% | 4.7 | — |
Source: Hoya Capital Income Builder, TD Ameritrade, and author calculations
The weighted average interest rate on CHCT’s revolving line of credit balance of $307 million is 4.47%, and 3.79% on its term loans. The company faces no maturities in 2023, 2025, or 2027.
CHCT Q3 2022 Earnings Supplemental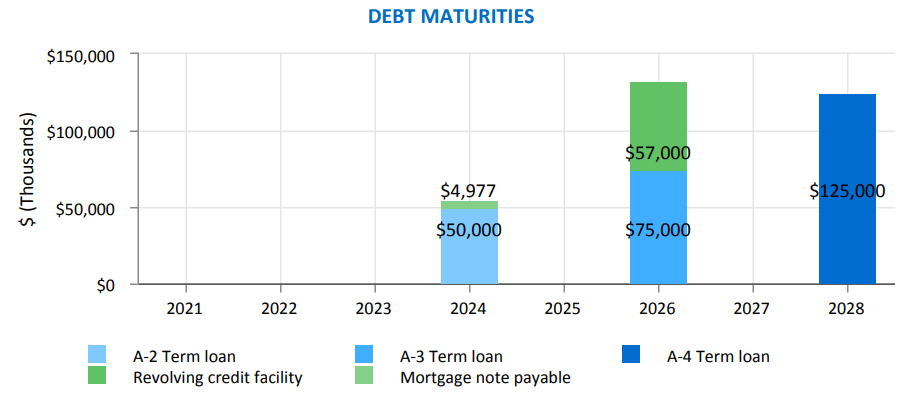
Dividends
CHCT pays a fatter-than-average 5.08%, and despite a payout ratio of 80%, the dividend gets a safety grade of B- from Seeking Alpha Premium. This company has raised its dividend a quarter of a penny every quarter of its existence, like clockwork.
| Company | Div. Yield | 3-yr Div. Growth | Div. Score | Payout | Div. Safety |
| CHCT | 5.08 | 2.5% | 5.47 | 80% | B- |
Source: Hoya Capital Income Builder, TD Ameritrade, Seeking Alpha Premium
Valuation
Growth like CHCT has shown usually comes at a high price tag. However, the current Price/FFO on this company is now 15.5, slightly below both the Medical REIT and overall REIT averages.
| Company | Div. Score | Price/FFO ’22 | Premium to NAV |
| CHCT | 5.47 | 15.5 | 0.2% |
Source: Hoya Capital Income Builder, TD Ameritrade, and author calculations
Bottom line: CHCT
CHCT offers an interesting combination of above-average yield and below-average price, with a balance sheet ready for any conditions, and a dividend almost guaranteed to remain the same or increase.
Global Medical REIT
Global Medical REIT
Global Medical REIT is a small-cap net-lease medical office REIT that acquires purpose-built specialized healthcare facilities and leases them to healthcare systems and physician groups with leading market share. The company owns 189 properties totaling 4.9 msf (million square feet), leased to 269 tenants. The weighted average lease term is 6.4 years, and the weighted average cap rate for all acquisitions is a tasty 7.7%.
The top 10 tenants account for only 36% of ABR.
Company website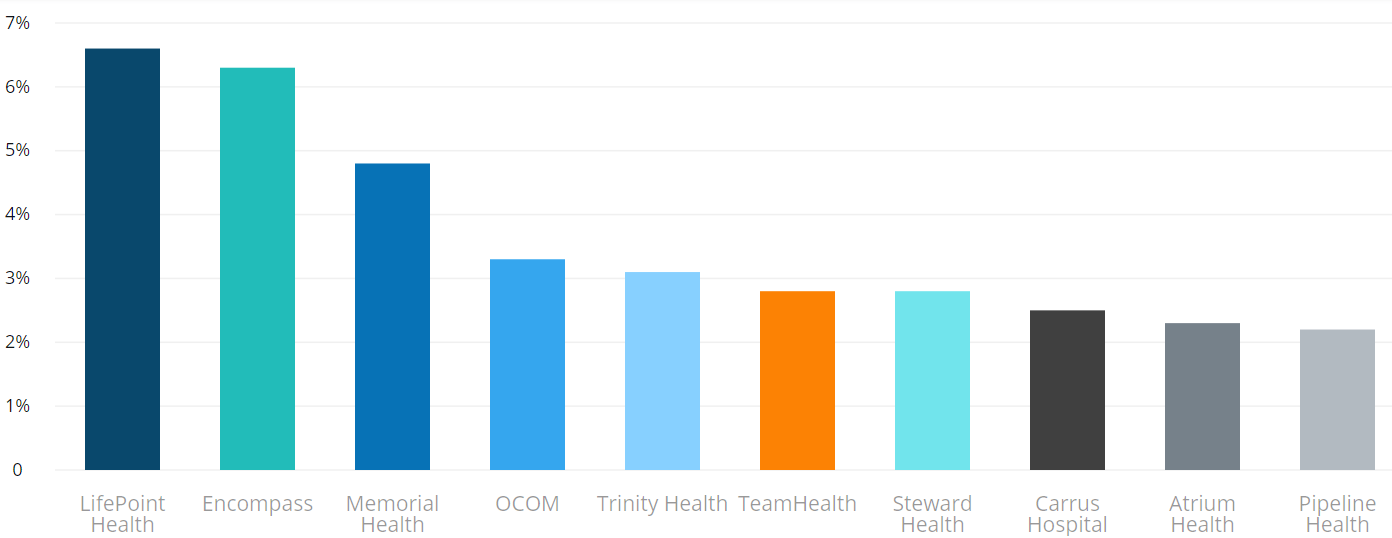
About two-thirds (67.3%) of GMRE’s assets are MOBs (medical office buildings). Rehab facilities make up about one-sixth (17.5%).
Company website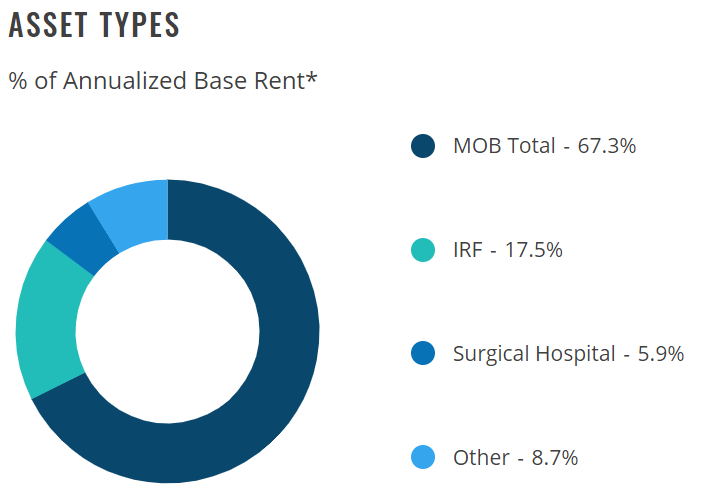
The company does not focus on any particular geographic area. Texas and Florida lead the way with 18% and 10% of ABR, respectively.
Company Q3 2022 supplemental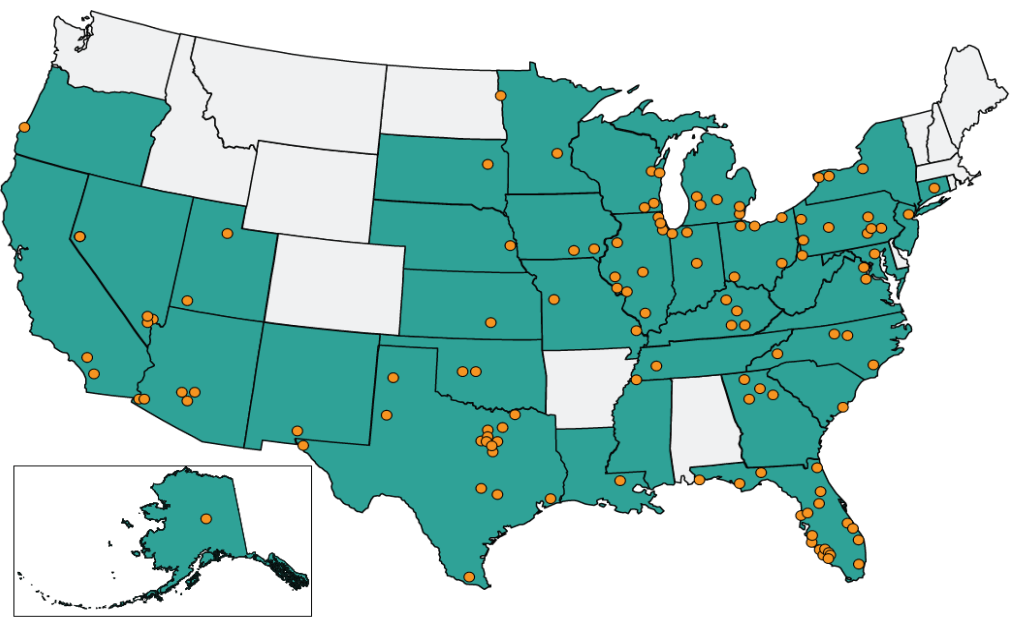
Company website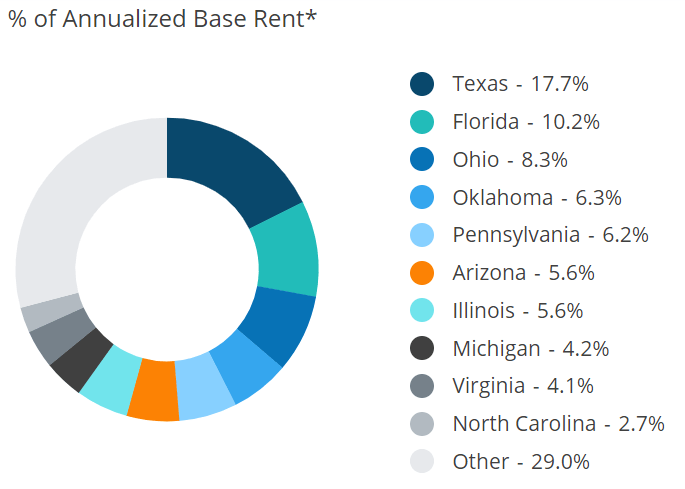
The core of GMRE’s business model is using a network of referral agents to locate off-market opportunities with price tags between $5-$20 million, and a highly disciplined selection process, seeking characteristics that will drive occupancy and profitability, targeting $200 million in annual acquisitions. Through September 30, they are right on schedule, with $149 million in 14 acquisitions totaling 583,000 leasable square feet.
According to the company’s latest 10-Q, in Q3 2022, GMRE reported revenues up 18.1% from Q3 a year ago, and net income up 118%, thanks largely to some timely and profitable dispositions. FFO was up 2.4%, and AFFO ticked up 4.2%. EBITDAre rose 11.4%, with adjusted EBITDAre up 10.4%. Cash from operations for the first 9 months was up 12.7% YoY.
The biggest knock against GMRE is the financial soundness of its tenant base. However, this company is diligent in vetting its tenants, so any such risk is Medical sector-wide, and not confined only to GMRE.
Growth
GMRE’s revenue and cash flow took a step back during COVID, but more than made up for lost time in 2021, before settling back toward more normal FROG-worthy double-digit rates this year.
| Metric | 2019 | 2020 | 2021 | 2022* | 3-year CAGR |
| FFO (millions) | $28.4 | $28.0 | $58.2 | $64.8 | — |
| FFO Growth % | — | (-1.4) | 107.9 | 11.3 | 19.1% |
| FFO per share | $0.75 | $0.56 | $0.90 | $0.93 | — |
| FFO per share growth % | — | (-25.3) | 60.7 | 3.33 | 7.4% |
| TCFO (millions) | $36.4 | $34.5 | $69.0 | $77.6 | |
| TCFO Growth % | — | (-5.2) | 100.0 | 12.5 | 28.7% |
*Projected, based on Q3 2022 results
Balance sheet
GMRE’s balance sheet is neither weak nor particularly strong, coming in almost dead average on liquidity, debt ratio, and Debt/EBITDA. Like CHCT, GMRE is a Tadpole.
| Company | Liquidity Ratio | Debt Ratio | Debt/EBITDA | Bond Rating |
| GMRE | 1.90 | 30% | 7.4 | — |
Source: Hoya Capital Income Builder, TD Ameritrade, and author calculations
GMRE’s debts totaled $635 million as of September 30.
Dividends
Global Medical REIT pays an inflation-beating 8.38% yield. Although its 90% payout ratio and Dividend Safety rating of D look risky, in fact this company maintained or increased its dividend, right through the pandemic, and ever since, with similar Dividend Safety ratings.
| Company | Div. Yield | 3-yr Div. Growth | Div. Score | Payout | Div. Safety |
| GMRE | 8.38 | 1.6 | 8.79 | 90% | D |
Source: Hoya Capital Income Builder, TD Ameritrade, Seeking Alpha Premium
Valuation
Given its growth rate and robust dividends, GMRE sells at a surprisingly low Price/FFO of 10.7, and a 16.5% discount to NAV.
| Company | Div. Score | Price/FFO ’22 | Premium to NAV |
| GMRE | 8.79 | 10.7 | (-16.5)% |
Source: Hoya Capital Income Builder, TD Ameritrade, and author calculations
Bottom line: GMRE
GMRE offers a hard-to-resist combination of inflation-beating yield, with dividends that are likely to remain the same or increase, all at an attractive price.
Be the first to comment