

tortoon
By Seema Shah, Chief Global Strategist | Han Peng, CFA, Quantitative Strategist | Garrett Roche, CFA, FRM, Global Strategist
In last year’s Global Insights 2022 outlook, Past the peak, we highlighted how with equity valuations at or near all-time highs, rates near all-time lows, and central banks gearing up to end easy monetary policy, 2022 would present a more challenging and volatile investment environment. Frustratingly for investors, that call was dead on, with both U.S. equities and bonds, for the first time since the 19th century, recording double-digit yearly declines!
2023, however, is sizing up to be a better year for some segments of the market. Inflation and central bank policy will likely continue being key focus points for investors. Yet, while persistently restrictive monetary policy and the likely resulting U.S. recession will weigh on the broad equity market outlook, it implies opportunities for both core fixed income and real assets.
China’s potential reopening will be another key theme to watch in 2023. The path to loosening COVID- 19 restrictions may bring chaos locally, but a targeted combination of COVID-19 reopening and stimulus tailwinds could be very positive for China and the global economy. What’s more, it should contribute to the ending of the U.S. dollar bull run in what could be a pivotal shift for emerging market economies.
As ever, the path forward is rarely straight and is never simple. In a world with still so much uncertainty and volatility, our 2023 outlook, Silver linings, is designed to help investors navigate the key themes that we think will drive financial markets next year: Federal Reserve policy, China reopening, and U.S. dollar strength.
We wish you a happy and successful 2023.
Federal Reserve policy: Restrictive, but no regrets
2023 may not see a repeat of the frantic Federal Reserve (FED) activity that characterized 2022, but policy rates almost certainly still have further to rise. And while it may not be evident yet, the most aggressive monetary tightening cycle since the 1980s will leave a visible imprint on the economy in 2023. Unfortunately, relief from the Fed will not be forthcoming, even as a probable recession takes shape.
After four consecutive 75 basis point (bps) Fed hikes and a post-pandemic resolution of supply chain bottlenecks, U.S. inflation is finally on a decelerating path. However, history suggests that inflation will continue to trigger angst and anxiety in policymakers through 2023. Since the 1980s, once inflation in developed economies has risen to 5%, it has taken an average of 10 years to return to 2%! Of course, central banks today have a broader toolkit and greater credibility, so it shouldn’t take a decade to return to target. But, progress will be frustratingly slow, requiring deliberate Fed attention to get inflation close to 2% within even the next 24 months, let alone the next 12.
Once inflation in developed economies hit 5%, it took multiple years to fall to 2%
Years taken to tame inflation
Developed economies and year in which inflation first hit 5%, 1980–2021
IMF World Economic Outlook Database, Principal Asset Management. Data As of December 15, 2022.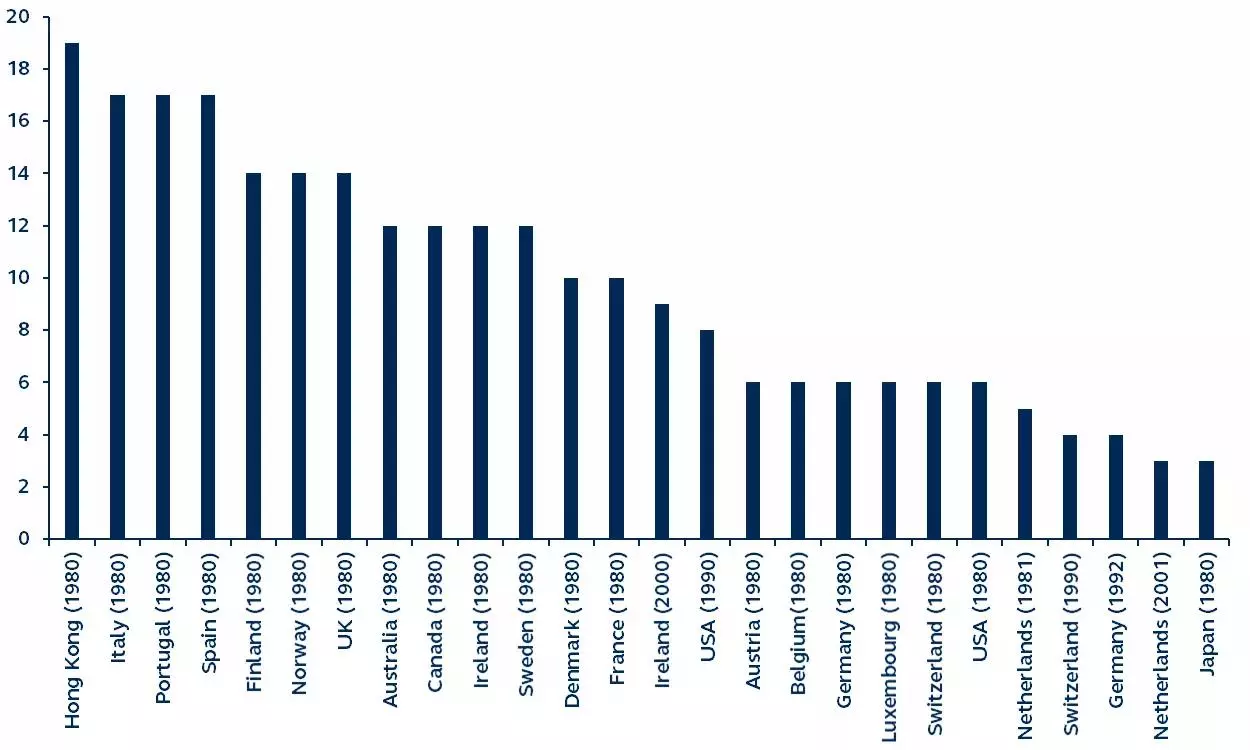
Disinflation needs some help
There are segments of the inflation basket that will soften rapidly. Food and energy prices, for example, have fallen sharply, while the supply chain recovery is finally yielding relief for goods price inflation. For services, however, disinflation will be a slow process, requiring below-potential economic growth and a continued loosening in the labor market.
So far, the U.S. economy and labor market are slowing, just not fast enough. The Atlanta Fed’s GDPNow tracker estimates that U.S. real GDP growth in Q4 is still running at an above-trend 4%. In the labor market, there are 4.6 million more job openings than there are unemployed workers—almost the widest gap in at least 20 years—while monthly payrolls have been hovering around 175,000, a level historically consistent with strong economic growth.
The U.S. labor market is showing little sign of loosening
Job openings minus unemployed workers
Thousands, January 2000–November 2022
Bureau of Labor Statistics, Principal Asset Management. Data as of December 15, 2022.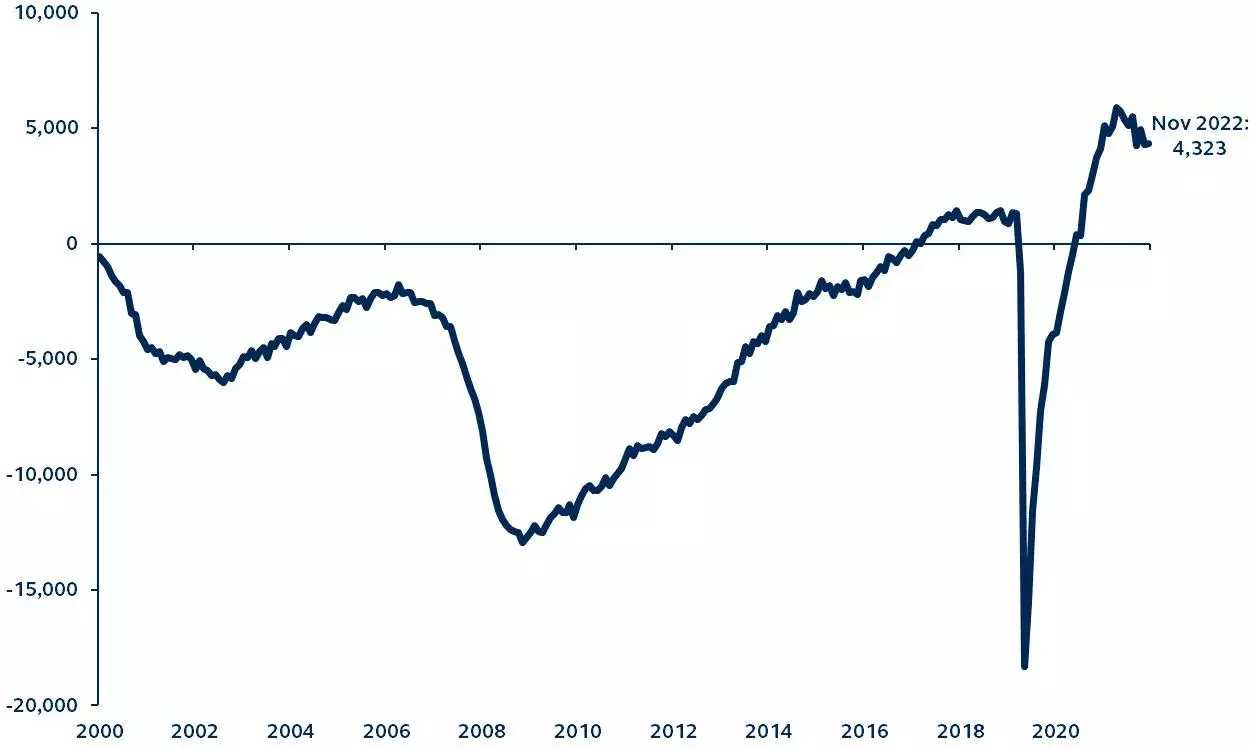
So, while the Fed is stepping down the pace of rate increases, the pervasive nature of the inflation problem requires the Fed to hike rates further—and stomach considerable further economic weakness—ultimately engineering a likely hard landing for the U.S. economy.
A pause is not a pivot
In recent months, talk of a “Fed pivot”—a lifeline offered by the central bank as economic pressures become too intense—has become rampant. The rationale for pivot expectations is clear: Historically, once Fed rates peak, rate cuts follow within just six months.
However, Fed resistance to policy rate cuts in 2023 will likely be very high. Not only is recession a necessary step in the path towards price stability, but the Fed has also been burned by regret from their previous inflation mistakes. In the early 1980s, they cut rates too soon, inviting a resurgence in inflationary pressures which ultimately required even more aggressive monetary tightening. Their miscalculated decision to keep rates at zero last year, even as inflation surged, will inevitably be in their mind too.
The consequence will most likely be that, after reaching a peak rate of 5.25-5.5% in the first half of the year, Fed policy will have to remain restrictive throughout 2023—even as the U.S. economy falls into recession.
China: How to steer a stranded ship?
China’s equity market underperformance has lasted almost two years, but a lifting of COVID-19 restrictions in 2023 could finally offer some respite if the government combines reopening with policy stimulus.
The past two years have been a tough slog for China investors. In 2021, despite a modest economic recovery, intensified regulations and anti-monopoly measures led to a steep valuation contraction in Chinese assets. In 2022, although the regulatory environment had marginally improved, the government’s restrictive COVID-19 policy and a deep property market downturn ensured a continuation of the weak economic and market backdrop.
Early in the global pandemic, China’s “zero-COVID” policy had been viewed as a success. After nearly eradicating all local infections, China became the first country to “recover” from the pandemic. Recently, however, highly infectious new strains have rendered China’s once effective policy extremely costly to maintain, with repeated lockdowns and extended quarantine periods resulting in a severe economic slowdown. Policymakers have tried to alleviate the struggles by keeping both fiscal and monetary policies reasonably accommodative even while the rest of the global economy has tightened financial conditions. Yet, this has only dulled the pain, with the frequent COVID-19 lockdowns weighing on confidence and deterring consumption activity, ultimately restricting the impact of policy stimulus.
China COVID-19 cases mounted even as government policy remained relatively restrictive
China COVID-19 case counts and policy restrictiveness
Month-over-month change in reported cases, Stringency Index level, February 2020–November 2022
Bloomberg, Principal Asset Management. Data as of December 15, 2022. Note: The Stringency Index was generated by Oxford to measure government response on COVID-19. A higher number indicates more restrictive policies.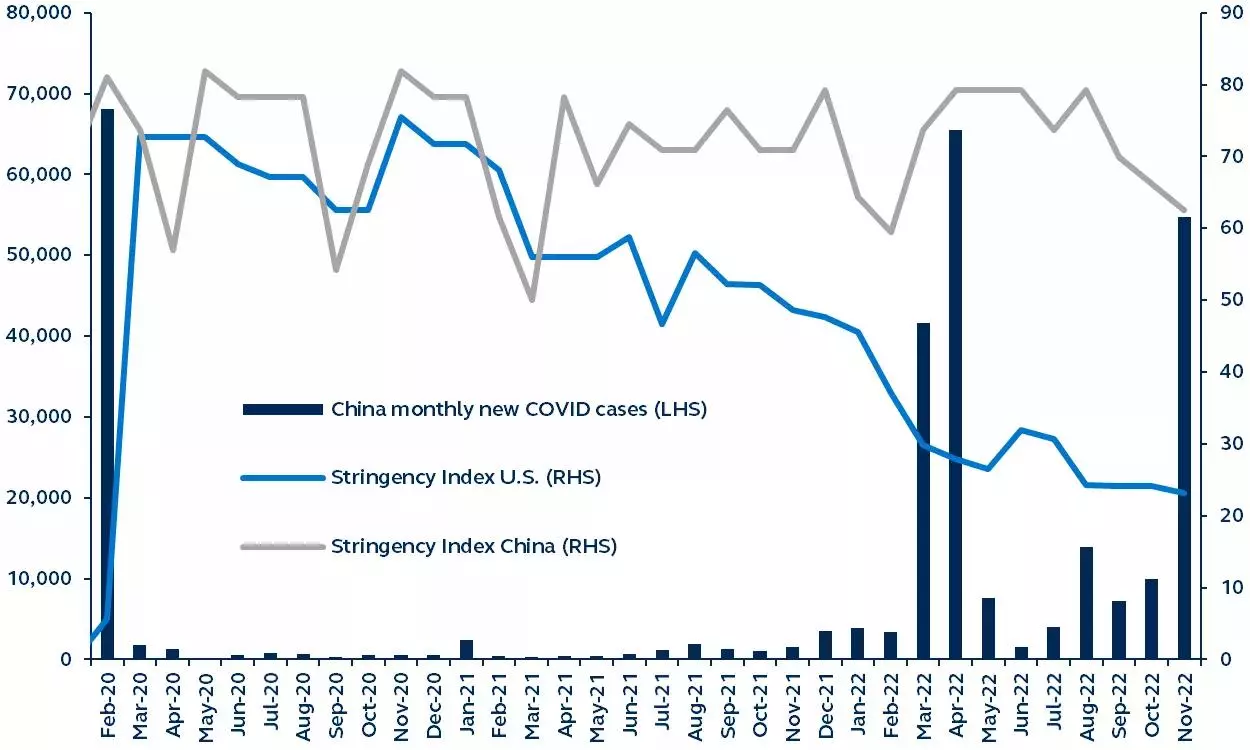
A change of course in COVID-19 policy
It has become increasingly evident to the government that the one policy lever that holds the key to unlocking a Chinese recovery is an unwinding of the “zero-COVID” policy. Recent steps to lift COVID- related restrictions should unleash the pent-up demand from consumers and improve employment, as well as remove the impediments to other stimulative measures:
- Housing: The property market was another culprit behind China’s recent economic downturn. While there is already a tentative policy shift in favor of this sector, tepid confidence is preventing policy from having its desired impact. A “COVID reopening” will support housing demand, enabling policy to jump start a property market recovery.
- Fiscal stimulus: A COVID-19 reopening should mean that the government can eventually save fiscal powder from costly PCR tests and collective quarantine facilities, using those funds for more productive spending instead. In addition, the removal of restrictions will likely help lift the impact of fiscal stimulus on infrastructure investment.
- Monetary stimulus: With the true pain residing in the lack of demand, households and companies have not taken advantage of rate cuts or targeted relending. A reopening will likely lead to confidence restoration among households and businesses, kick-start demand and enable monetary stimulus to be more effective in driving growth.
Weak loan demand in China despite historically low interest rates
China loan demand and interest rates
Quarterly, January 2009–September 2022
Bloomberg, People’s Bank of China, Principal Asset Management. Data as of December 15, 2022.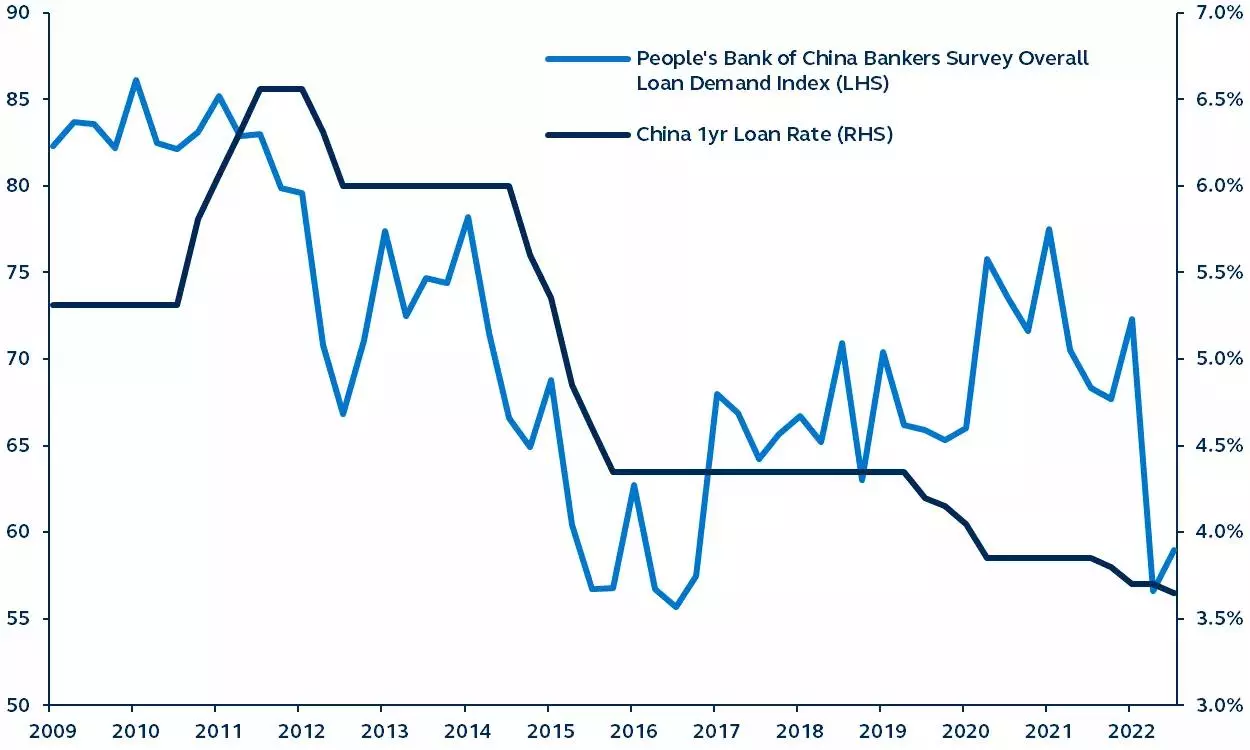
Costly, but necessary change
As experienced by other countries, a rapid surge in COVID-19 cases following reopening can bring chaos and setbacks. Yet, after the economic struggles of the past two years, China’s government is increasingly focusing on long-term economic benefits. A targeted combination of COVID-19 reopening and stimulus tailwinds could set China on a strong rebound path in 2023. By contrast, without easing COVID-19 policy, and despite any further fiscal stimulus, monetary easing, or accommodative housing policy, could lead to another year of muddling through, increasing the risks of short-term pain turning into chronic economic lethargy.
U.S. dollar: Developments can drive global opportunities
In a year where both traditional equity and fixed income assets have performed very poorly, the U.S. dollar has been one of the stand-out performers. Unfortunately, the U.S. dollar’s strength has intensified and deepened economic challenges around the world, lessening the attractiveness of global risk assets.
Dollar outlook
As a strong U.S. dollar became an increasingly consensus view in 2022, investor positioning became exceedingly one-sided, resulting in valuation extremes. Once softer U.S. inflation data finally appeared in mid-2022, expectations of continued Fed rate hikes were quickly revised lower, in turn driving a sharp U.S. dollar correction. Now, investors are reassessing the outlook for the greenback, and possible implications for global risk assets into 2023.
Despite its recent sharp pullback, U.S. dollar fundamentals remain supportive near term. For now, U.S. economic strength dictates that the Fed will hike rates further and remain the most hawkish of all major central banks—likely allowing the U.S. dollar to enjoy near-term strength. However, after a few more rate increases, a Fed pause in the first six months of 2023 is increasingly likely, and should lead to a sustainably weaker U.S. dollar. This dollar-negative development should be supplemented by China ending its zero-COVID policy and re-opening its economy.
Global opportunities
A weaker U.S. dollar would help loosen global financial conditions, ultimately relieving inflationary pressures in Europe’s economy, and devaluing EM debt in local terms. With such relief, non-U.S. central banks (in both developed and emerging markets) should be able to recalibrate from currency defense and fighting inflation via demand destruction, to more growth-supportive policies. Not only would this be incrementally positive for global growth, but it should also brighten the relative outlook for both EM and European global risk assets.
Further U.S. dollar weakness suggests EM could outperform U.S. stocks
U.S. dollar index and U.S. versus EM performance
2020-present
S&P Dow Jones Global Indices, MSCI, CME, Bloomberg, Principal Asset Management. Data as of December 1, 2022.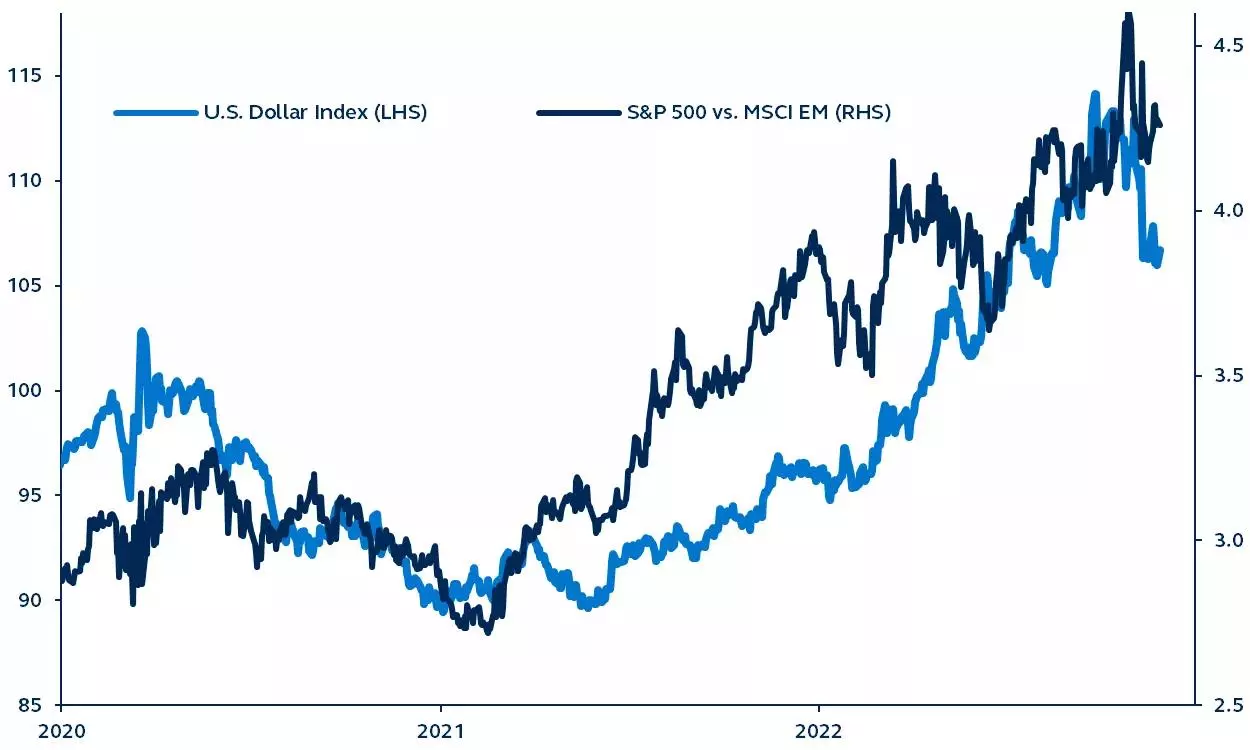
Current valuation premiums attached to U.S. assets present deep valuation discounts overseas. Once the U.S. dollar hits a sustainably weaker trend, global long-term investors may be able to capture increasingly attractive opportunities outside of the U.S., despite lingering global growth concerns and geopolitical wildcards.
Only commodities have outperformed the U.S. dollar in 2022
U.S. dollar and asset class performance year-to-date
Total returns
Clearnomics, Refinitive, Bloomberg, Principal Asset Management. Data as of December 7, 2022. Commodities = Bloomberg Commodity Index, U.S. dollar = U.S. Dollar Index, Fixed Income = iShares Core U.S. Bond Aggregate Index, Balanced = Hypothetical 60/40 portfolio consisting of 40% U.S. Large-Cap, 5% Small-Cap, 10% International Developed Equities, 5% Emerging Market Equities, 35% U.S. Bonds, and 5% Commodities, EAFE = MSCI EAFE Index, Small Cap = Russell 2000 Index, EM = MSCI EM Index. For illustrative purposes only. Indices are unmanaged and do not take into account fees, expenses, and transaction costs and it is not possible to invest in an index.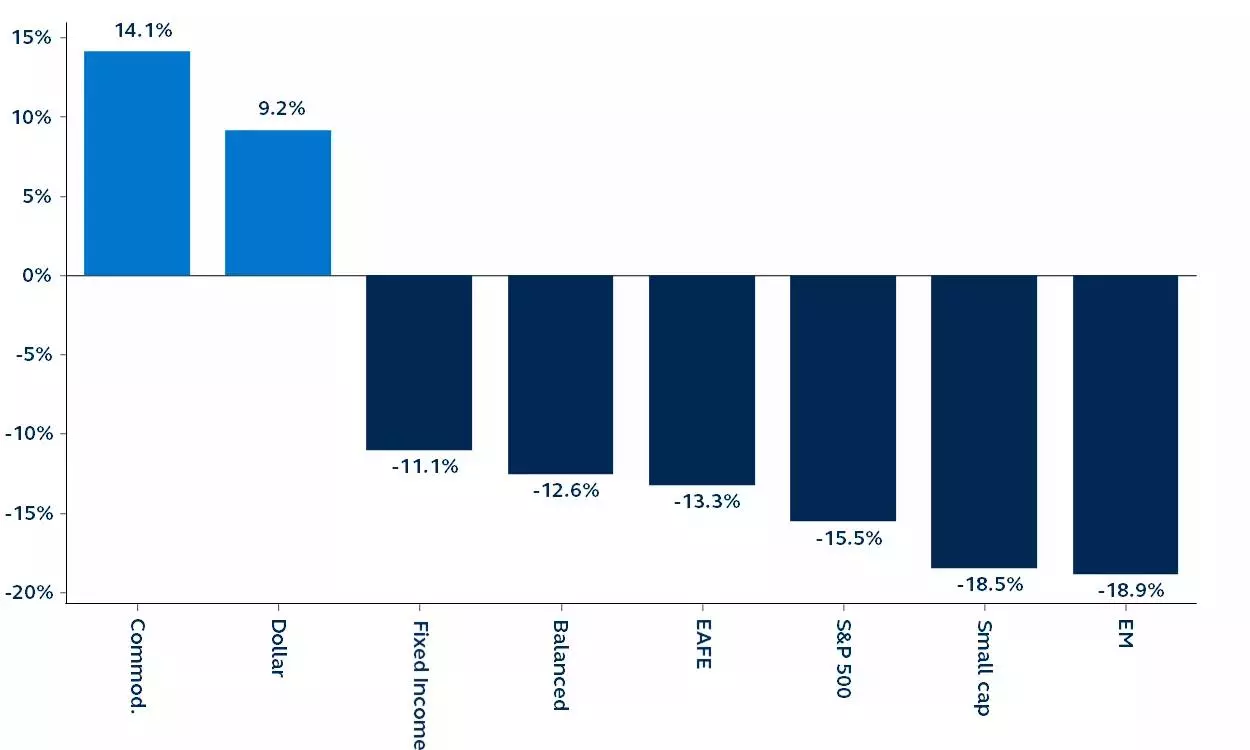
Global risk assets typically suffer under dollar strength, and 2022 was no different. However, such a precipitous ascent in the dollar often results in a crisis-type scenario, which ultimately did not arise. Many emerging market assets have fared relatively well compared to history, helped by fiscal discipline and precautionary monetary policy and, therefore, once conditions improve, their recoveries could be fairly swift. As such, while dollar strength should be expected as the Fed continues to hike policy rates, a Fed pause could set the stage for a meaningful rally in global risk assets and the emergence of a more sustainable downward trend for the dollar in 2023.
Summary
Our three leading themes inform the broad investment landscape for 2023 and suggest that, unlike 2022, where stocks and bonds fell together, opportunities will likely be more forthcoming.
Broad equities will likely remain challenged as U.S. recession weighs on earnings growth, yet those same factors should benefit the high-quality segments of core fixed income. While we expect the Federal Reserve will hike rates a few more times in 2023, it is likely nearing the completion of its tightening cycle. This implies that bonds will be able to support portfolios as recession approaches, with government bond yields under downward pressure and securitized debt typically providing mitigation during periods of volatility and risk. Within credit markets, the longer duration, high-quality profile of investment grade should be capitalized. Importantly, credit now offers more attractive yields than in recent years, finally meriting portfolio allocation.
A full China reopening will not happen overnight. Yet a roadmap for an end to China’s stringent COVID- 19 measures, coupled with additional stimulus policies, should provide the catalyst for a significant rebound in Chinese economic activity and risk assets in 2023. The positive impact should extend far, providing a boost to its major trading partners across Europe and particularly Asia. Global commodity prices also stand to benefit.
The U.S. dollar’s bull run has likely been exhausted and, once it has convincingly changed direction, should brighten the relative outlook for both emerging markets and European global risk assets. The relatively attractive valuations outside the U.S. suggest investors stand to gain through global diversification.
While 2023, with its challenges and risks, certainly looks daunting, a clear playbook is beginning to emerge. Diversification across asset classes is both recommended and appealing; inflation mitigation continues to be necessary; and taking advantage of attractively valued global opportunities will likely be rewarded.
Editor’s Note: The summary bullets for this article were chosen by Seeking Alpha editors.
Be the first to comment