

peepo
The Great Moderation, a period of steady growth and inflation, is over, in our view. Instead, we are braving a new world of heightened macro volatility – and higher risk premia for both bonds and equities. This regime has echoes of the early 1980s, so we’re calling our Midyear Outlook Back to a volatile future. We ultimately expect central banks to live with inflation, but only after stalling growth. The result? Persistent inflation amid sharp and short swings in economic activity. We stay pro-equities on a strategic horizon but are now underweight in the short run.
The Great Moderation, from the mid-1980s until 2019 before the Covid-19 pandemic struck, was a remarkable period of stability in both growth and inflation. We were in a demand-driven economy with a steadily growing supply. Borrowing binges drove overheating while collapsing spending drove recessions. Central banks could mitigate both by either raising or cutting rates.
That period has ended, in our view. First, production constraints – stemming from a massive shift in spending and labor shortages – are hampering the economy and driving inflation. Second, record debt levels mean small changes in interest rates have an outsized impact – on governments, households, and companies. Third, we find the hyper-politicization of everything amplifies simplistic arguments, making for poorer policy solutions.
We are bracing for volatility in this new regime – our first theme. Central banks are rushing to raise rates to contain inflation that’s rooted in production constraints. They are not acknowledging the stark trade-off: crush economic growth or live with inflation. The Federal Reserve, for one, is likely to choke off the restart of economic activity – and only change course when the damage emerges. We see this driving high macro and market volatility, with short economic cycles.
Equities would suffer if rate hikes trigger a growth downturn. If policymakers tolerate more inflation, bond prices would fall. Either way, the macro backdrop is no longer conducive for a sustained bull market in both stocks and bonds, we believe. We see higher risk premia across the board and think portfolio allocations will need to become more granular and nimble.
We think we will be living with inflation – our second theme. For all the noise about containing inflation, we see policymakers ultimately living with some of it. We remain overweight equities and underweight government bonds in long-term portfolios. We expect investors to demand more compensation to hold long-term bonds in this new regime. We see a near-term risk of growth stalling and reduce equities to a tactical underweight. We prefer to take risk in credit because we see contained default risk.
We see the bumpy transition to net-zero carbon emissions also shaping the new regime – and believe investors should start positioning for net zero, our third theme. We believe investors can be bullish on both fossil fuels and sustainable assets, as we see a key role for commodities in the transition. Yet our work finds that changing societal preferences can give sustainable assets a return advantage.
End of the Great Moderation
Academics Jim Stock and Mark Watson coined the term Great Moderation in 2002 to describe the period of steadily lower volatility in inflation and activity. Was this combination due to good policy or good luck? For a long time, people thought it was sound policies. Stock and Watson argued it was mostly luck. We think they got it right.
Steadily expanding production capacity and demand shocks were key features of the Great Moderation. Exuberance and borrowing binges drove overheating while souring sentiment and collapsing spending drove recessions. Central banks could mitigate both by raising or cutting rates. The policy response did not involve trade-offs; there was no conflict between stabilizing both. This helped spark a bull market in both bonds and equities.
This is no more, in our view. The chart shows the regime of subdued inflation and output volatility is over. Why is this happening?
Production constraints
Production constraints have been hampering the economy in ways they never did during the Great Moderation. The pandemic triggered a massive sectoral reallocation that has yet to normalize. The key bottleneck has been labor supply, rather than supply chain disruptions. Many people are hesitant to go back to work or are taking longer to find a job in a new sector. The constraints have been exacerbated by the Ukraine war’s energy and food price shocks – and are driving today’s inflation.
We don’t see this changing any time soon. Two powerful structural trends are driving up production costs. First, the pandemic and Ukraine crisis are accelerating geopolitical fragmentation. Think of ongoing sanctions on Russia, the push for energy security and the effort to diversify supply chains. The war is driving the emergence of blocs, and we see U.S.-China tensions increasing.
See our BlackRock geopolitical risk dashboard.
Regime shift
Volatility of U.S. real GDP and core CPI inflation, 1965-2022
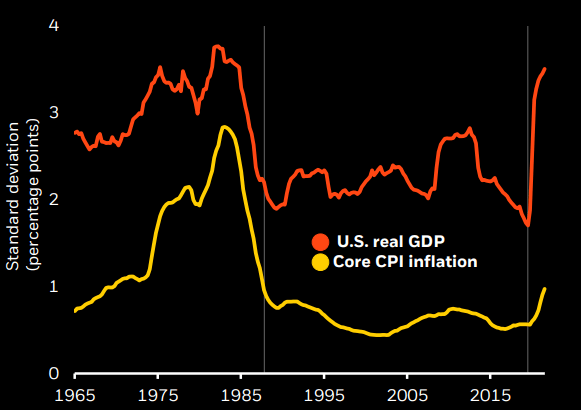
Chart takeaway: The pandemic upended an unusual period of mild volatility in output and inflation (BlackRock Investment Institute, U.S. Bureau of Economic Analysis and U.S. Bureau of Labor Statistics, with data from Haver Analytics, March 2022. Notes: The chart shows the standard deviation of the annualized quarterly change of U.S. real GDP and the core Consumer Price Index.)
Second, the transition to reach netzero carbon emissions by 2050 is likely to create a sectoral shakeout similar to the pandemic. The transition is essentially a handoff from carbon-emitting production methods to zero-carbon ones. This handoff can be rough. Carbonintensive production can fall faster than lower-carbon alternatives are phased in. The result: periods of supply shortages and high prices for the carbon-intensive outputs the economy still needs. We see these imbalances helping drive macro volatility and persistent inflation in years to come.
Unprecedented leverage
In this new world shaped by supply, trade-offs for policymakers become starker – at a time when their maneuvering room has shrunk. Global debt has surged to new highs as governments sought to limit the fallout from the pandemic. This means that small rises in interest rates can have an outsized and painful impact, as the chart shows. The private sector debt is also susceptible to higher rates, especially via housing. All this makes it tougher for central banks to hike rates – and ultimately more tempting to live with inflation.
Politicization of everything
A more complex world needs nuanced discussion to find the best solutions. The problem: Everything has become politicized – and whoever has the loudest or simplest argument often wins. We believe this is helping bring about the end of the Great Moderation.
The political dialogue oversimplifies many topics. This is true for inflation. There is a loud chorus of critics who claim the inflation threat was there for everyone to see: if only central banks had raised rates earlier, we wouldn’t be in this mess. Rather than pushing back on this narrative, central banks have resorted to sounding ever tougher on inflation. They appear to solve for the politics of inflation, not the economics. It is also true for controversial topics like climate change or geopolitics. The populism and extremism on both sides of the discourse are not abating, in our view.
All this implies that policy trade-offs are now much harder. Central banks are likely to veer between favoring growth over inflation, and vice versa. This will result in persistently higher inflation and shorter economic cycles, in our view. The end result: higher risk premia across the board.
Rate sensitivity
U.S. net debt interest payments and scenarios, 1990-2025
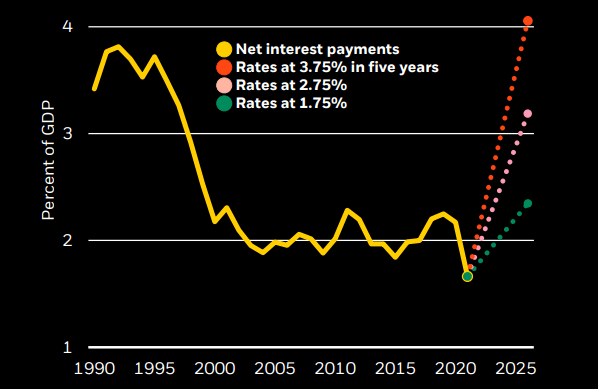
Chart takeaway: The sensitivity of high debt levels to higher interest rates makes it harder to contain inflation via rates. Forward-looking estimates may not come to pass. Past performance is not a reliable indicator of current or future results. (BlackRock Investment Institute, OECD and International Monetary Fund, with data from Haver Analytics, December 2021. Notes: The chart shows historical U.S. net interest payments and projections for U.S. net interest payments based on different interest rate scenarios on a five-year horizon. The scenarios are calculated based on IMF projections of U.S. debt and hypothetical calculations of debt interest costs based on different assumptions for the path of interest rates as indicated in the legend..)
Higher risk premia
The Great Moderation fostered a steady macro backdrop that set the stage for decades-long bull runs for both stocks and bonds. Central banks could soften demand shocks and pump up growth with looser policy – facing only a modest trade-off of inflation (the green line in the chart).
The end of the Great Moderation means the trade-offs become much starker, as the orange line in the chart shows. The entire curve has shifted and lengthened, magnifying the impact of policy decisions. At one extreme (bottom right), central banks crush growth to rein in inflation. This raises recession risk and is particularly damaging for equities. It’s a 2022 story, in our view. At the other extreme, central banks go easy and face the risk of inflation soaring (top left). Bond prices fall as investors demand a higher term premium. We expect this to be the main conundrum for 2023.
Bottom line: We don’t see a repeat of the Great Moderation’s sustained stock-bond bull markets.
Higher term premium
Living with inflation
Risk of deanchored inflation expectations
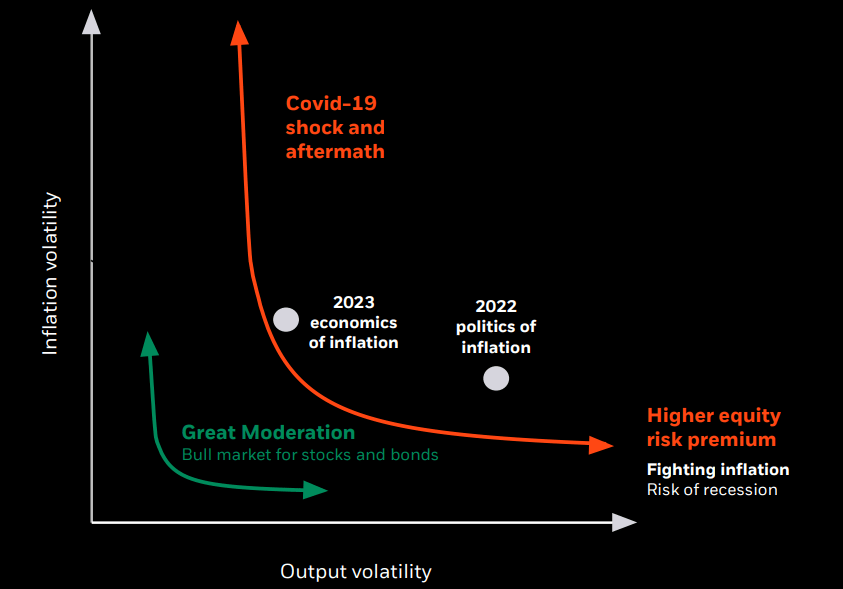
The chart shows a stylized depiction of the volatility of U.S. inflation and output during the Great Moderation (1985-2019; green line) and since the Covid-19 shock (2020 to now; orange line). The curves show potential combinations of output (x-axis) and inflation (y-axis) volatility that can be achieved when central banks react to demand and supply shocks hitting the economy. Since the Covid-19 shock, the underlying volatility of demand and supply shocks has risen, as the orange line shows. This means central banks now face starker trade-offs. They can try to rein in inflation, but this comes at a cost of higher output volatility -the Fighting inflation outcome bottom right. Or they can try to dampen fluctuations in output at the cost of more inflation volatility – the Living with inflation outcome upper left. For illustrative purposes only. (Blackrock Investment Institute, July 2022)
Bracing for volatility
The low market volatility during the Great Moderation was due to that regime’s steady growth and inflation. We argued in 2017 that macro and market volatility regimes are linked. Some saw the low market volatility at the time as a sign of investor complacency – but we pushed back against that view. We saw volatility not having a normal bell curve distribution and behaving as a regime – in this case we break it into four regimes.
We didn’t see market volatility breaking into a higher regime unless macro volatility did as well. Now it has – see the gray bands in the chart – and we could go back to the volatility seen in the 1970s. Periods of low market volatility in this higher volatility regime could indicate investor complacency.
We have laid out why we see the end of the Great Moderation. We see the rewiring of global supply chains and the transition to net zero reinforcing why this is likely to be a more volatile world – and this new regime won’t be temporary.
What are the implications?
- We expect higher risk premia for both equities and bonds.
- This regime is not necessarily one for “buying the dip.” Policy will not quickly step in to stem sharp asset price declines.
- A traditional 60/40 portfolio of stocks and bonds, hedges and risk models based on historical relationships won’t work anymore, we think.
- We believe views should get more granular at the sector level or below. For example, indebted companies may do well if their debt burden is alleviated by persistently higher inflation.
- It is even more important to recognize and overcome behavioral biases, such as inertia, when making big portfolio decisions.
- Market views will have to change more quickly on both tactical and strategic horizons, we believe.
A high-volatility regime
U.S. equity and GDP volatility and regimes shaded, 1970-2022
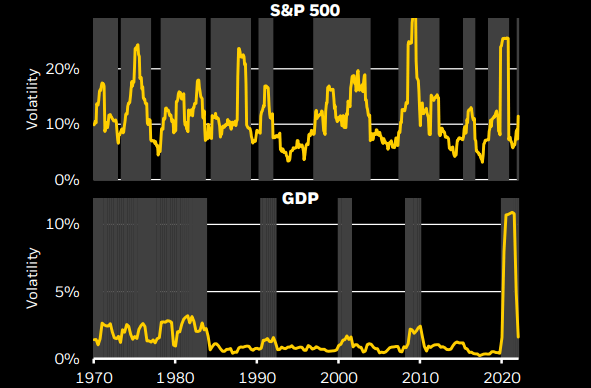
Chart takeaway: A higher macro volatility regime is typically needed to sustain a higher market volatility regime, as we expect. (BlackRock Investment Institute, with data from Haver Analytics, June 2022. Notes: Volatility is calculated as the annualized standard deviation of monthly changes in the S&P 500 over a rolling 12-month period. Using a Markov switching regression model, in the same manner, we did in our 2017 work. Given the severity of macro volatility during the Covid-19 shock, we calculate four volatility regimes. We show only the intermediate, high and extreme volatility regimes in the gray bands, the rest of the periods are regimes of low volatility. These lines plot the average volatility level during each regime based on a broader sample from 1960 to 2022. We use the same regime methodology for U.S. GDP based on annualized quarterly data as of Q1 2022.)
Living with inflation
We are in a world shaped by supply unlike any we have seen in recent decades. Major spending shifts and production constraints are the driving force of inflation rather than excessive demand. Those constraints find their roots in the pandemic and worsened after Russia’s invasion of Ukraine and China’s lockdowns to combat Covid-19. Think of how the war caused a commodities price spike and increased inflation.
Major central banks are jacking up policy rates in a rush to get back to neutral levels that neither stimulates nor restrain activity. The Fed is planning to go further, pencilling in rate hikes that go well intro restrictive territory to near 4% in 2023. The problem: Rate hikes don’t do much against today’s inflation. The Fed has to crush activity in the rate-sensitive part of the economy to bring inflation back to its 2% target. Yet the Fed has so far failed to acknowledge this. The Fed and other central banks face a difficult trade-off: trying to stabilize output or inflation – but not both.
Eventually, we see the Fed living with higher inflation as it sees the effect of its rate hikes on growth and jobs – and it comes under pressure to change course. For now, however, we think the Fed has boxed itself into responding to the politics of inflation, not to the economics of it. This has caused us to reduce portfolio risk.
We will likely see real economic pain – halting the ongoing restart – before the Fed changes course, and there isn’t enough time for incoming data to stop the Fed in its tracks. We see this resulting in the worst of both worlds: persistent inflation amid short economic cycles.
When the macro environment is shaped by production constraints, the Fed and other central banks can’t avoid volatility. With politics and economics shaping their policy priorities over time, central banks will likely add to that volatility. When prioritizing politics over economics, we think the signal from central banks is going to be less useful than during the Great Moderation.
Unprecedented reallocation
Absolute change in U.S. spending shares across categories, 1960-2022
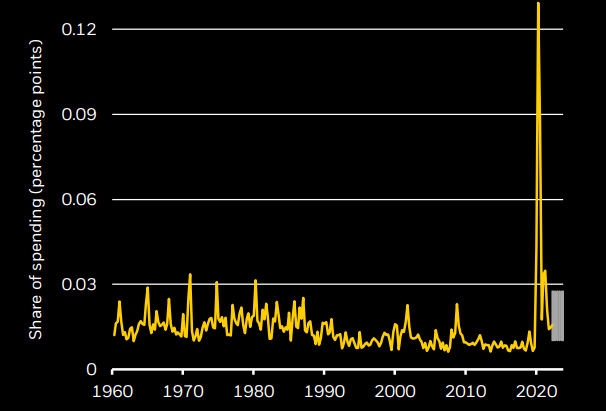
Chart takeaway: The U.S. economy has seen the largest sectoral shift on record as consumer spending moved from services to goods – and has not normalized yet. (BlackRock Investment Institute and U.S. Bureau of Economic Analysis, with data from Haver Analytics, March 2022. Notes: The chart shows the absolute quarterly change in the share of nominal consumer spending across 121 components of U.S. personal consumption expenditure. The spike shows the unusual shift to goods from services during the pandemic. The gray band shows the range of quarterly changes indicating a return to the pre-Covid spending mix over the next 6 to 18 months.)
Positioning for net zero
As an asset manager, our fiduciary role includes helping our clients navigate the net-zero transition and position portfolios to seize the opportunities, be resilient to the risks – and drive returns.
We see an investment case for assets linked to the transition. First – although the current policy isn’t sufficient to achieve net zero by 2050 – we think the transition could accelerate as tech develops, societal preferences shift and the human and economic cost of climate change becomes clearer.
Second, we don’t think markets have fully priced the transition yet. We posited in 2020 that markets would, over time, value assets of companies better prepared for the transition more highly relative to others. We found that some of that repricing had already happened, but we believed there was more to come. See the chart. That belief is reinforced by recent research suggesting our early estimate of the total repricing might have been too conservative.
Investors can get exposure to the transition by investing not only in “already-green” companies but also in carbon-intensive companies with credible transition plans or that supply the materials, equipment, and services needed for the transition. Commodities are a prime example: demand for some transition-critical minerals is expected to grow quickly. Investors may also wish to mitigate the portfolio impact of possible supply constraints: if high-carbon production falls faster than lowcarbon is phased in, it could mean shortages and high prices for highcarbon outputs that economies can’t yet function without. So high carbon exposures can give exposure to the transition and help weather shocks.
Going green and electrifying the power base will be incredibly metals intensive.
– Olivia Markham Portfolio Manager, Natural Resources, BlackRock Fundamental Equity
Transition repricing in progress
Relative returns of green vs. brown sectors, 2016-2025
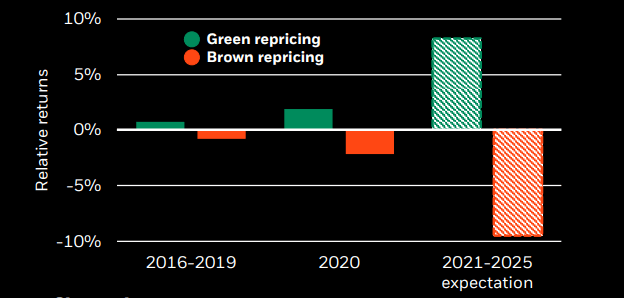
Chart takeaway: We are already seeing green sectors post better relative returns to brown sectors – and think it has room to run. Past performance is no guarantee of current or future results. Forward-looking estimates may not come to pass. (BlackRock Investment Institute, with data from the Center for Research on Security Prices, February 2022. Notes: To estimate climate-driven repricing, we attribute historic returns to two drivers: cashflow news and discount rate ((DR)) news. We then identify the DR news associated with climate change using carbon emission intensity ((CEI)) as a proxy. To isolate the DR component of returns, we apply the standard decomposition formula of Campbell (1991) using a standard factor model of expected returns (which embeds well-known predictors such as value, momentum, and quality). Attribution to climate scores is then given by forecasting regressions of DR news on a measure of CEI. Sector returns are MSCI U.S. sector index-weighted averages of stock level returns. Green represents the technology sector, the most “green” in our work, whereas the utilities sector is the most “brown” in the repricing. The 2016-2019 bars represent the total repricing over this period, and the 2021-2025 expectation is the cumulative repricing we expect over that period. The estimate is highly uncertain and is based on factors including risk premia effects in other long-run transitions such as demographic trends, market pricing of green bonds, and investor survey data on how much return they would be willing to give up to for more sustainable assets. See Sustainability: the tectonic shift transforming investing of February 2020 for details.)
Europe
The war in Europe is the most significant crisis in decades. Food security and energy needs are key concerns. The conflict is likely to be protracted as both sides expand aims, accelerating the rewiring of global ties in a fragmenting world.
Europe has borne the brunt of the energy and commodity surge after the invasion. We see clearer risk of recession as the energy crunch hits real, or inflation-adjusted, incomes.
The European Central Bank (ECB) looks on the brink of a potential policy misstep – insisting that growth can hold up to justify higher rates. We think the ECB will realize its mistake sooner than the Fed. The euro area should feel the economic shock earlier and has a lower starting point of growth than the U.S.
The ECB already tried to offset its own hawkishness with an emergency meeting on its “antifragmentation” tool that aims to contain rising borrowing costs in weak economies. The catalyst? The spread on 10-year Italian bonds is approaching previous stress points, as the chart shows.
It’s not all bad, though. We should not underestimate the strengthened unity of Europe in the face of Russia’s aggression.
Europe has the opportunity to create a more sustainable and more resilient version of itself – replacing high dependencies on Russian energy and shedding the image of an “old” economy by accelerating the green transition. Rising rates aren’t bad for everyone either – euro area bank stocks could get a boost from interest income as rates finally resurface from negative territory.
We are underweight European equities. The energy shock’s toll on growth will weigh on risk assets. We’re neutral government bonds and think market pricing of rate hikes is still too hawkish.
The war in Ukraine will have lasting effects, accelerating geopolitical fragmentation and the emergence of blocs.
– Tom Donilon Chairman – BlackRock Investment Institute
Warning signs
Ten-year government bond yield spreads, 2006-2022
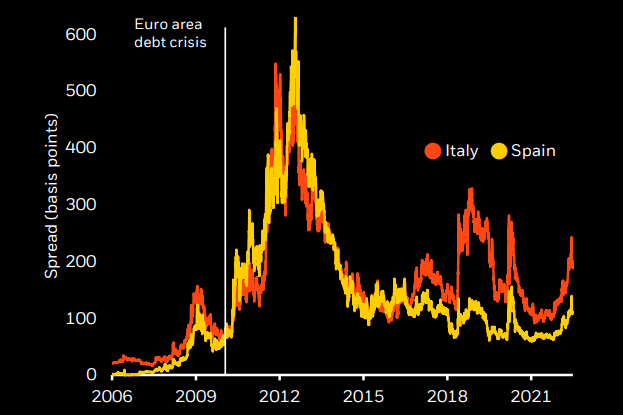
Chart takeaway: Peripheral euro area yield spreads have widened sharply and forced the ECB to consider new tools to counter financial fragmentation. (BlackRock Investment Institute, with data from Refinitiv Datastream, July 2022. Notes. The lines show the spread between Italian and Spanish 10-year government bond yields and German 10-year bund yields.)
EM and China
The old emerging market (EM) investment strategy of buying broad exposure to growth and “cheap” assets needs to evolve, in our view. First, the EM moniker is a misnomer. China stands on its own, and differences between other countries are set to grow. Second, we think the new market regime suggests a focus on economies than can generate income in the rewired global economy versus the old play on growth and capital appreciation. Third, many EM central banks hiked early and to well above pre-Covid levels. Inflation could ease as developed market (DM) central banks tighten policy, giving many EM central banks room to pause hikes before the end of 2022, in our view.
Lastly, EMs are plotting their own course in a world dominated by U.S.-China competition and keeping options open. Many countries didn’t vote on a resolution to expel Russia from the UN Human Rights Council after it invaded Ukraine. See the chart. Many EM nations could become part of a sort of non-aligned movement like in the Cold War.
Our bottom line: Differentiating EMs is more crucial amid new currents of growth, politics, and policy.
China
For China, we see a strong restart of economic activity in the second half as Covid-19 lockdowns ease and the regulatory clampdown on tech and other sectors takes a break. Higher levels of elderly vaccination and more forceful policy support for the economy would be needed for us to upgrade Chinese equities from neutral. We see economic growth below this year’s “about 5.5%” official target.
China’s ties to Russia also have created a new geopolitical concern that requires more compensation for holding Chinese assets, we think.
We need to think of EM in a different way. Safer EM offers a better risk-reward than ‘cheap’ EM.
– Amer Bisat Head of Emerging Markets Fixed Income – BlackRock
EMs plot their own course
UN vote to suspend Russia from Human Rights Council, April 2022
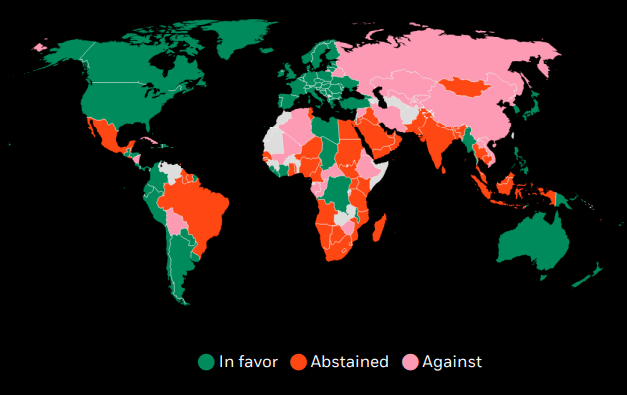
Chart takeaway: We could see many EM nations becoming part of a sort of non-aligned movement reminiscent of the Cold War. (BlackRock Investment Institute, with data from the United Nations, April 2022. Notes: The chart shows how United Nations member countries voted in an April 2022 resolution to suspend Russia from the UN Human Rights Council after it invaded Ukraine. The resolution was adopted with 93 nations voting in favor, 58 abstaining, and 24 against.)
Cutting risk, being nimble
A new regime is taking hold – but we do not see this yet reflected in the pricing of stocks and bonds. Heightened volatility creates greater market mispricing, and this is embodied in our tactical views.
We have repeatedly trimmed risk this year – and do so again now. We have cut DM equities to underweight. The reasons: We see an increasing risk of the Fed overtightening, expect growth to stall, and see earnings estimates as overly optimistic. U.S. stocks make up the bulk of DM equities, and other markets tend to move in synch with the U.S. market. The exception: We are neutral on Japan equities because of still-easy monetary policy and increasing shareholder pay-outs.
We are upgrading credit to overweight, preferring to take risk there rather than in equities. Why? Investors are compensated for owning credit these days. A majority of fixed income assets are yielding 4% or more for the first time in more than a decade. See the chart.
The policy response to the pandemic allowed companies to build up cash buffers and issue longer-term debt at record-low interest rates. We don’t expect a deep recession, so defaults should be manageable.
We stay underweight long-dated U.S. Treasuries as we see the term premium rising. We are overweight inflation-linked bonds, and now prefer the euro area. We now overweight UK gilts as we see the Bank of England turning dovish.
The new regime requires being nimble and frequent tactical changes, we think. For example: spotting the turning point for stocks when markets eye a dovish pivot by central banks
There are far more behavioral biases favoring the status quo than the fear of missing out.
– Emily Haisley Behavioral Finance, BlackRock Risk & Quantitative Analysis
The return of yield
Share of fixed income indices yielding 4% or more, 1999-2022
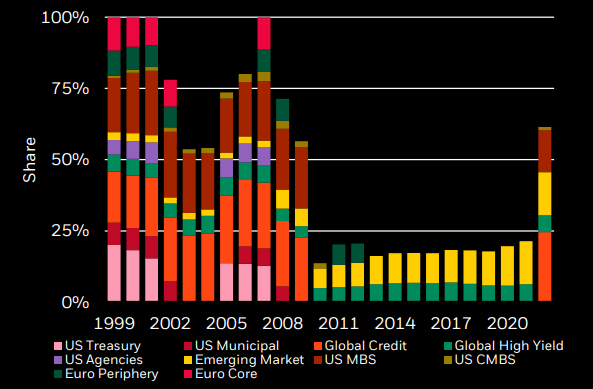
Chart takeaway: A majority of fixed income assets now yield 4% or more for the first time in a decade, making credit more attractive. Past performance is not a reliable indicator of current or future results. Indexes are unmanaged and not subject to fees. It is not possible to invest directly in an index. (BlackRock Investment Institute, with data from Refinitiv Datastream, June 2022. Notes: The bars show market capitalization weights of assets with an average annual yield of over 4% in a select universe that represents about 70% of the Bloomberg Multiverse Bond Index. Euro core is based on French and German government bonds indexes. Euro periphery is based on an average of government debt indexes for Italy, Spain, and Ireland. Emerging markets combine external and local currency debt.)
Preparing for an uncertain future
Our strategic views are constructed with uncertainty explicitly built in. The chart shows how our asset preferences have evolved over the past two years – a period of unprecedented changes.
The year-to-date decline in equities – on the back of recession fears as central banks look set to overtighten policy – has moved against our overweight. Yet since April 2020 – when we switched our preference clearly in favor of stocks over bonds – the MSCI All Country World equity index has outperformed the Bloomberg Global Aggregate index by about 40 percentage points, according to Refinitiv data as of June 2022.
In fixed income, the rise in long-term yields is consistent with the underweight to DM government bonds we have held in our strategic positioning. Also in early 2020, we highlighted how inflation-linked bonds were emerging as a strong preference given the impact of supply-chain disruptions stoking higher inflation.
We see our current stance in favor of equities and inflation-linked bonds over nominal bonds as positioned for the new regime. We see yields rising further, particularly at the long end. We see inflation trending higher over the medium term than markets expect. And we see central banks ultimately living with inflation and not hiking rates as much as markets are pricing in – a likely boost for equities over the long run.
A world of low macro and market volatility would help keep strategic views relatively stable. That’s not the world we see unfolding. Even strategic positions may require more frequent adjustments.
A higher volatility regime means even strategic allocations will likely have to be more dynamic than before.
– Natalie Gill Portfolio strategist – BlackRock Investment Institute
Adapting to the new regime
Evolution of our strategic asset views, 2020-2022
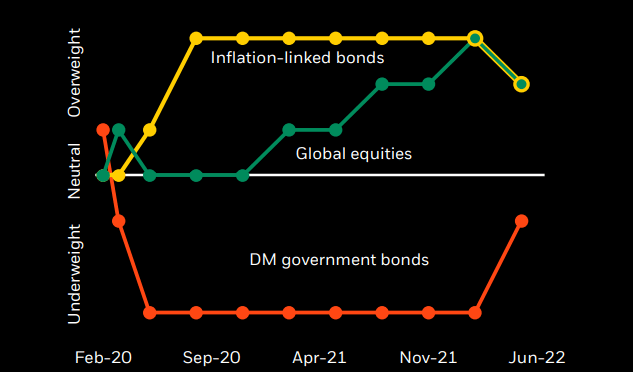
Chart takeaway: Our broad strategic views haven’t changed, but the sharp moves this year prompt us to reduce the size of our tilts. (BlackRock Investment Institute, May 2022. Notes: The chart shows our strategic investment views for U.S. TIPS, global equities, and DM nominal government bonds for a U.S. dollar investor on a 10-year strategic horizon.)
Private markets in a new regime
Private market valuations are not immune in this new regime of higher volatility, in our view. Overall, we see a tougher market environment for some private assets than in recent years, just as we do for public assets.
We believe private assets – while not appropriate for all investors – still have a sizeable role to play in strategic portfolios. Allocations should, on average, be higher than what we typically see in institutional portfolios, in our view. But we think selectivity is more important than ever.
We see both a higher path of policy rates and higher long-term yields over a strategic horizon. This matters most for tech-heavy growth private equity (PE) that has dominated in recent years. Yet ample capital has yet to be deployed. See the chart. We believe this “dry powder” can provide financing options, support the netzero transition in areas like infrastructure and help troubled companies with fresh capital.
We have seen this before. A 2017 paper on PE during the 2008 financial crisis showed how PEbacked companies received capital injections during bouts of public market stress – and increased investments as a result relative to their peers.
Yet better opportunities may be found in private credit, such as gaining exposure to floating-rate debt. Middle-market loans, made to small- and mid-sized companies, are typically floating rate. This makes them attractive when rates are rising, in our view.
Infrastructure assets have the ability to pass on higher prices – key in this environment of persistently higher inflation. We prefer private credit over public on a strategic horizon.
The ability to pick top-performing managers will be more important than ever, in our view, and only some investors will be equipped to do so. We believe central banks are unlikely to provide a backstop to risk assets as they did in the past.
A strong buffer
Private markets “dry powder,” 2000-2022
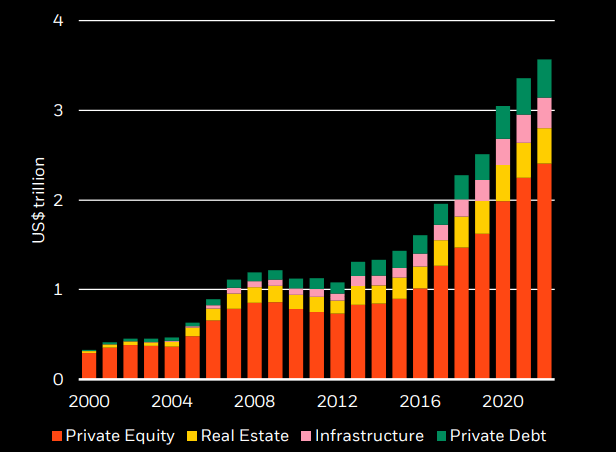
Chart takeaway: Available capital in private markets can provide a buffer to companies during periods of public market stress. (BlackRock Investment Institute and Preqin, June 2022. Notes: Dry powder is committed capital that has not yet been called for investment.)
Ready to shift views
Our conviction is that portfolios will need to change more quickly in a regime of higher volatility. We lay out the factors that could make us tactically change our views.
Positive
- Equities and credit: Decisive dovish pivot from central banks acknowledging the trade-off. Supply bottlenecks ease more quickly, relieving some of the inflation squeeze and taking pressure off central banks. Valuations will likely determine the preference between equities and credit.
- Govt bonds: Dovish pivot as inflation expectations remain well anchored or yields reach levels that make them attractive in a whole-portfolio context.
- Inflation-linked bonds: Supply-driven inflation not receding, and goods inflation stays elevated while services inflation picks up.
- China equities: Greater elderly vaccination and a more forceful policy response to support the economy.
Negative
- Equities and credit: Higher inflation, hawkish policy and poor corporate earnings lasting beyond our tactical horizon.
- Govt bonds: Knee-jerk rallies in bonds and a low term premium despite volatile growth and inflation.
- Inflation-linked bonds: Outright recession drives inflation lower.
This material represents an assessment of the market environment at a specific time and is not intended to be a forecast of future events or a guarantee of future results. This information should not be relied upon as research or investment advice regarding any funds, strategy or security in particular.
This post originally appeared on the iShares Market Insights.
Editor’s Note: The summary bullets for this article were chosen by Seeking Alpha editors.
Be the first to comment