

DjelicS/E+ via Getty Images
Investment Thesis
- I consider Meta Platforms (NASDAQ:META) and Under Armour (NYSE:UA, NYSE:UAA) to currently be attractive investments in terms of risk and reward particularly due to their high free cash flow yield.
- Meta Platforms’ current Free Cash Flow Yield [TTM] is 7.89%.
- Under Armour currently has a Free Cash Flow Yield [TTM] of 14.56%.
- My DCF Models show that both Meta Platforms and Under Armour are currently undervalued.
- I rate both companies as a buy: I consider them to be currently attractive particularly due to their valuation. My opinion is supported by the HQC Scorecard, which rates both companies as very attractive in the categories of Valuation and Expected Return.
- However, due to the risk factors attached, I would recommend not to overweight Meta Platforms or Under Armour in your investment portfolio.
Meta Platforms
With Facebook, Instagram and WhatsApp, Meta Platforms connects people all around the world. In my previous analysis on the company, I discussed its enormous profitability in more detail:
“Meta Platforms’ high EBIT margin of 33.41% is an expression of the enormously strong market position the company holds in the Interactive Media and Services Industry. A Return on Equity of 25.48% shows that the company efficiently uses its shareholder’s equity in order to generate income.”
Additionally, I discussed that Meta Platforms has successfully managed to build its own ecosystem:
“The company has managed to build its own ecosystem through the integration of some of the world’s most popular communication platforms: Facebook, Instagram, Messenger and WhatsApp. Meta Platforms revealed in its 2Q22 report that Facebook alone had an average of 1.97 billion daily active users in June 2022, demonstrating the enormous global usage of just one of its platforms.”
Meta Platforms’ Valuation
In my DCF Model I have assumed a Revenue and EBIT Growth Rate of 5% for the company over the next 5 years. Furthermore, I have assumed a Perpetual Growth Rate of 3% and have used its current discount rate [WACC] of 7.75% and Tax Rate of 16.7%. I used an EV/EBITDA Multiple of 8.7x, which is the company’s latest twelve months EV/EBITDA. The method calculates a fair value of $203.13. The current stock price is $165.28, which results in an upside of 22.90%.
Meta Platforms’ P/E Ratio is 17.21, which is 31.88% below its average of the last 5 years (25.26), thus providing an additional indicator that the company is currently undervalued.
The different valuation methods show that Meta Platforms is currently undervalued, thus confirming my investment thesis that you can currently invest in the company with a higher margin of safety.
Under Armour
In my detailed analysis on Under Armour, I highlighted that the company has found its niche in the sporting goods industry:
“Under Armour found its niche in the sporting goods industry by focusing primarily on American Football. Furthermore, when Under Armour started its business back in 1996, the company focused on making clothes with the aim of improving the performance of athletes. Still today, Under Armour focuses on serving the market niche of performance apparel.”
In the same analysis, I also discussed Under Armour’s endorsement contracts with various athletes:
“In order to strengthen the company’s brand image, Under Armour has agreed endorsement contracts with athletes from various sports. The most significant being with basketball player Stephen Curry in 2013 and American Football quarterback Tom Brady, who signed in 2010. Additionally, Under Armour has agreed a large amount of endorsements with US college teams and universities in order to further strengthen its brand image.”
The fact that Under Armour found its niche in the sporting goods industry in combination with the endorsement contracts it has with athletes, contributes to its competitive advantages over smaller companies with a lower brand value.
Under Armour’s Valuation
In my DCF Model, I have assumed a Revenue Growth Rate and EBIT Growth Rate of 3% over the next 5 years. Furthermore, I have assumed a Perpetual Growth Rate of 3%. I have used Under Armour’s current discount rate [WACC] of 8.75% and Tax Rate of 8.2%. Furthermore, I calculated with an EV/EBITDA Multiple of 8.0x, which is the company’s latest twelve months EV/EBITDA. The method calculates a fair value of $18.13 for the company. At the current stock price, this results in an upside of 106.2%.
Overview: Meta Platforms and Under Armour
|
Meta Platforms |
Under Armour |
|
|
Sector |
Communication Services |
Consumer Discretionary |
|
Industry |
Interactive Media and Services |
Apparel, Accessories and Luxury Goods |
|
Market Cap |
438.77B |
3.87B |
|
Employees |
83,553 |
12,300 |
|
P/E [FWD] Ratio |
16.65 |
16.09 |
|
Revenue [TTM] |
119.41B |
5.68B |
|
Operating Income [TTM] |
39.89B |
524.82M |
|
Revenue Growth [FWD] |
15.13% |
12.55% |
|
Revenue 3 Year [CAGR] |
24.02% |
3.05% |
|
Revenue 5 Year [CAGR] |
29.20% |
3.29% |
|
Gross Profit Margin |
80.47% |
50.36% |
|
EBIT Margin |
33.41% |
9.23% |
|
Return on Equity |
25.48% |
19.13% |
|
Free Cash Flow Yield |
7.89% |
14.56% |
|
Dividend Yield |
– |
– |
Source: Seeking Alpha
The High-Quality Company [HQC] Scorecard
“The HQC Scorecard aims to help investors identify companies which are attractive long-term investments in terms of risk and reward.” Here, you can find a detailed description of how the Scorecard works.
Overview of the Items on the HQC Scorecard
“In the graphic below, you can find the individual items and weighting for each category of the HQC Scorecard. A score between 0 and 5 is given (with 0 being the lowest rating and 5 the highest) for each item on the Scorecard. Furthermore, you can see the conditions that must be met for each point of every rated item.”
Source: The Author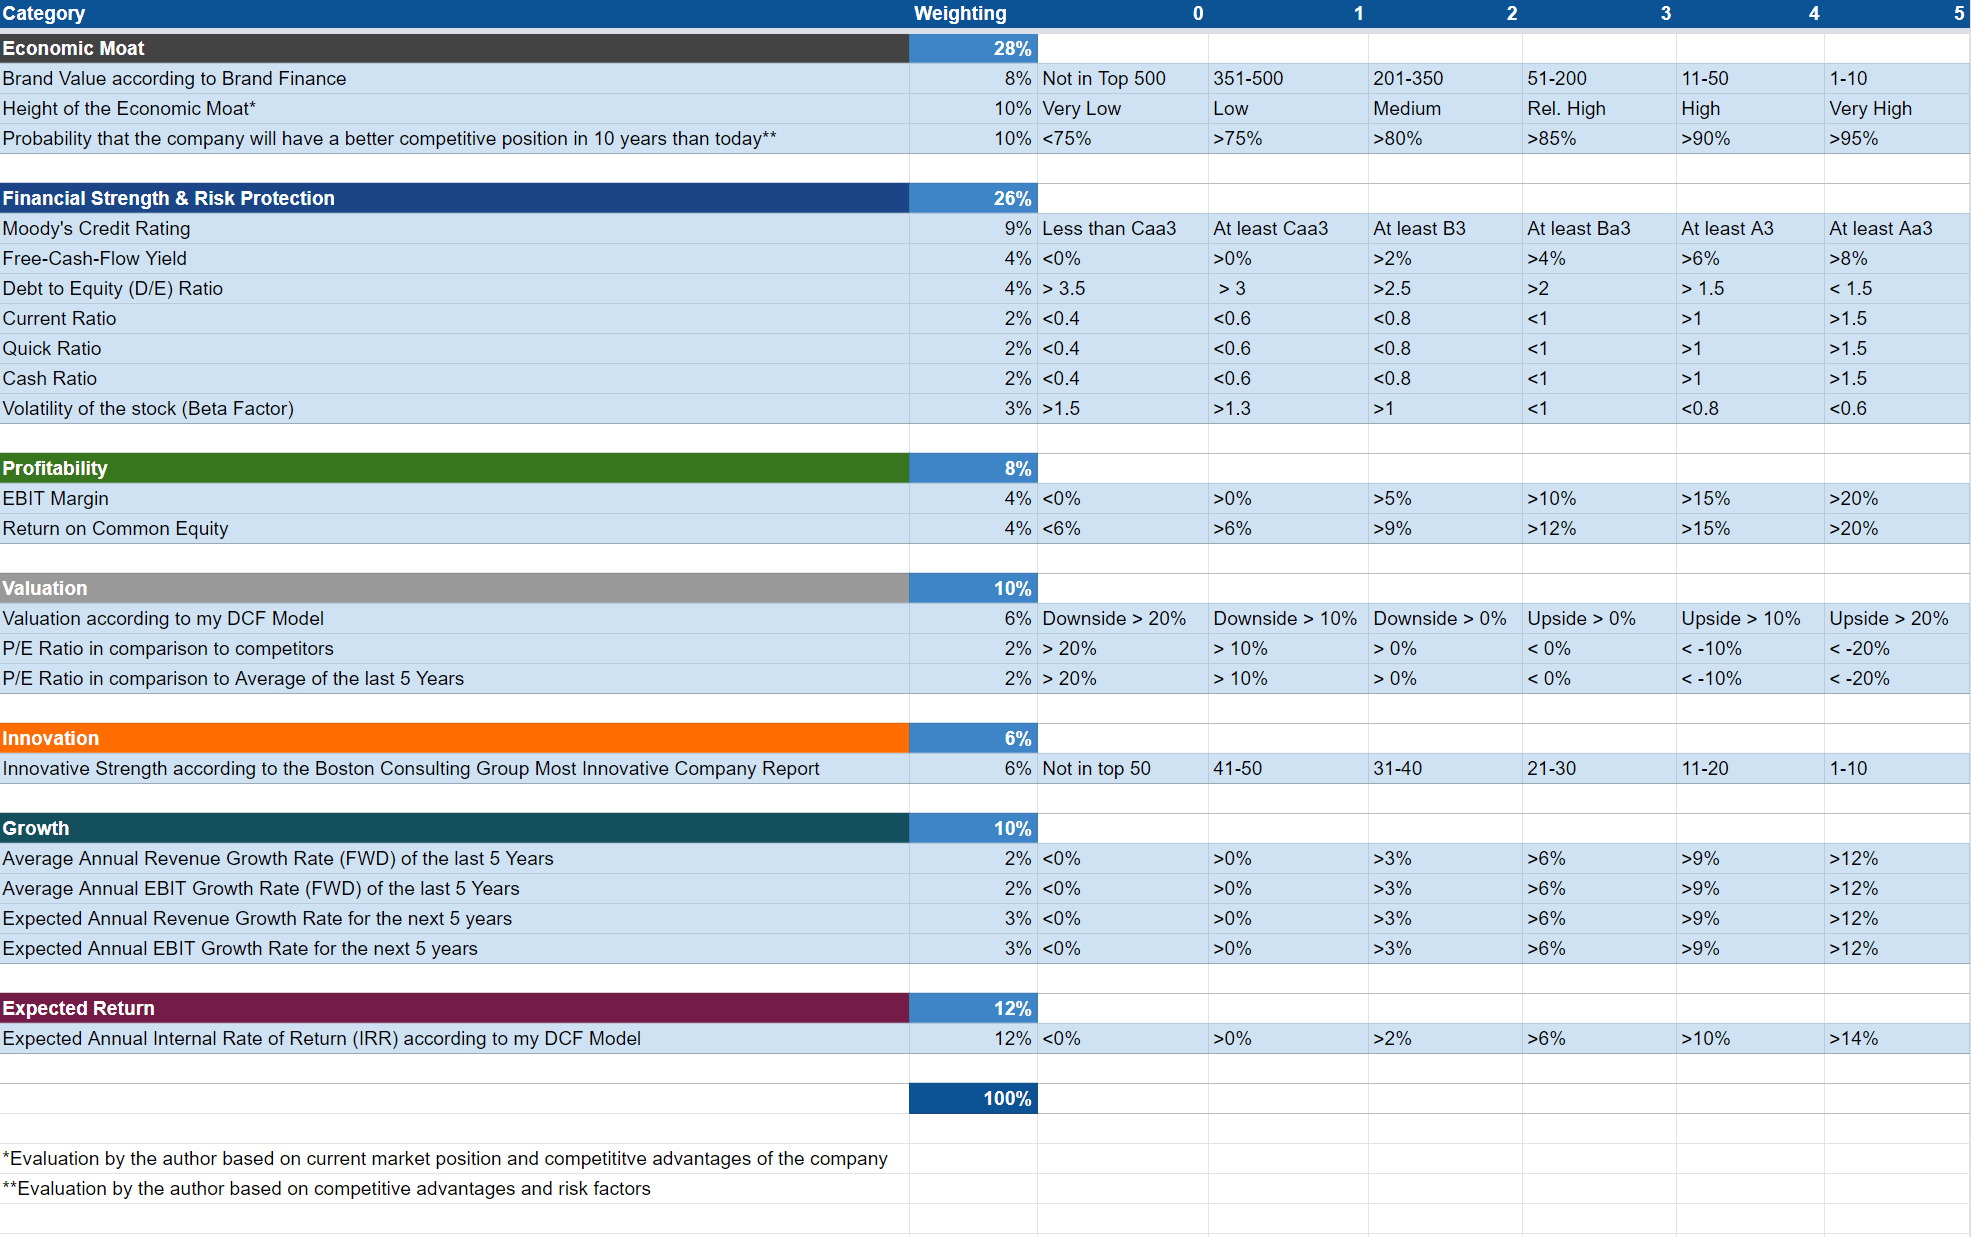
Meta Platforms According to the HQC Scorecard
Source: The Author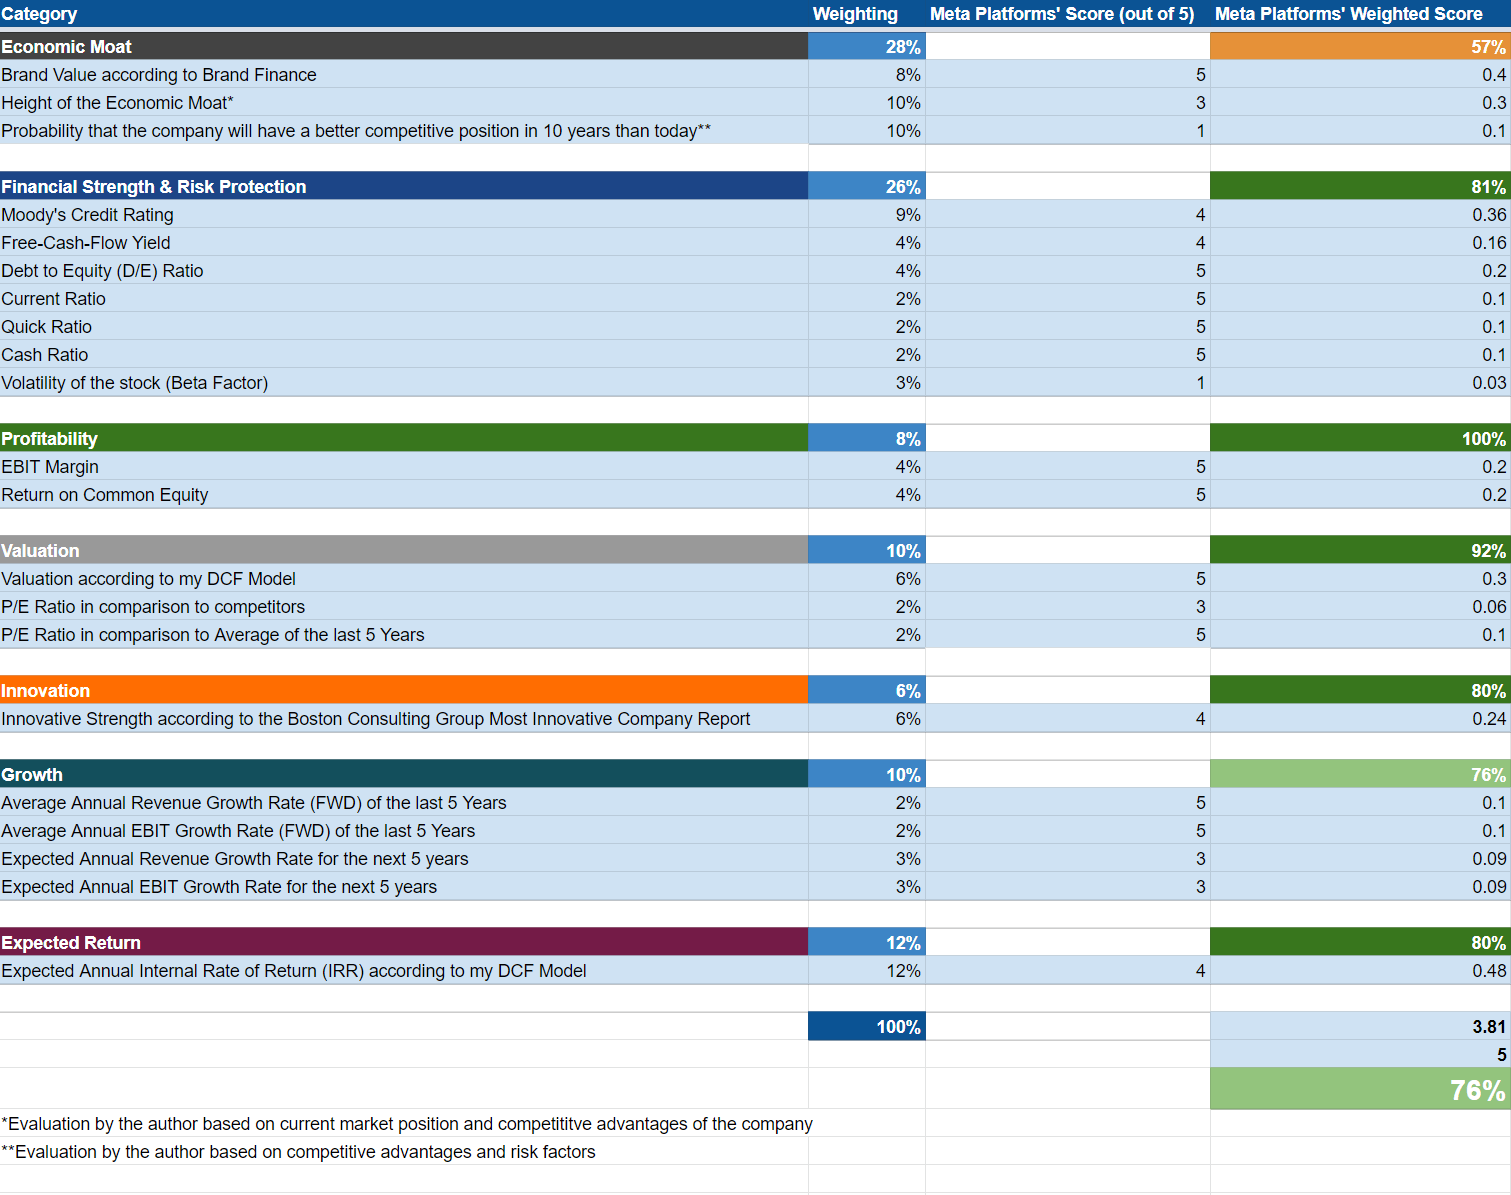
According to the HQC Scorecard, Meta Platforms currently achieves an attractive overall rating in terms of risk and reward (76 out of 100 points).
The company is rated as very attractive in the categories of Profitability (100/100), Valuation (92/100), Financial Strength (81/100), Innovation (80/100) and Expected Return (80/100).
In the category of Growth (76/100), it’s rated as attractive. For Economic Moat (57/100), the company achieves a moderately attractive rating.
This rating as according to the HQC Scorecard strengthens my belief that Meta Platforms is currently a buy.
Under Armour According to the HQC Scorecard
Source: The Author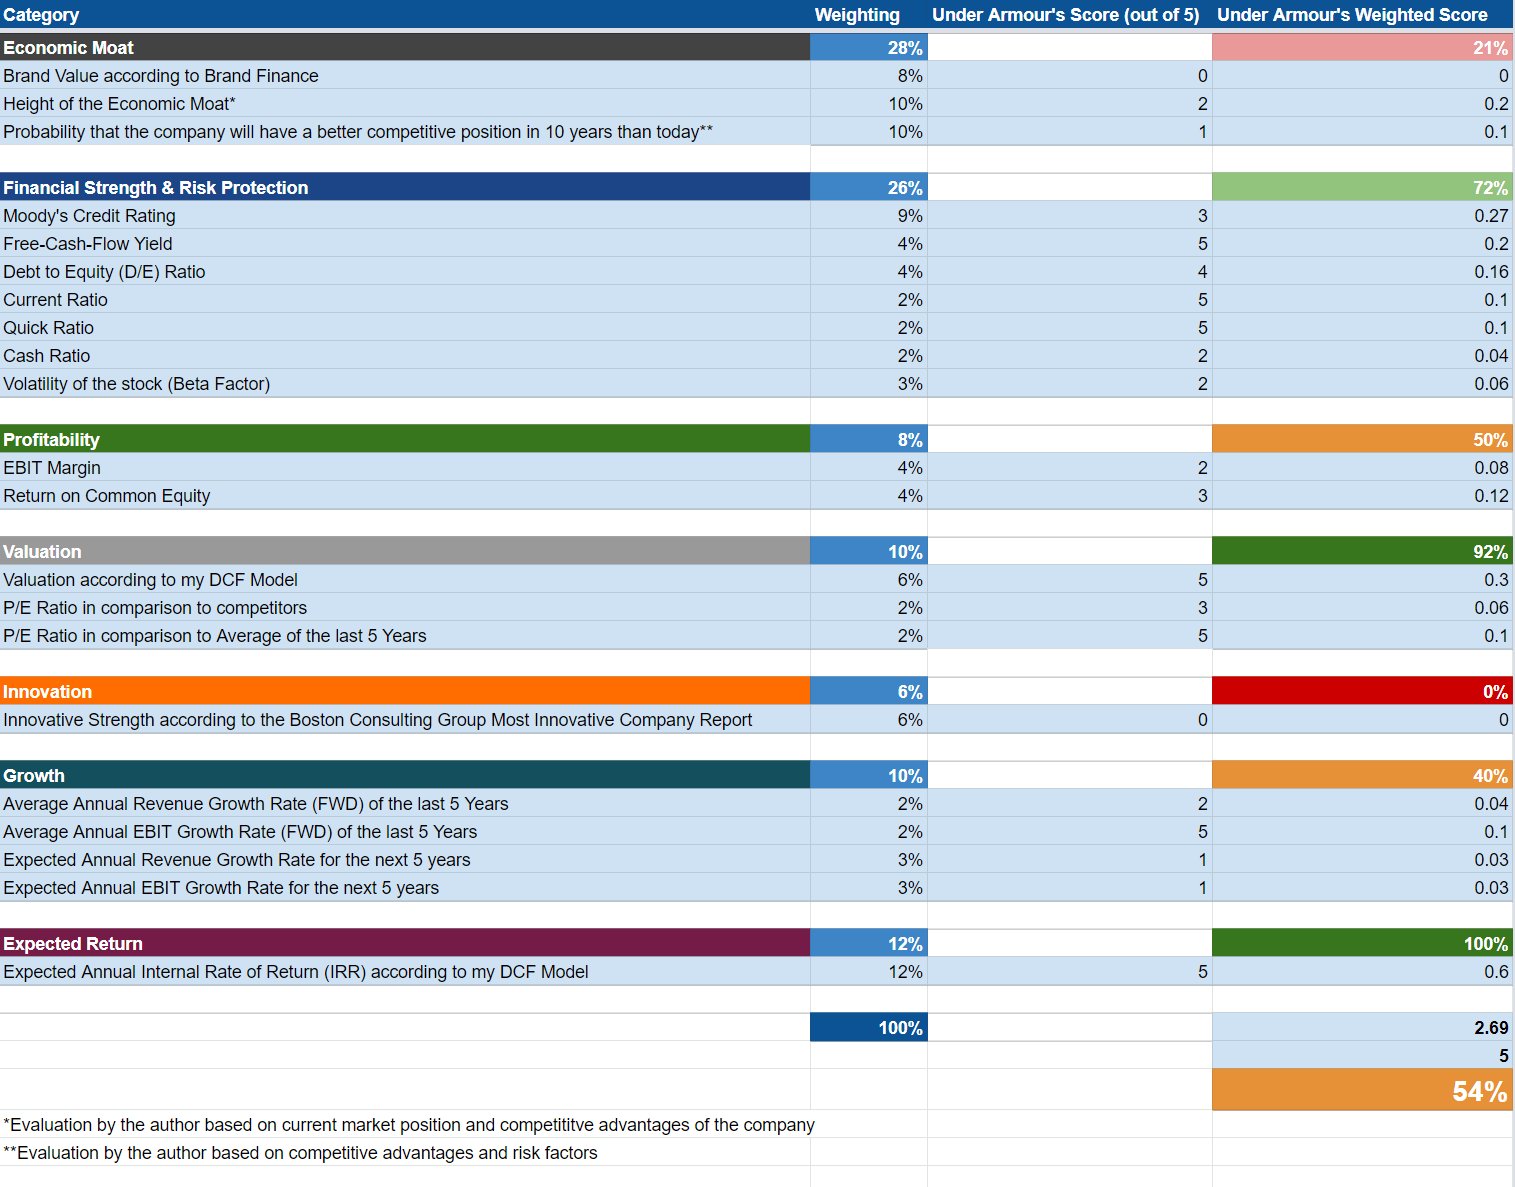
According to the HQC Scorecard, Under Armour achieves a moderately attractive overall rating in terms of risk and reward, with 54 out of 100 points. Two months ago, Under Amour received 56/100 points.
Under Armour is currently rated as very attractive in the categories of Expected Return (100/100) and Valuation (92/100). For Financial Strength, it receives an attractive rating (72/100). The company’s attractive Financial Strength rating is particularly strong due to its high Free Cash Flow Yield (14.56%) as well as its high Current Ratio (2.30) and Quick Ratio (1.56).
For Profitability (50/100) and Growth (40/100), the company gets a moderately attractive rating.
In the category of Economic Moat (21/100), Under Armour only receives an unattractive rating. This is a result of the company’s intense competition with the likes of Nike (NYSE:NKE) and Adidas (OTCQX:ADDDF, OTCQX:ADDYY).
This rating strengthens my belief that the company is currently an appealing prospect, particularly due to its attractive Valuation. However, an only moderately attractive overall rating underlines my opinion not to overweight the Under Armour position in an investment portfolio.
Risk Factors
In my previous analysis on Meta Platforms, I discussed in more detail the potential risks attached to an investment in the company:
“One of the biggest risk factors I see regarding an investment in Meta Platforms is that the company derives almost 98% of its revenue from advertising in Facebook and Instagram. As a result, the company is particularly dependent on its advertising revenue and even more so than, for example, its competitor Alphabet (NASDAQ:GOOG) (NASDAQ:GOOGL). Alphabet derives about 80% of its revenue from advertising, as I showed in my analysis on the company. The loss of marketers as well as a reduction in customer spending on marketing would significantly impact the company’s business results and thus result in declining profit margins.”
In my analysis on Under Armour, I highlighted that I see the intense competition with Nike and Adidas as being one of the main risk factors:
“One of the main risk factors I see for Under Armour is the fact that the market for apparel and footwear is extremely competitive. Under Armour competes with Nike and Adidas, who have both established strong brand images. From my point of view, the existence of two strong competitors such as Nike and Adidas is the biggest risk factor for Under Armour. This intense competition could result in a loss of Under Armour’s market share and furthermore could result in a decrease of the company’s revenue and profit margin. Additionally, Under Armour competes with companies such as PUMA (OTCPK:PMMAF) and Lululemon Athletica (NASDAQ:LULU) as well as with smaller and regional companies who may have local brands with stronger recognition regionally than Under Armour.”
Due to these risk factors, I would recommend not overweighting the companies in your investment portfolio.
The Bottom Line
Meta Platforms’ currently high Free Cash Flow Yield [TTM] of 7.89% shows that the stock price is no longer based on high growth expectations. It’s also an indicator that you can currently invest in Meta Platforms with a higher margin of safety compared to previous years.
Under Armour’s current Free Cash Flow Yield [TTM] of 14.56% can also be interpreted in a way that high growth expectations are no longer priced into its stock.
As shown in the risk section of this analysis, I see Meta Platforms’ dependency on its advertising revenue with Facebook and Instagram as one of the main risk factors. Regarding Under Armour, the intense competition with leading manufacturers Nike and Adidas is the main risk factor.
Due to the risk factors mentioned in this analysis, I would recommend that you don’t overweight the stock of both Meta Platforms and Under Armour in an investment portfolio; however, I do rate both companies as a buy: particularly due to their current high free cash flow yield.
Be the first to comment