

Deagreez/iStock via Getty Images
This has been a scary time for investors, not just because of the relatively fast declines in stocks.
Ycharts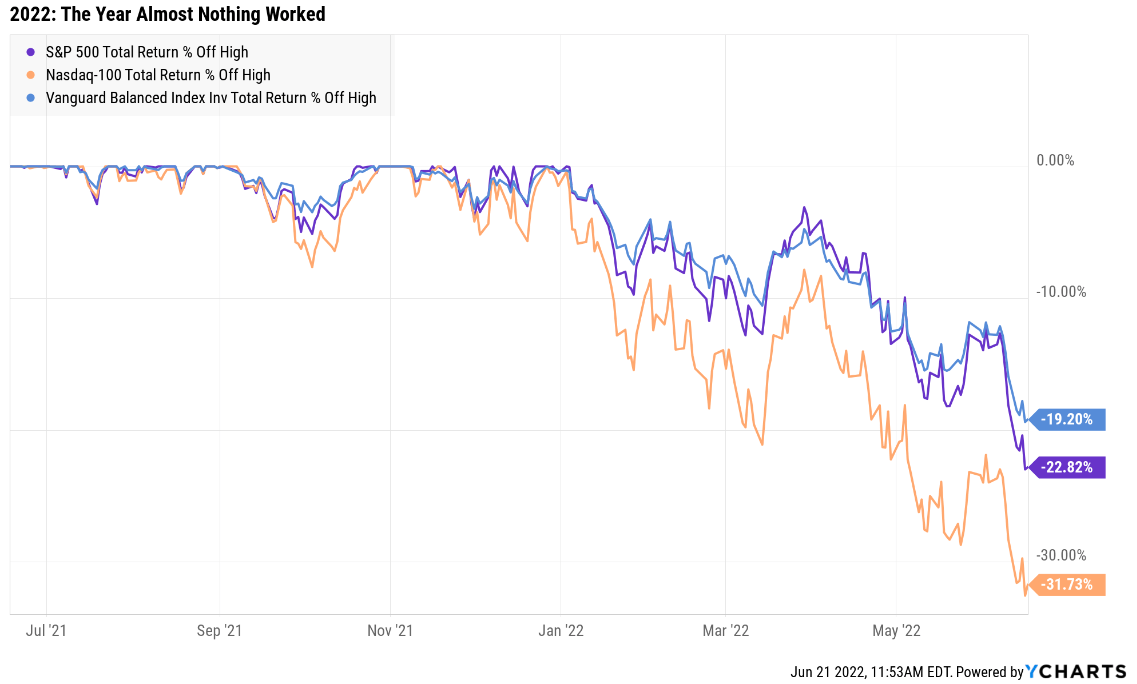
Not only have stocks been falling fast and hard, including an 11.2% decline in the last two weeks, but soaring interest rates have created the worst bond bear market in history.
- a 60/40 retirement portfolio is down 19%, nearly as bad as the S&P 500
The good news is that when the Fed pivots, the market will likely bottom.
The bad news is that the Fed can’t pivot until inflation starts coming down quickly.
The good news is that’s expected to happen pretty soon, according to the futures commodity market.
Daily Shot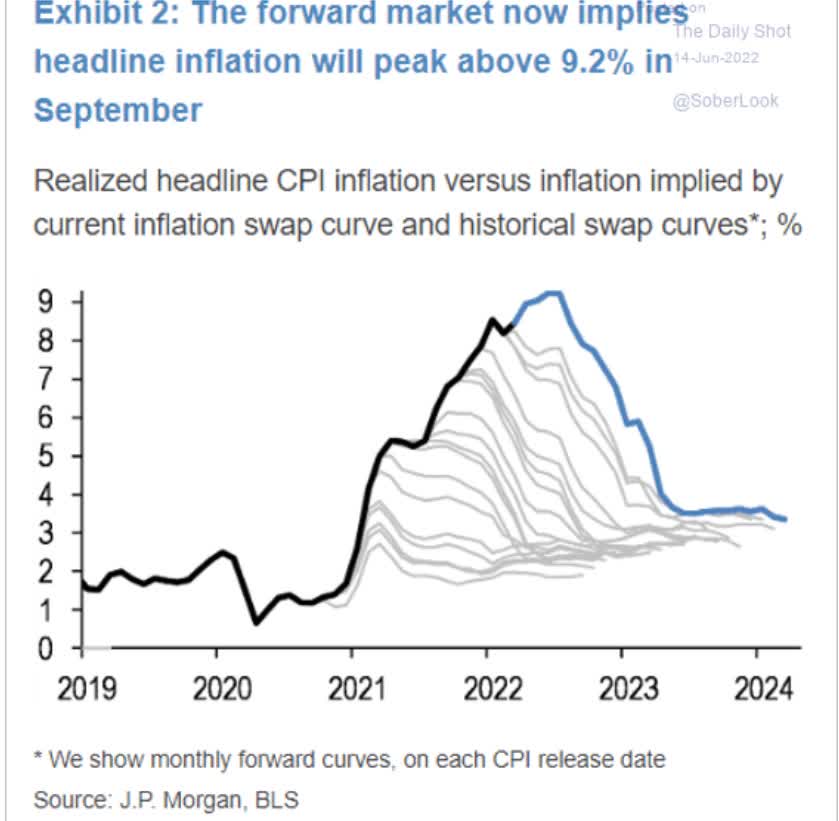
The bad news is that so far inflation has surprised the futures, bond, and stock markets, and it’s possible that inflation doesn’t come down as fast as the blue-chip consensus or Fed currently expects.
- The consensus Case-Shiller home price index for the next month is 21.9% vs 21.2% last month and 20% the month before that.
- Housing prices tend to show up fully in the inflation reports 12 months after peaking.
- 33% of CPI is housing.
Throw in the potential for Russian oil sanctions to keep crude prices at $130 for a year (per Goldman) and food prices to remain high due to the war, and we could very well see the Fed remain hawkish longer than expected.
So, does that mean stocks are uninvestable for new money until inflation starts coming down?
Actually, no, because no one knows when the market will actually price in this perfect storm of pessimism.
| Time Frame |
Historically Average Bear Market Bottom |
| Non-Recessionary Bear Markets Since 1965 |
-21% (Achieved May 20th) |
| Median Recessionary Bear Market Since WWII |
-24% (Citigroup base case with a mild recession) – June 16th |
| Non-Recessionary Bear Markets Since 1928 |
-26% (Goldman Sachs base case with a mild recession) |
| Average Bear Markets Since WWII |
-30% (Morgan Stanley base case) |
| Recessionary Bear Markets Since 1965 |
-36% (Bank of America recessionary base case) |
| All 140 Bear Markets Since 1792 | -37% |
| Average Recessionary Bear Market Since 1928 |
-40% (Deutsche Bank, Bridgewater, SocGen Severe Recessionary base case) |
(Sources: Ben Carlson, Bank of America, Oxford Economics, Goldman Sachs)
Citi and Goldman think the market might have already priced in a mild recession next year.
- The 1991 recessionary bear market (caused by high energy prices) bottomed at -21%
- The 1954 recessionary bear market was a 15% correction (not even a bear market)
- The 1980 bear market (the Fed hiking to 20%) saw stocks fall 24% before bottoming
Is the most likely outcome that stocks might fall a bit more? Yes, probably 5% to 15% more.
- A 10% decline from here would earn you an extra 11% total returns
- 0.2% more per year over 30 years
This is why it’s so dangerous to try to time the market, which is great in theory and nowhere else.
- The average bear market rally is a 67% retracement of the most recent decline
- So, a 13% rally off a 20% decline, for example
Daily Shot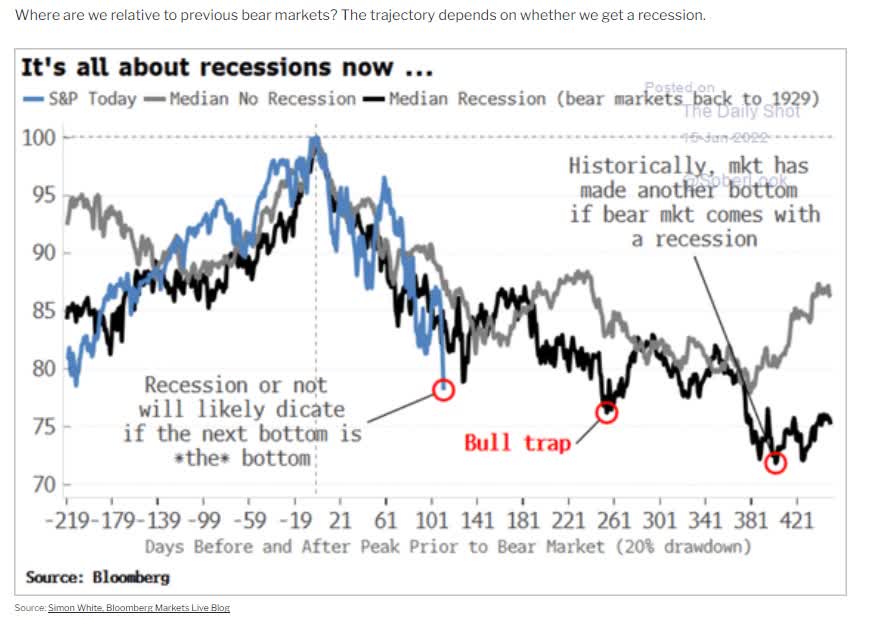
If we avoid a recession, then the -24% we hit on June 16th would historically be a potential bottom.
If we don’t avoid recession, then we should potentially expect one more bear market rally. Though, every bear market is different and we had six bear market rallies in the tech crash and five in the Great Recession.
Here’s what I can tell you with high confidence.
“Fortunes are made in bear markets.” – Todd Sullivan
It’s always and forever a market of stocks, not a stock market. There are world-class dividend blue-chips that are pricing in a recession and then some.
Lowe’s (LOW) and Legal & General (OTCPK:LGGNY) are just two examples of deeply undervalued dividend blue-chips that are coiled springs.
Just how tightly coiled are they? Analysts expect 40+% total returns… in the next year alone.
But while analysts are often overly bullish on individual companies, these two dividend blue-chip bargains actually justify 40+% single-year returns.
And of course, over the next 5+ years, they could deliver far better returns than that.
So let me show you why Legal & General and Lowe’s are two blue-chip bargains that you can safely buy today, with high confidence that they can help you feel like a stock market genius in 5+ years.
Legal & General: One Of The Best Insurance Companies You’ve Never Heard Of
A full deep-dive analysis of LGGNY’s long-term thesis, risk profile, growth potential, valuation, and total return potential: Legal & General: One Of The Best 6.5% Yielding Blue-Chips You’ve Never Heard Of
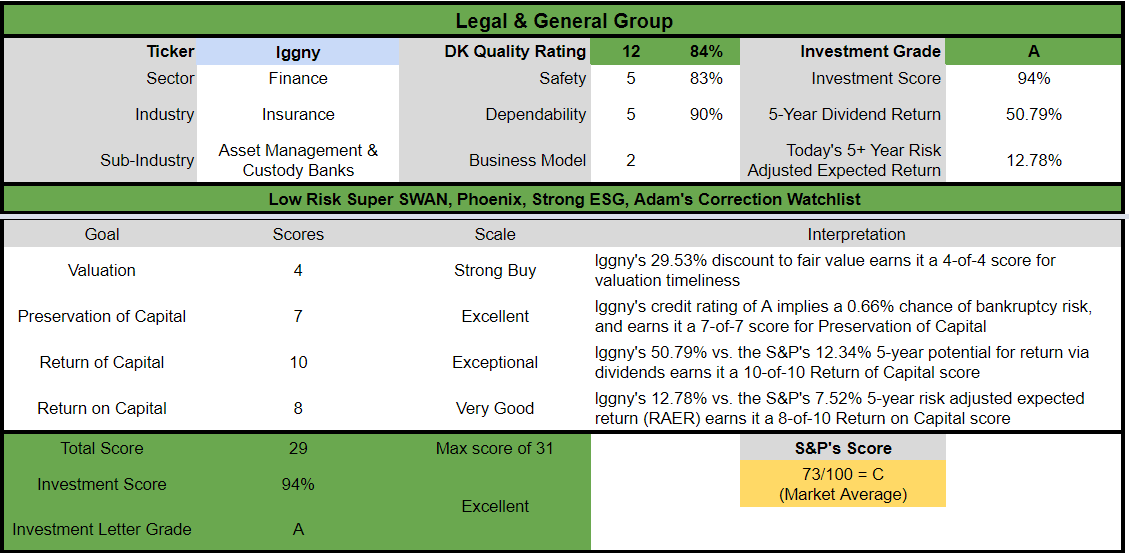
Reasons To Potentially Buy LGGNY Today
- 84% quality low-risk 12/13 Super SWAN insurance company/asset manager
- 83% dividend safety score
- 8.1% very safe yield
- zero tax withholdings (UK company)
- 10-year dividend growth streak
- 0.5% average recession dividend cut risk
- 1.9% severe recession dividend cut risk
- 29% undervalued (potential strong buy)
- Fair Value: $21.53
- 7.4X forward earnings vs 10X to 11.5X historical
- A stable credit rating = 0.66% 30-year bankruptcy risk
- 84nd industry percentile risk management consensus = very good
- 4% to 12% CAGR margin-of-error growth consensus range
- 5.1% CAGR median growth consensus
- 5-year consensus total return potential: 13% to 17% CAGR
- base-case 5-year consensus return potential: 17% CAGR (more than 2X S&P consensus)
- consensus 12-month total return forecast: 40%
- Fundamentally Justified 12-Month Returns: 48% CAGR
LGGNY is so undervalued at its current anti-bubble recessionary valuation that it could fundamentally soar 50% and merely return to fair value.
- analysts expect a 40% return in the next year
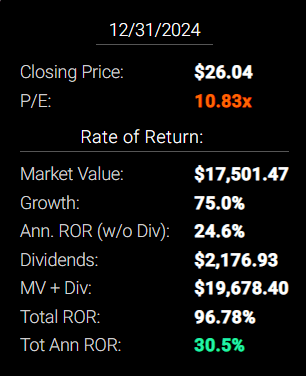
LGGNY 2024 Consensus Total Return Potential
If LGGNY grows as analysts expect by 2024, it could deliver 95% total returns or 31% annually.
FAST Graphs, FactSet FAST Graphs, FactSet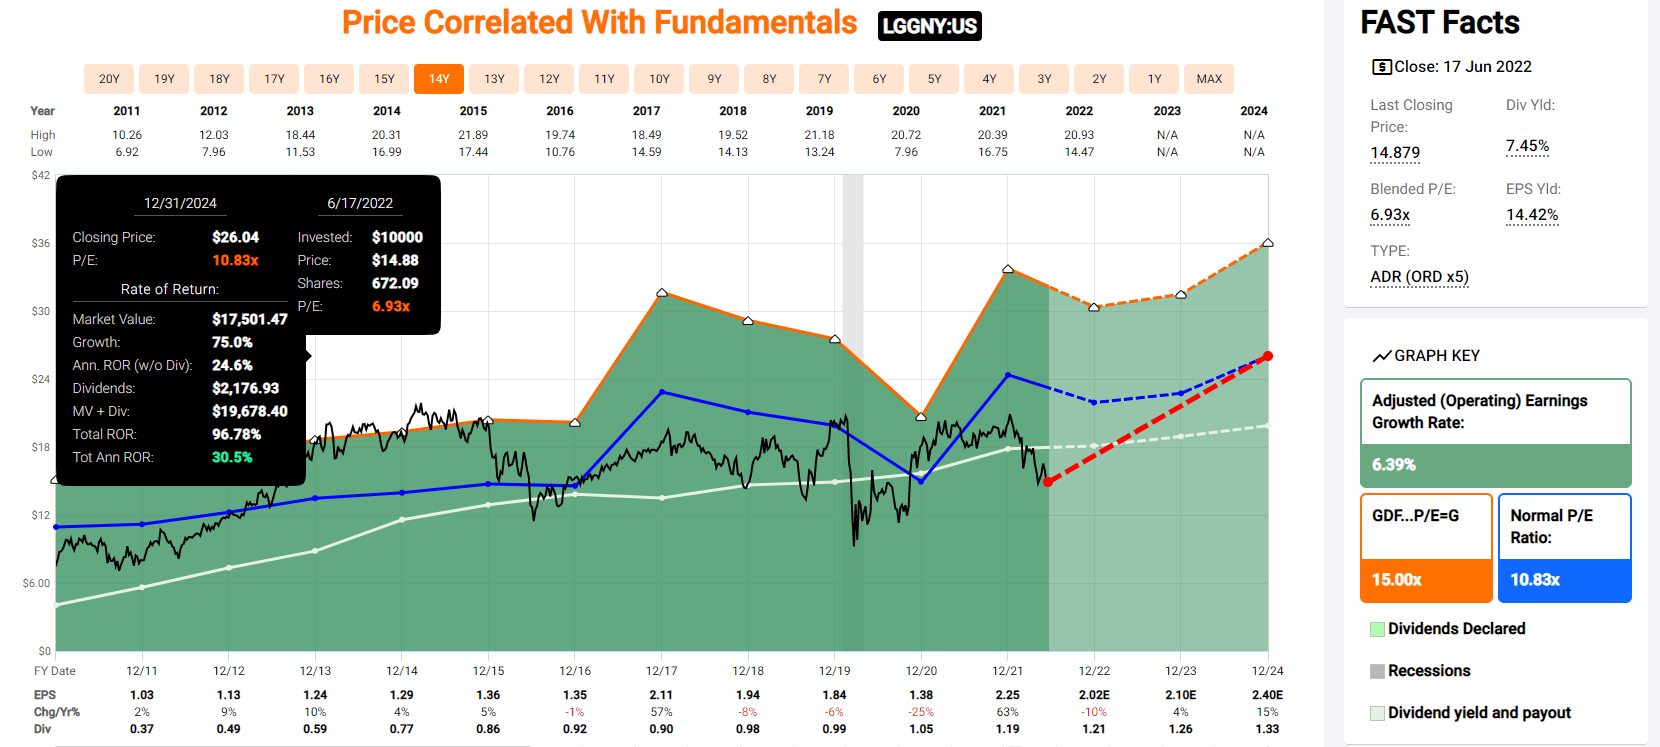
- Buffett-like returns from a safe ultra-high-yield blue-chip bargain hiding in plain sight
LGGNY 2027 Consensus Total Return Potential
FAST Graphs, FactSet FAST Graphs, FactSet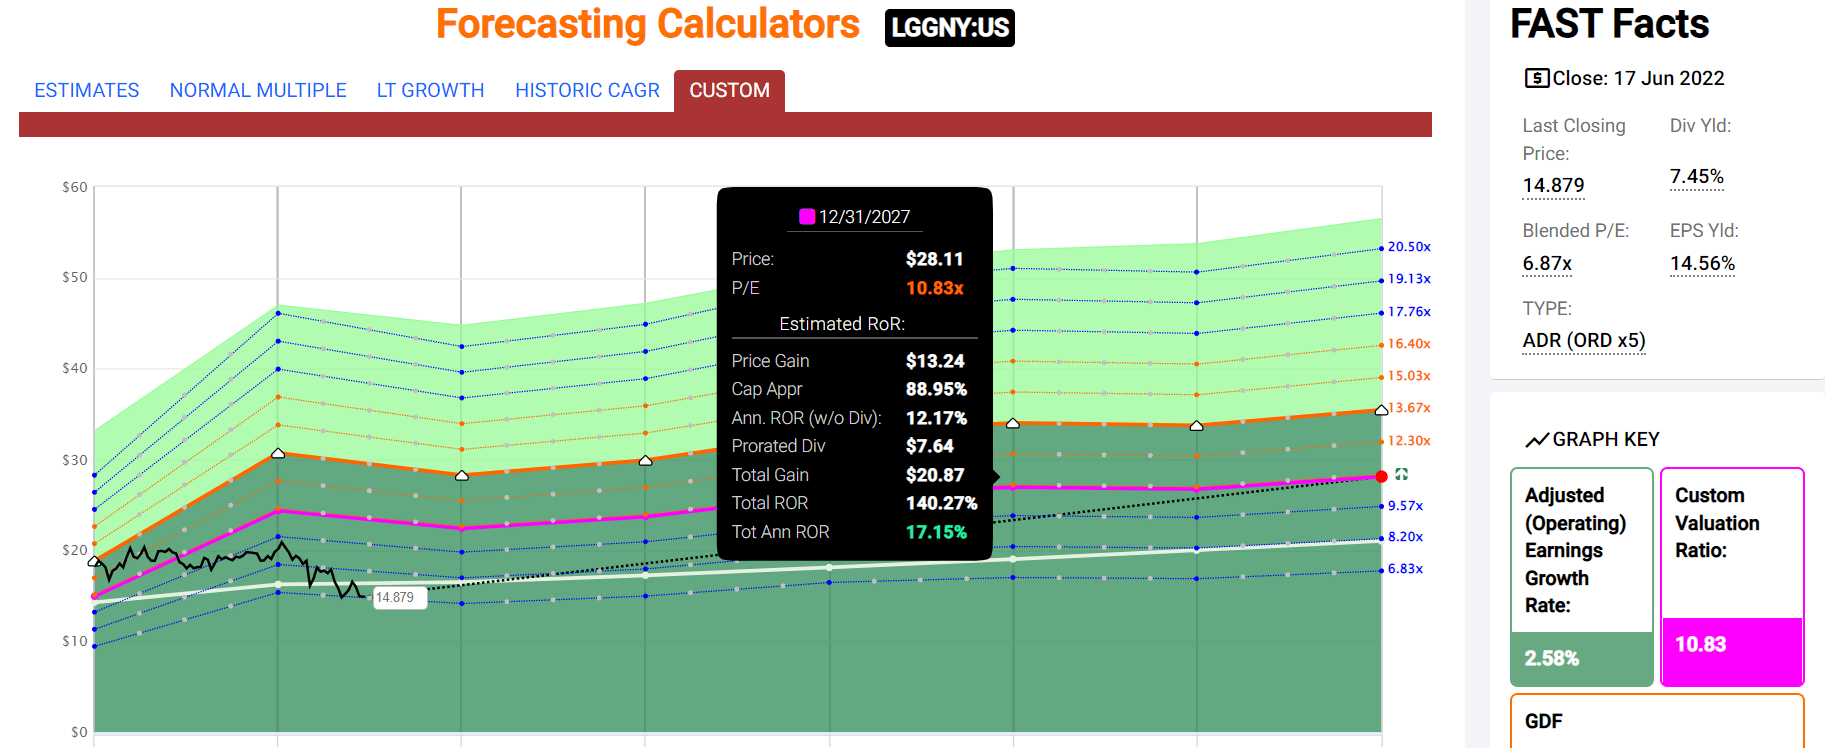
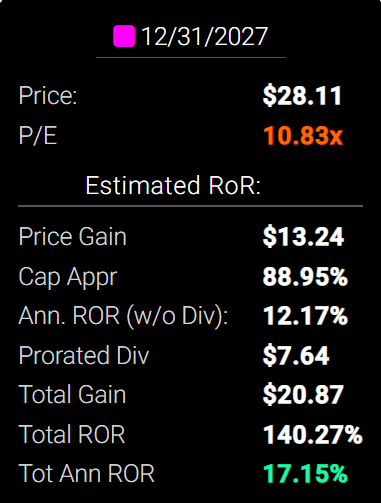
By 2027 if LGGNY grows as expected and returns to historical fair value, it could deliver 140% total returns or 17% annually.
- more than 2X the S&P 500 consensus
- Buffett-like return potential
LGGNY Long-Term Consensus Total Return Potential
| Investment Strategy | Yield | LT Consensus Growth | LT Consensus Total Return Potential | Long-Term Risk-Adjusted Expected Return | Long-Term Inflation And Risk-Adjusted Expected Returns | Years To Double Your Inflation & Risk-Adjusted Wealth |
10-Year Inflation And Risk-Adjusted Expected Return |
| Legal & General | 8.1% | 5.1% | 13.2% | 9.2% | 6.8% | 10.6 | 1.93 |
| Safe Midstream | 6.3% | 6.4% | 12.7% | 8.9% | 6.4% | 11.2 | 1.86 |
| High-Yield | 3.1% | 12.7% | 15.8% | 11.1% | 8.6% | 8.4 | 2.28 |
| REITs | 2.8% | 6.5% | 9.3% | 6.5% | 4.0% | 17.8 | 1.49 |
| Dividend Aristocrats | 2.4% | 8.5% | 10.9% | 7.6% | 5.2% | 14.0 | 1.65 |
| S&P 500 | 1.8% | 8.5% | 10.3% | 7.2% | 4.7% | 15.2 | 1.59 |
(Sources: Morningstar, FactSet, YCharts)
Analysts expect LGGNY to significantly outperform almost every ultra-high yield investment strategy as well as the dividend aristocrats, and S&P 500 over the long term.
Inflation-Adjusted Consensus Return Potential: $1,000 Initial Investment
| Time Frame (Years) | 7.6% CAGR Inflation-Adjusted S&P Consensus | 8.4% Inflation-Adjusted Aristocrats Consensus | 10.7% CAGR Inflation-Adjusted LGGNY Consensus | Difference Between Inflation-Adjusted LGGNY Consensus Vs S&P Consensus |
| 5 | $1,445.67 | $1,493.29 | $1,664.66 | $218.99 |
| 10 | $2,089.97 | $2,229.92 | $2,771.11 | $681.13 |
| 15 | $3,021.42 | $3,329.92 | $4,612.96 | $1,591.54 |
| 20 | $4,367.98 | $4,972.54 | $7,679.02 | $3,311.04 |
| 25 | $6,314.67 | $7,425.45 | $12,782.99 | $6,468.32 |
| 30 | $9,128.95 | $11,088.36 | $21,279.38 | $12,150.43 |
(Source: DK Research Terminal, FactSet)
If LGGNY grows at 5.1% over time, as analysts expect, and its dividend grows in line, investors can expect 21X inflation-adjusted returns over 30 years.
| Time Frame (Years) | Ratio Aristocrats/S&P Consensus | Ratio Inflation-Adjusted LGGNY Consensus vs S&P consensus |
| 5 | 1.03 | 1.15 |
| 10 | 1.07 | 1.33 |
| 15 | 1.10 | 1.53 |
| 20 | 1.14 | 1.76 |
| 25 | 1.18 | 2.02 |
| 30 | 1.21 | 2.33 |
(Source: DK Research Terminal, FactSet)
Which is more than 2X what analysts expect from the S&P 500 and dividend aristocrats.
LGGNY Investment Decision Score
DK Dividend Kings Automated Investment Decision Tool
For anyone comfortable with its risk profile, LGGNY is one of the most reasonable and prudent ultra-high-yielding blue-chips you can buy today.
- 30% discount vs. 8% market discount = 22% better valuation
- 8.1% yield is almost 5X higher (and safer too).
- potentially 30% higher long-term return potential than S&P 500 overtime
- almost 2X better risk-adjusted expected return over the next five years
- 51% of your investment repaid in consensus dividends over the next five years (4X more than the S&P 500)
Lowe’s: A Deep Value Hyper-Growth Dividend King
A full deep-dive analysis of LOW’s long-term thesis, risk profile, growth potential, valuation, and total return potential: Lowe’s: One Of The World’s Greatest Dividend Aristocrats Is On Sale
Reasons To Potentially Buy LOW Today
- 100% quality low-risk 13/13 Ultra SWAN dividend king
- 3rd highest quality company on the DK 500 Masterlist
- 100% dividend safety score
- 60-year dividend growth streak
- 2.4% very safe yield
- 0.5% average recession dividend cut risk
- 1.0% severe recession dividend cut risk
- 14% undervalued (potential strong buy)
- Fair Value: $279.63
- 12.8X forward earnings vs 19X to 21X historical
- 10.1X cash-adjusted earnings
- BBB+ stable credit rating = 5% 30-year bankruptcy risk
- 87th industry percentile risk management consensus = very good
- 13% to 24% CAGR margin-of-error growth consensus range
- 22.8% CAGR median growth consensus
- 5-year consensus total return potential: 20% to 24% CAGR
- base-case 5-year consensus return potential: 24% CAGR (6X S&P consensus)
- consensus 12-month total return forecast: 62%
- Fundamentally Justified 12-Month Returns: 65% CAGR
LOW 2024 Consensus Total Return Potential
FAST Graphs, FactSet FAST Graphs, FactSet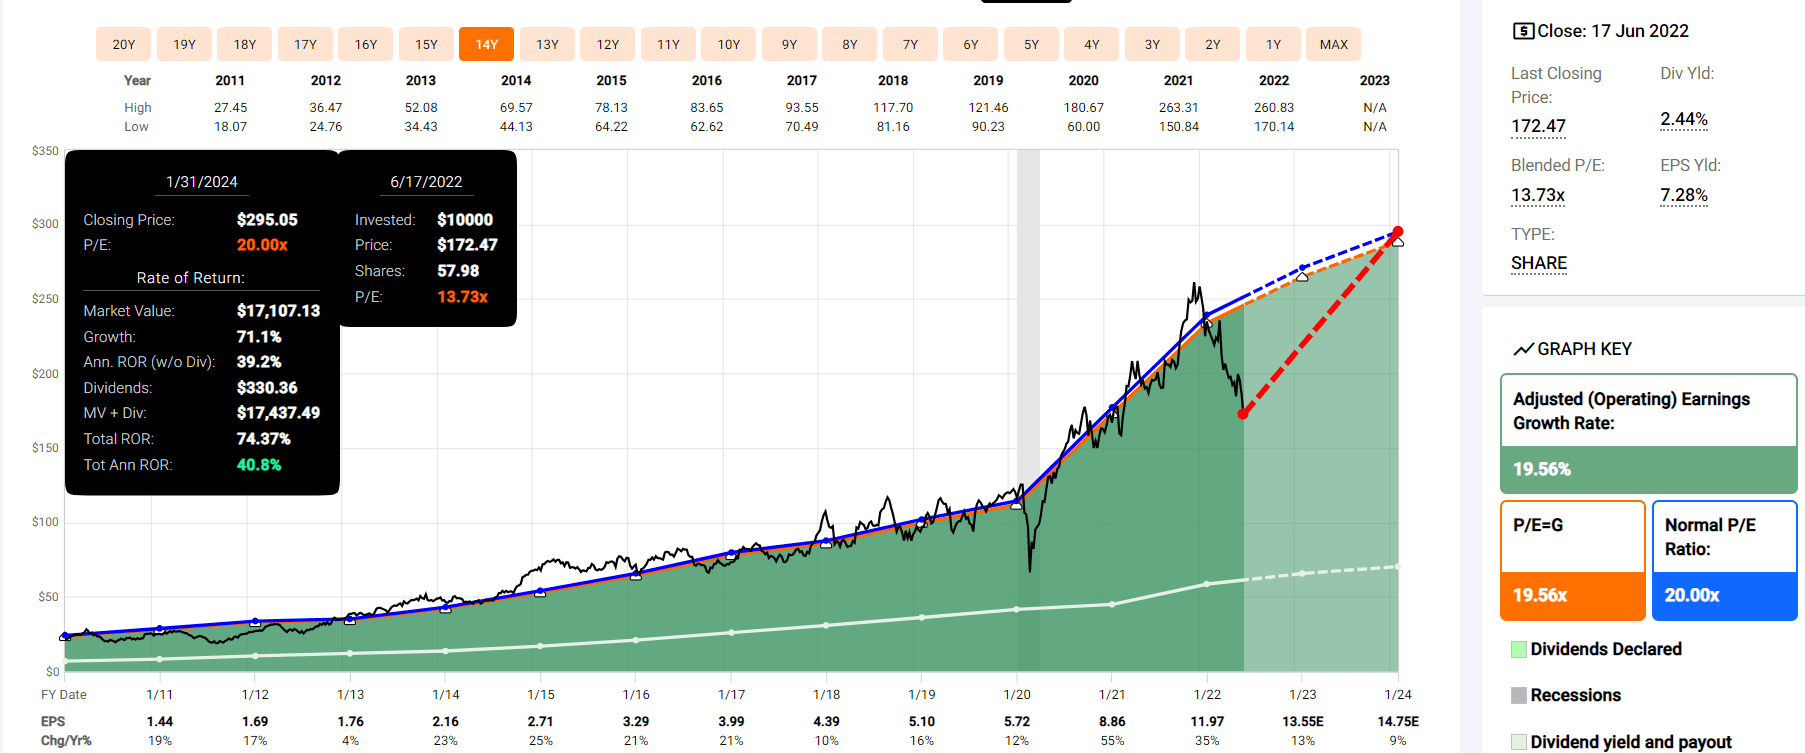
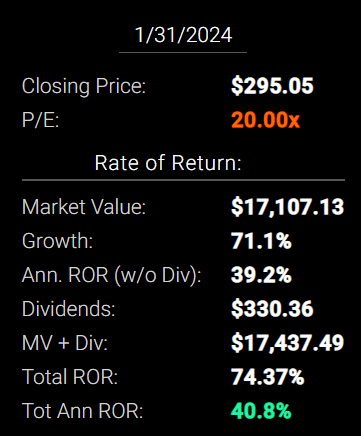
If LOW grows as analysts expect by 2024, it could deliver 74% total returns or 41% annually.
- Buffett-like returns from a hyper-growth dividend king bargain
LOW 2027 Consensus Total Return Potential
FAST Graphs, FactSet FAST Graphs, FactSet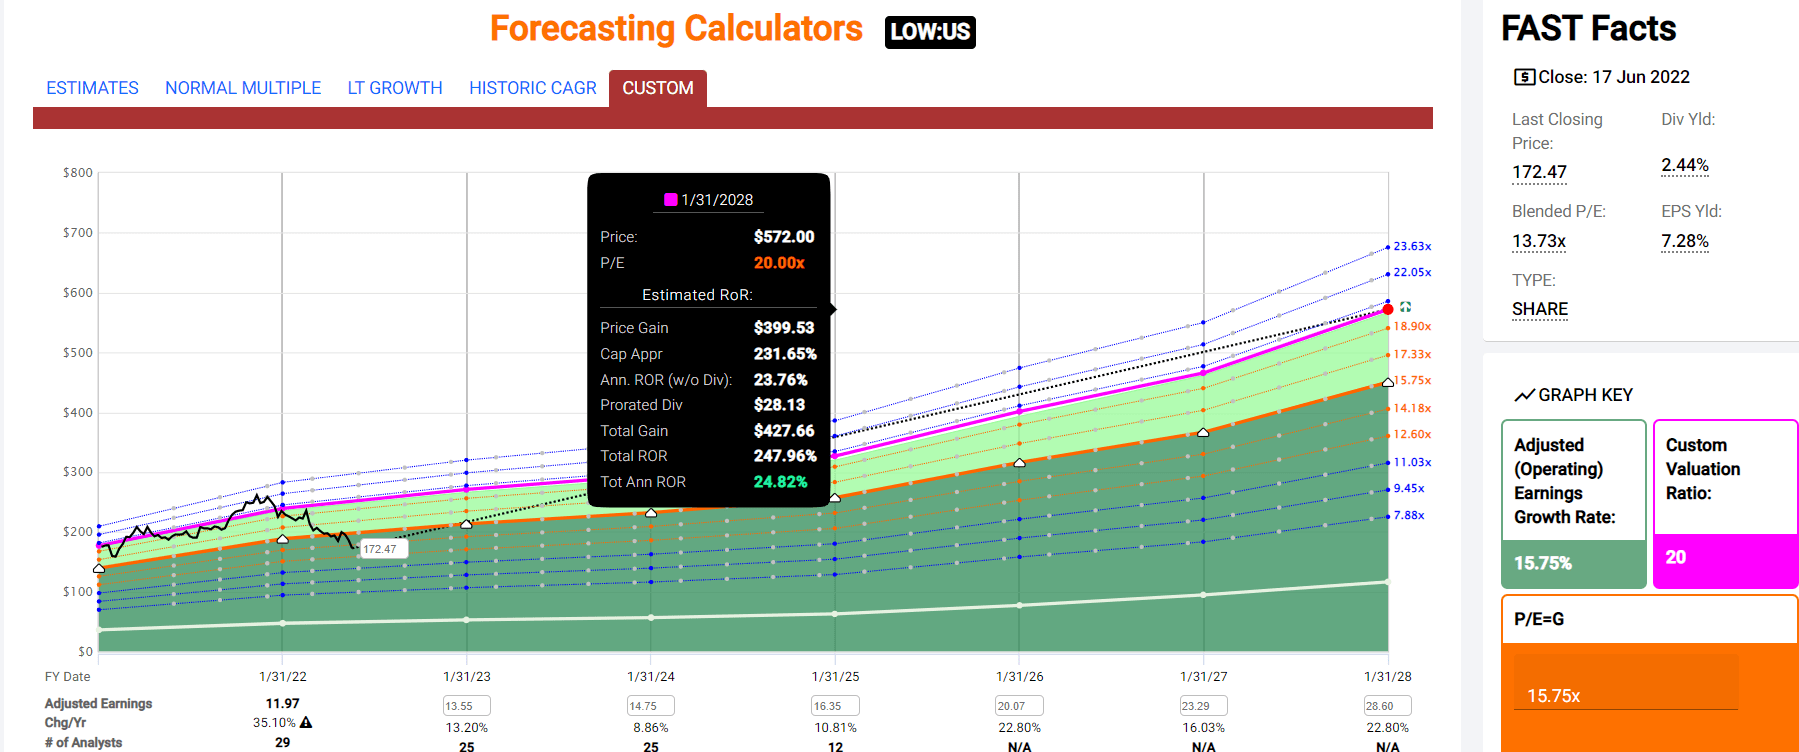
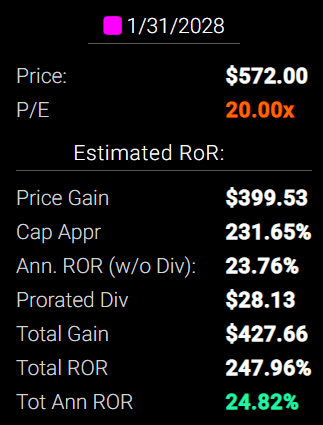
By 2027 if LOW grows as expected and returns to historical fair value, it could deliver 247% total returns or 25% annually.
- about 5X the S&P 500 consensus
- Buffett-like return potential
LOW Long-Term Consensus Total Return Potential
| Investment Strategy | Yield | LT Consensus Growth | LT Consensus Total Return Potential | Long-Term Risk-Adjusted Expected Return | Long-Term Inflation And Risk-Adjusted Expected Returns | Years To Double Your Inflation & Risk-Adjusted Wealth |
10-Year Inflation And Risk-Adjusted Expected Return |
| Lowe’s | 2.4% | 22.80% | 25.2% | 17.6% | 15.2% | 4.7 | 4.11 |
| Nasdaq | 0.9% | 15.9% | 16.8% | 11.8% | 9.3% | 7.8 | 2.43 |
| Dividend Growth | 2.0% | 11.5% | 13.5% | 9.5% | 7.0% | 10.3 | 1.96 |
| Dividend Aristocrats | 2.4% | 8.5% | 10.9% | 7.6% | 5.2% | 14.0 | 1.65 |
| S&P 500 | 1.8% | 8.5% | 10.3% | 7.2% | 4.7% | 15.2 | 1.59 |
(Sources: Morningstar, FactSet, YCharts)
Analysts expect LOW to significantly outperform almost every growth investment strategy as well as the dividend aristocrats, and S&P 500 over the long term.
Inflation-Adjusted Consensus Return Potential: $1,000 Initial Investment
| Time Frame (Years) | 7.6% CAGR Inflation-Adjusted S&P Consensus | 8.4% Inflation-Adjusted Aristocrats Consensus | 22.7% CAGR Inflation-Adjusted LOW Consensus | Difference Between Inflation-Adjusted LOW Consensus Vs S&P Consensus |
| 5 | $1,445.67 | $1,493.29 | $2,784.54 | $1,338.87 |
| 10 | $2,089.97 | $2,229.92 | $7,753.67 | $5,663.70 |
| 15 | $3,021.42 | $3,329.92 | $21,590.42 | $18,569.00 |
| 20 | $4,367.98 | $4,972.54 | $60,119.41 | $55,751.43 |
| 25 | $6,314.67 | $7,425.45 | $167,404.97 | $161,090.30 |
| 30 | $9,128.95 | $11,088.36 | $466,146.07 | $457,017.12 |
(Source: DK Research Terminal, FactSet)
Even if LOW only grows as analysts expect for 10 years, that’s about 8X inflation-adjusted return potential.
| Time Frame (Years) | Ratio Aristocrats/S&P Consensus | Ratio Inflation-Adjusted LOW Consensus vs S&P consensus |
| 5 | 1.03 | 1.93 |
| 10 | 1.07 | 3.71 |
| 15 | 1.10 | 7.15 |
| 20 | 1.14 | 13.76 |
| 25 | 1.18 | 26.51 |
| 30 | 1.21 | 51.06 |
(Source: DK Research Terminal, FactSet)
Which is nearly 4X what analysts expect from the S&P 500 and dividend aristocrats.
LOW Investment Decision Score
DK Dividend Kings Automated Investment Decision Tool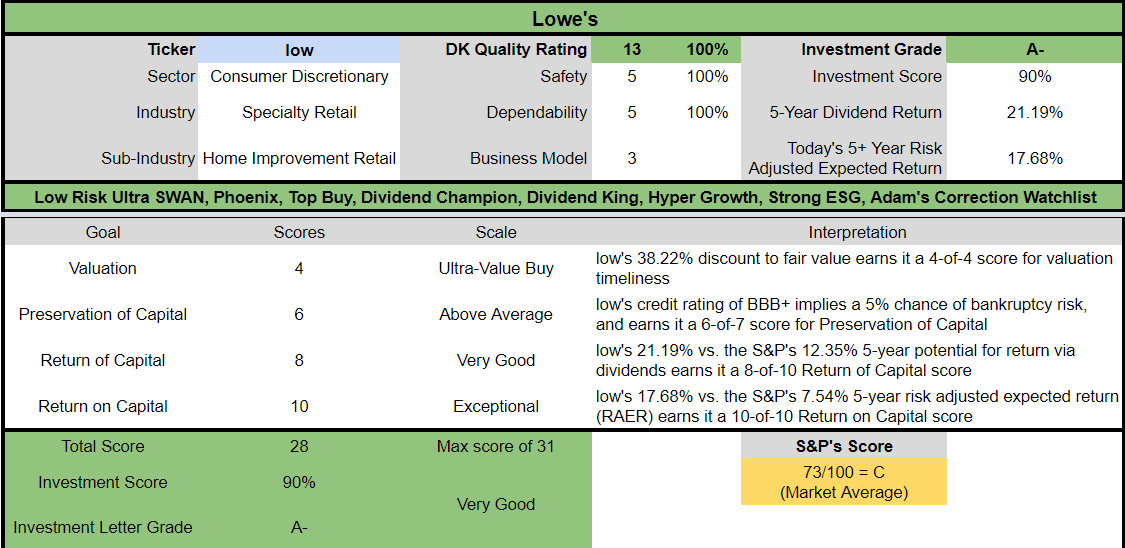
For anyone comfortable with its risk profile, LOW is one of the most reasonable and prudent hyper-growth dividend aristocrats you can buy.
- 38% discount vs 8% market discount = 30% better valuation
- much higher quality (as close to a perfect quality company as exists)
- potentially 2.5X higher long-term return potential than S&P 500 overtime
- about 2.5X better risk-adjusted expected return over the next five years
- about 2X more consensus dividends than the S&P 500 over the next five years
Bottom Line: These Blue-Chip Bargains Are Screaming Buys You Might Not Want To Pass Up
I know it might seem scary to own stocks right now, much less be thinking about buying more.
FAST Graphs, FactSet
As Bank of America has pointed out recently, LOW is already priced as if we were in a severe recession and that’s not the case at all.
In fact, LOW is expected to keep growing at a solid 9% to 13% pace through January 2025.
FAST Graphs, FactSet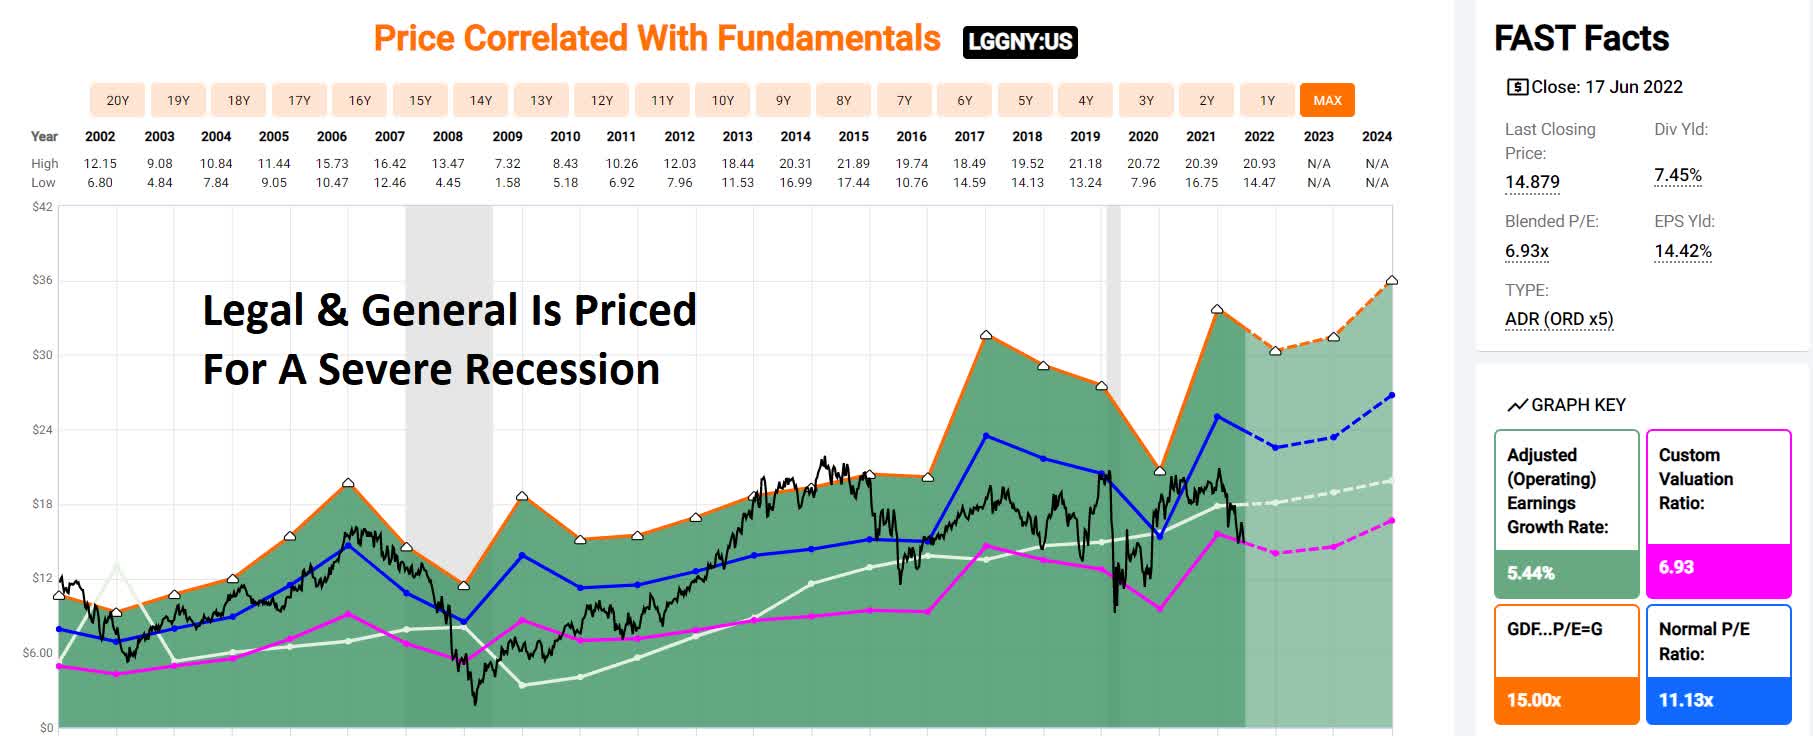
The same is true of Legal & General which is priced as if the economy were on fire. Instead, rising rates are expected to boost earnings by 20% over the next two years;
“The intelligent investor is a realist who buys from pessimists and sells to optimists.” – Ben Graham, the Intelligent Investor
What happens when some of the world’s highest quality companies become total disconnected from fundamentals?
The potential for 40% to 60% gains in 12 months, and that’s just the beginning.
Lowe’s is the 2nd fastest growing Ultra SWAN dividend stock, and Legal & General is one of the safest 8% yielding blue-chips on earth.
Whether or not we get a recession in 2023 and these stocks fall a bit more, we won’t know for a few more weeks at least.
But when the safe income and total return potential is this good?
Then starting to put money to work now isn’t just reasonable and prudent, it could prove to be downright genius.
I can’t tell you what either stock will do in the next few weeks, but as long as their fundamentals remain strong, the reward/risk profile over the next 5+ years is spectacular.
And that’s why it might be time to start adding Legal & General and Lowe’s to your diversified and prudently risk-managed portfolio today.
Be the first to comment