

tiero/iStock via Getty Images
2022’s bear market has been historically normal… except for one key distinction.
Ycharts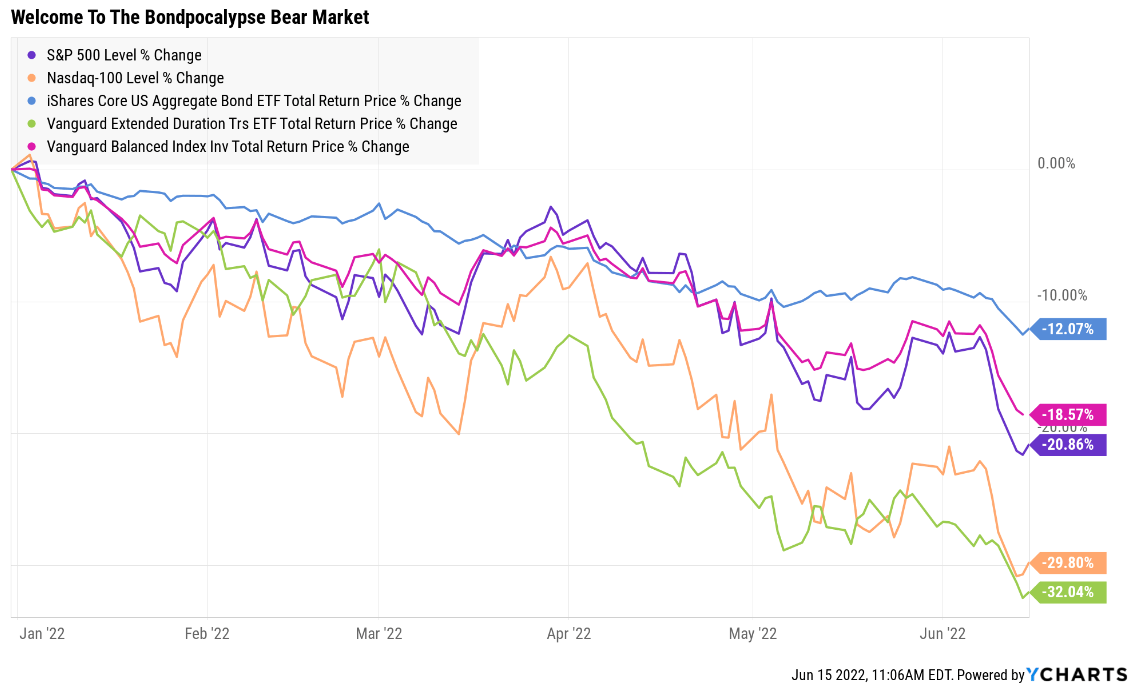
The worst inflation in 40 years, combined with the lowest interest rates in history, has caused bonds to fall 12% during this bear market.
That means a 60/40 portfolio is down 19% YTD.
How odd is it that bonds are crashing at the same time as stocks?
Fortune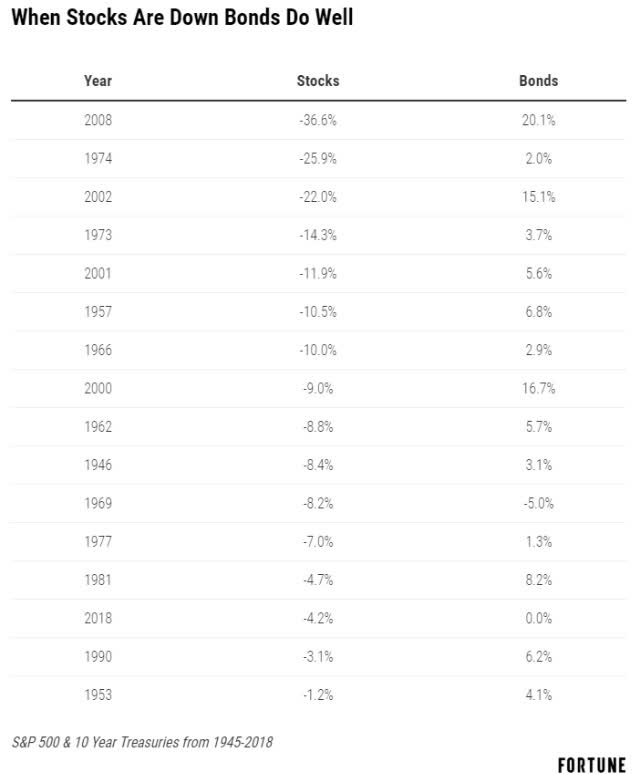
Since WWII, when inflation has been as high as 20%, bonds have gone up or remained stable 92% of the time stocks have fallen. But that means that 8% of the time stocks fall along with bonds.
Usually, though, the declines for low volatility bonds are minor.
Charlie Bilello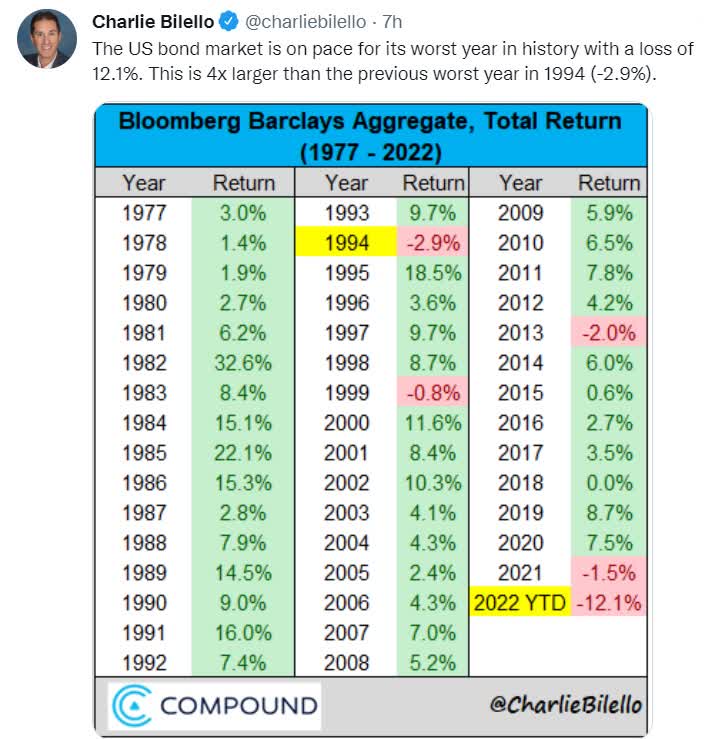
Not during this inflationary bondpocalypse. This is the worst year for bonds, in history, by a wide margin.
Even in the late 1970s, when inflation soared to 15%, bonds still managed to post modest nominal returns (but lost to inflation).
The question that is dominating every aspect of the market right now is, “how high will inflation rise? How long will it remain high?”
This singular question determines what the Fed, interest rates, the economy, and the stock market will do in the coming months and years.
While there is no way to know with certainty how bad inflation will get, the commodity futures market is one reasonable way to estimate where CPI might peak and when.
Daily Shot 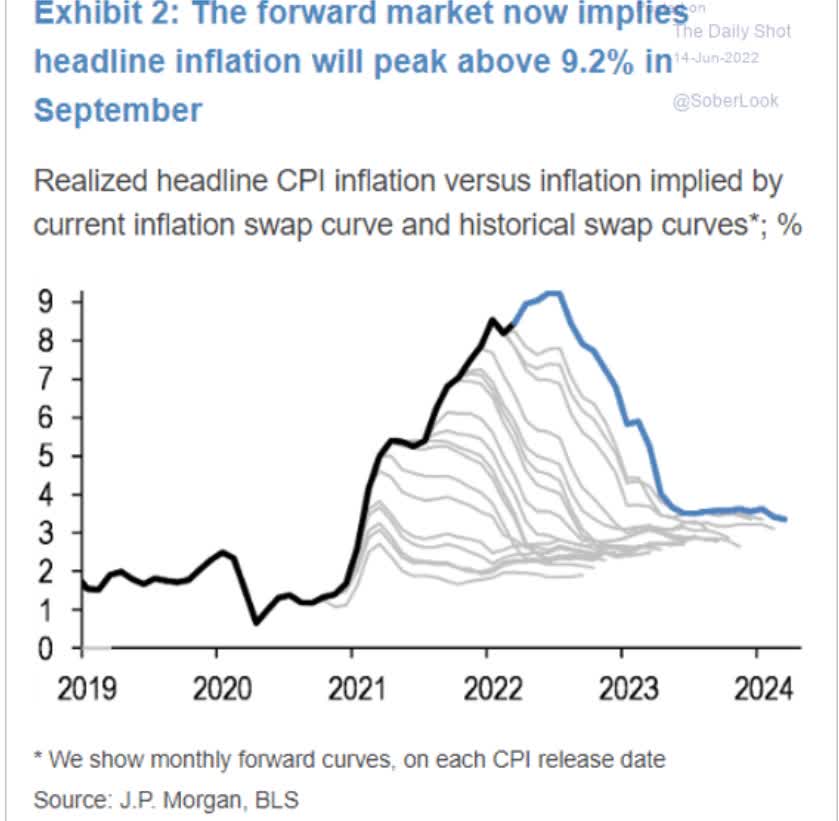
According to JPMorgan, the futures market now thinks CPI inflation will peak around 9.2% in September (October report).
That’s the bad news.
Further bad news is that producer prices, or wholesale inflation, are running much higher than 9.2%.
Bureau of Labor Statistics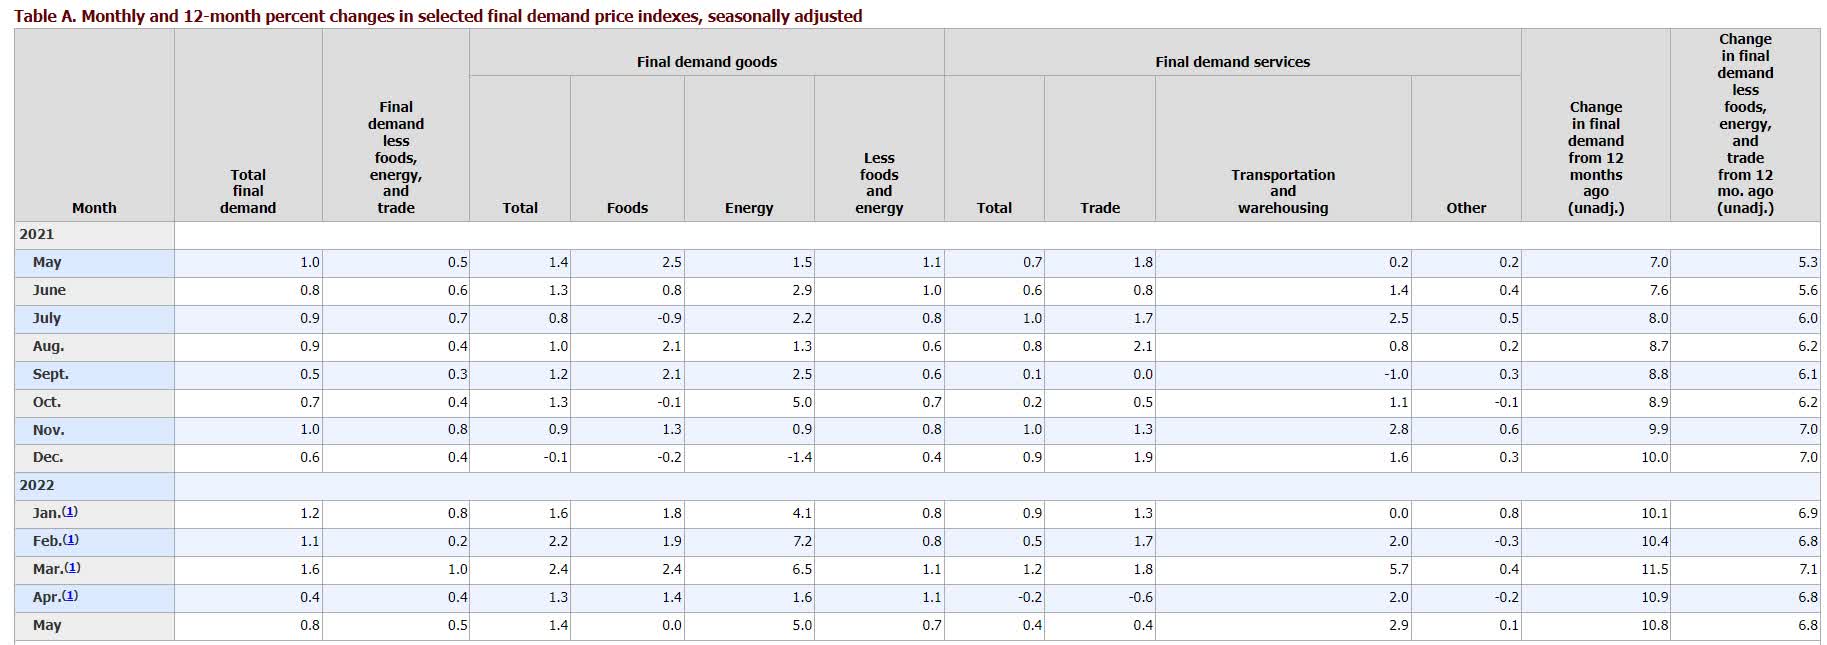
In May, producer prices, which generally get passed onto consumers, rose 0.8% MoM, twice the rate in April.
That’s a 10.8% YOY increase which has three important implications.
- Companies are seeing double-digit increases in costs and CPI could rise to 10+% if they maintain their margins.
- If CPI peaks at 9.2%, margins could decline by 15%.
- If CPI peaks between 9.2% and 10.8%, then margins will fall while inflation surprises to the upside (the worst of all worlds).
Which of these scenarios is most likely? I don’t know, and no economist I’ve heard of does.
Morgan Stanley’s Chief Investment Officer, Mike Wilson, expects earnings estimates to come down significantly in the coming months. If they don’t, a lot of big companies are going to miss expectations in Q2, resulting in a lot of Target (TGT)- and Walmart (WMT)-like surprises and big crashes
The good news is that Morgan Stanley, one of the 16 most accurate economic teams on earth according to MarketWatch (part of the blue-chip consensus), is still confident we aren’t headed for a recession.
This is why Mike Wilson just reiterated his call that the S&P 500 LIKELY bottoms at 3,400 or so, sometime in August (earnings season).
- -29.4% peak decline for the S&P
| Time Frame |
Historically Average Bear Market Bottom |
| Non-Recessionary Bear Markets Since 1965 |
-21% (Achieved May 20th) |
| Median Recessionary Bear Market Since WWII |
-24% (Citigroup base case) |
| Non-Recessionary Bear Markets Since 1928 |
-26% (Goldman Sachs base case) |
| Bear Markets Since WWII |
-30% (Morgan Stanley base case) |
| Recessionary Bear Markets Since 1965 |
-36% (Bank of America recessionary base case) |
| All 140 Bear Markets Since 1792 | -37% |
| Average Recessionary Bear Market Since 1928 |
-40% (Deutsche Bank, Bridgewater Severe Recessionary base case) |
|
(Sources: Ben Carlson, Bank of America, Oxford Economics, Goldman Sachs) |
But with 70% of economists now expecting a recession in 2023, and 75% of Fortune 500 CEOs (a mild one), what if we do experience an economic contraction relatively soon?
- Goldman and Citi estimate the S&P 500 bottoms around -25%
- 10% EPS decline
The average recessionary EPS contraction since WWII is 15%, and Deutsche Bank and Bridgewater (the world’s largest hedge fund) estimate that this is approximately what would happen if we experienced a severe recession.
- caused by the Fed raising rates to 5% to 6% by mid-2023
The good news is that those economist teams, along with Societe Generale (part of the blue-chip consensus), all estimate that even in a worst-case scenario the S&P likely bottoms at -40%.
The bad news? For the S&P to bottom at -40% would require a 24% further decline.
Or to put it another way, so far the market has fallen 22%, and we might be only halfway to the bottom if the Fed’s long-shot soft landing plan doesn’t pan out.
But fortunately, such a bear market would create exceptional opportunities for long-term investors to cash in on the best buying opportunities since 2009.
Want some further good news? There are plenty of wonderful low-volatility high-yield blue-chips that you can buy to help you sleep well at night even if the market has another 24% to fall.
The Best Sectors To Own In A Recessionary Bear Market
What does Mike Wilson recommend, expecting the market to fall another 8% in the next two months?
- defensive sectors
- utilities
- healthcare
- REITs
- consumer staples
These recommendations are backed up by several decades of data.
Reuters 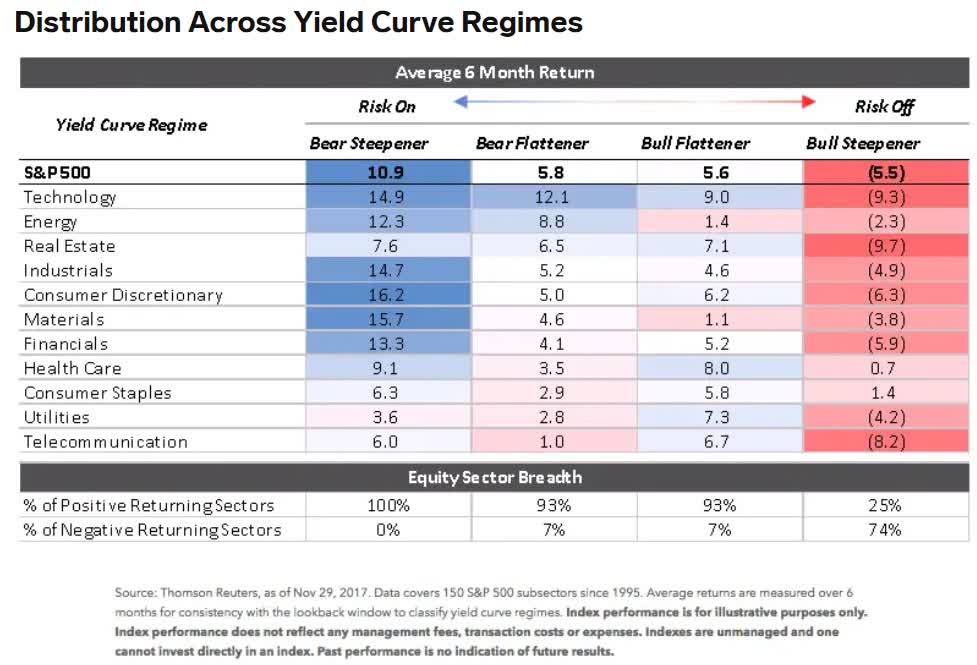
Historically, during recessions (bull steepening interest rate regimes), the market falls 5.5% every six months, but consumer staples and healthcare rise modestly.
Utilities fall less than the market as well, and surprisingly enough, energy tends to be defensive as well (especially blue-chip midstream).
While every bear market is slightly different, this is a good starting point for trying to find the best defensive high-yield blue-chips to potentially ride out an 8% to 24% further decline in the markets.
- stocks might not bottom for another six to 12 months
So let me show you a super-easy way of finding the best high-yield, low volatility blue-chips.
Companies that can help you earn generous, safe, and growing income, as well as strong long-term returns, no matter what happens with the economy or market in the coming months and years.
12 High-Yield Blue-Chips You’ll Want To Own If Stocks Keep Falling
Here are the settings I used on the Dividend Kings Zen Research Terminal to find these low volatility high-yield blue-chips.
- good buy or better
- 4+% yield
- 70+ safety score (3% or less risk of a dividend cut in a severe recession)
- 10+% long-term consensus total return potential
I then sorted by average annual volatility (over the last 15 years).
Dividend Kings Zen Research Terminal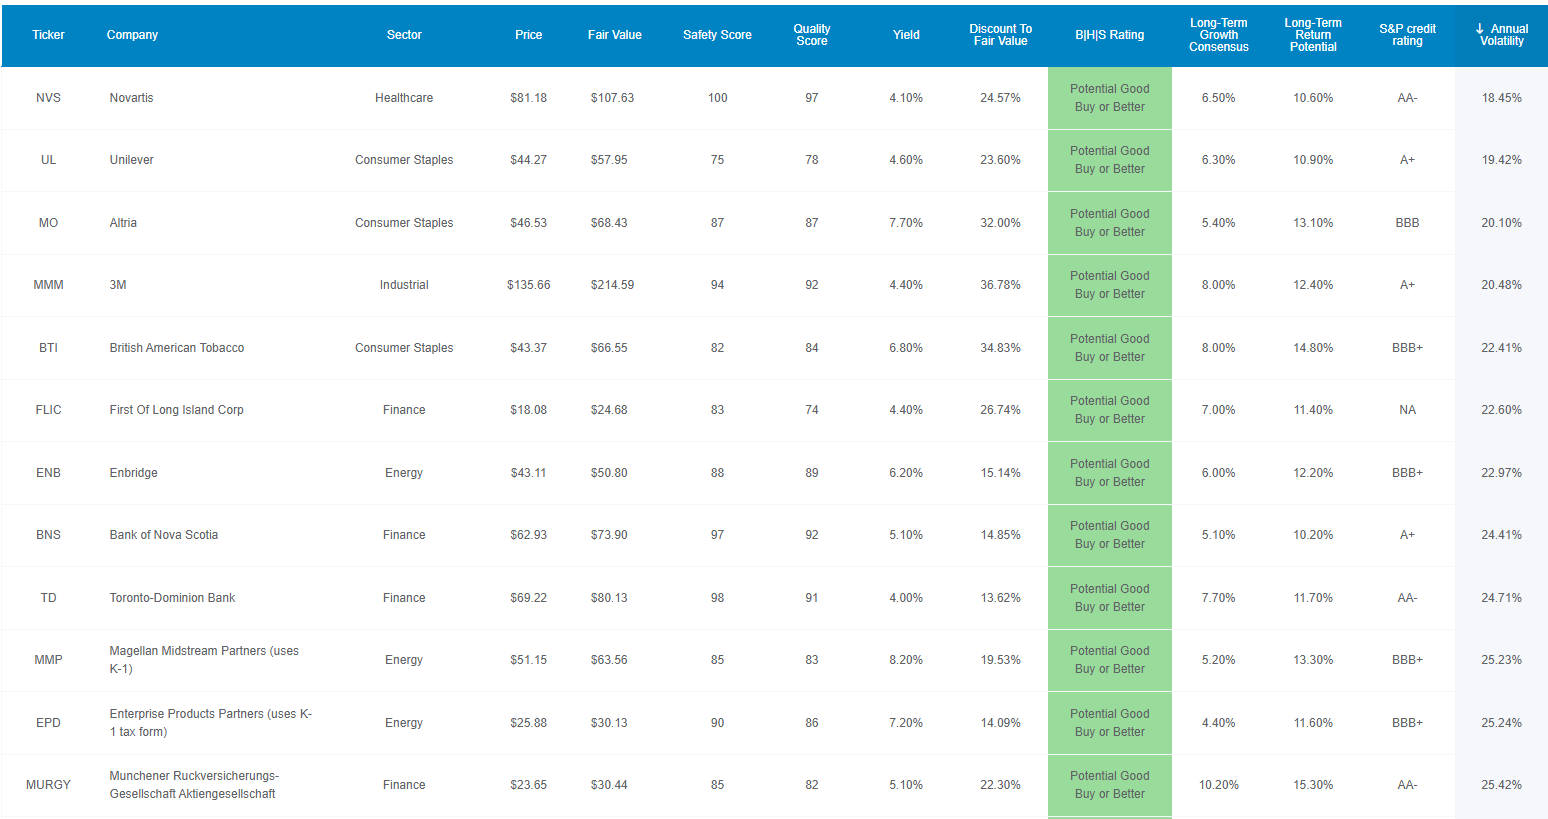
And that’s how I found these amazing 12 high-yield, low volatility blue-chips, in about 30 seconds. Then I used the watchlist creator tool to get all their average fundamental stats.
- Novartis (NVS)
- Unilever (UL)
- Altria (MO)
- 3M (MMM)
- British American Tobacco (BTI)
- First of Long Island Corp. (FLIC)
- Enbridge (ENB)
- Bank of Nova Scotia (BNS)
- Toronto Dominion Bank (TD)
- Magellan Midstream Partners (MMP) – uses a K-1 tax form
- Enterprise Products Partners (EPD) – uses a K-1 tax form
- Munich Re (OTCPK:MURGY)
I’ve linked to articles that provide detailed info about each company’s long-term investment thesis, growth prospects, risk profile, valuation and return potential.
Why These 12 Blue-Chips Are A Great Choice For This Bear Market
Dividend Kings Zen Research Terminal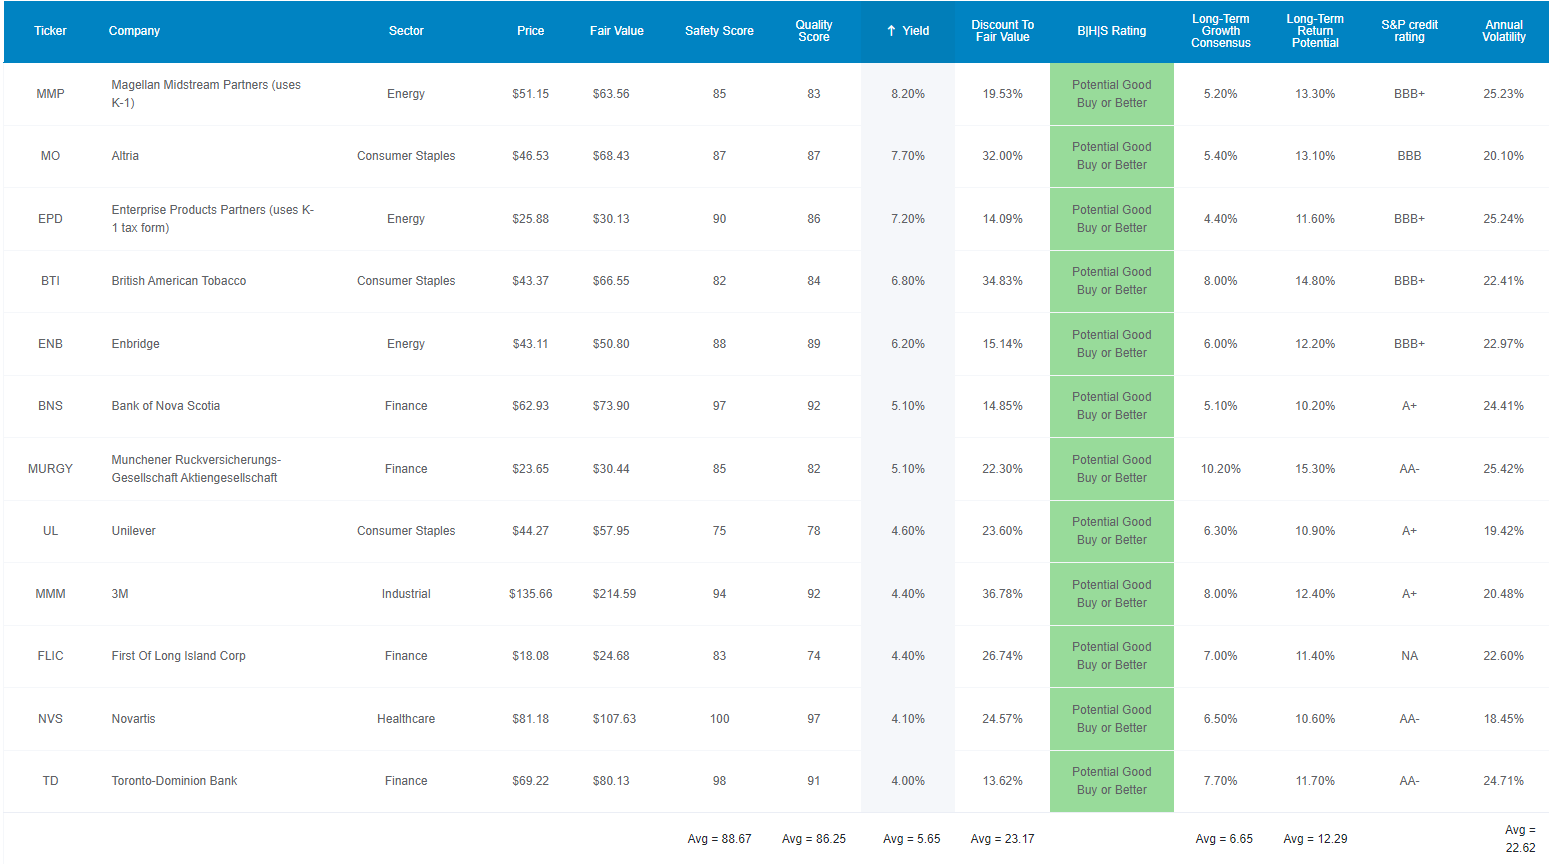
Here are 12 companies in five sectors from three countries on two continents.
Their average annual volatility is 22.6% compared to 23% for the average dividend aristocrat.
- combined their historical volatility is 13.2% vs 15% for the S&P 500
More importantly, these are 12 of the highest quality high-yield, low volatility blue-chips on earth.
| Metric | Dividend Aristocrats | 12 High-Yield, Low Volatility Blue-Chips | Winner Aristocrats |
Winner 12 High-Yield, Low Volatility Blue-Chips |
| Quality | 87% | 86% | 1 | |
| Safety | 89% | 89% | 1 | 1 |
| Dependability | 84% | 86% | 1 | |
| Long-Term Risk Management Industry Percentile | 67% (Above-Average) | 74% (Good) | 1 | |
| Average Credit Rating | A- Stable | A- Stable | 1 | 1 |
| Average 30-Year Bankruptcy Risk | 3.01% | 3.50% | 1 | |
| Average Dividend Growth Streak (Years) | 44.3 | 23.3 | 1 | |
| Average Return On Capital | 100% | 323% | 1 | |
| Average ROC Industry Percentile | 83% | 90% | 1 | |
| 13-Year Median ROC | 89% | 160% | 1 | |
| Total | 5 | 7 |
(Source: DK Zen Research Terminal)
These blue-chips are of higher quality than the dividend aristocrats.
| Rating | Dividend Kings Safety Score (162 Point Safety Model) | Approximate Dividend Cut Risk (Average Recession) |
Approximate Dividend Cut Risk In Pandemic Level Recession |
| 1 – unsafe | 0% to 20% | over 4% | 16+% |
| 2- below average | 21% to 40% | over 2% | 8% to 16% |
| 3 – average | 41% to 60% | 2% | 4% to 8% |
| 4 – safe | 61% to 80% | 1% | 2% to 4% |
| 5- very safe | 81% to 100% | 0.5% | 1% to 2% |
| 12 High-Yield, Low Volatility Blue-Chips | 89% | 0.5% | 1.60% |
| Risk Rating | Low-Risk (74th industry percentile risk-management consensus) | A- stable outlook credit rating 3.5% 30-year bankruptcy risk |
20% OR LESS Max Risk Cap Recommendation (Each) |
(Source: DK Research Terminal)
The average risk of a dividend cut in an average recession since WWII is about 0.5%.
In a severe Pandemic or Great Recession level downturn, it’s about 1.6%.
S&P estimates these blue-chips have an average 3.5% 30-year default risk, an A- stable credit rating.
And six rating agencies estimate their long-term risk management is in the top 26% of their respective industries.
| Classification | Average Consensus LT Risk-Management Industry Percentile |
Risk-Management Rating |
| S&P Global (SPGI) #1 Risk Management In The Master List | 94 | Exceptional |
| Strong ESG Stocks | 78 |
Good – Bordering On Very Good |
| Foreign Dividend Stocks | 75 | Good |
| 12 High-Yield, Low Volatility Blue-Chips | 74 | Good |
| Ultra SWANs | 71 | Good |
| Low Volatility Stocks | 68 | Above-Average |
| Dividend Aristocrats | 67 | Above-Average |
| Dividend Kings | 63 | Above-Average |
| Master List Average | 62 | Above-Average |
| Hyper-Growth stocks | 61 | Above-Average |
| Monthly Dividend Stocks | 60 | Above-Average |
| Dividend Champions | 57 | Average |
(Source: DK Research Terminal)
Ben Graham considered a 20+ year dividend growth streak an important sign of excellent quality.
Joel Greenblatt considered return on capital his gold standard of quality and moatiness.
- average ROC 323% vs 14.6% S&P 500
- 90th industry percentile (wide moat)
- 13-year median ROC 160% (wide and improving moat)
Now that we know that these are some of the world’s best high-yield blue-chips, here’s why you might want to buy them today.
Wonderful Companies At Wonderful Prices
Dividend Kings Zen Research Terminal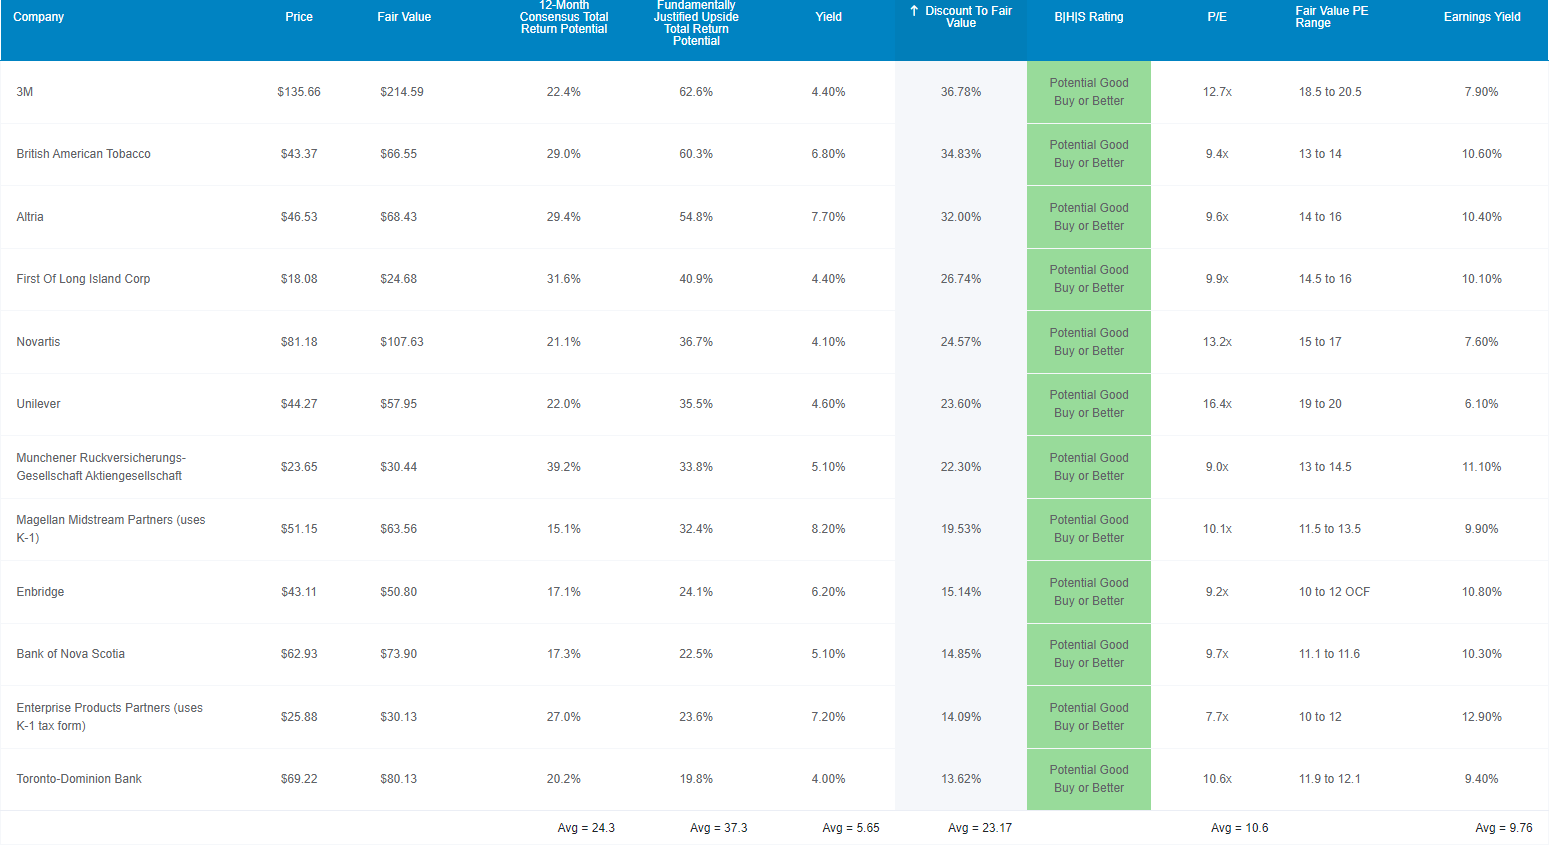
The S&P 500 is trading at 15.9X forward earnings, a 6% historical discount.
These high-yield blue-chips average a PE of 10.6, a 23% historical discount. The last time the S&P traded at 10.6X earnings was 2009 following the Great Recession.
These blue-chips are so undervalued that even in this bear market analysts expect them to deliver 24% total returns in the next 12 months. 37% total returns would be justified by their fundamentals and expected growth.
These are Ultra SWAN quality companies trading at a 23% discount, making them a collective strong buy and just 2% away from a very strong buy.
Why? Just take a look at their long-term return fundamentals.
Long-Term Return Fundamentals That Can Help You Retire In Safety And Splendor
Dividend Kings Zen Research Terminal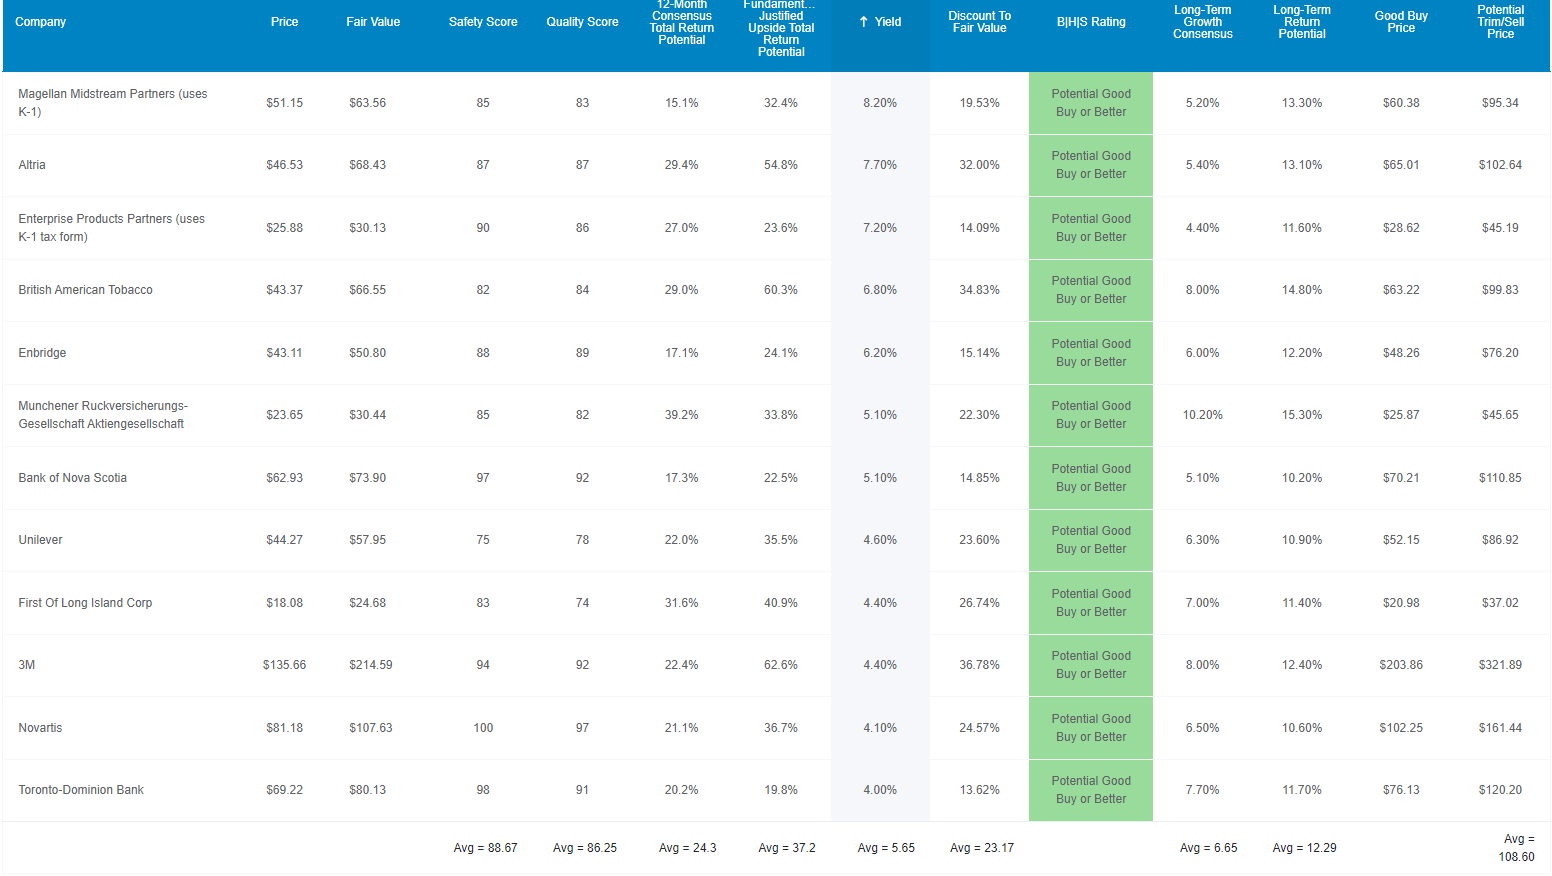
These low volatility blue-chips yield a very safe 5.7%, almost 3.5X more than the S&P 500.
More importantly, analysts expect them to grow 6.7% over time and deliver potentially 12.3% long-term returns.
| Investment Strategy | Yield | LT Consensus Growth | LT Consensus Total Return Potential | Long-Term Risk-Adjusted Expected Return | Long-Term Inflation And Risk-Adjusted Expected Returns | Years To Double Your Inflation & Risk-Adjusted Wealth |
10-Year Inflation And Risk-Adjusted Expected Return |
| 12 High-Yield, Low Volatility Blue-Chips | 5.7% | 6.7% | 12.3% | 8.6% | 6.1% | 11.7 | 1.81 |
| Safe Midstream | 5.1% | 6.4% | 11.5% | 8.1% | 5.6% | 12.9 | 1.72 |
| 10-Year US Treasury | 3.4% | 0.0% | 3.4% | 3.4% | 0.9% | 77.4 | 1.10 |
| High-Yield | 3.1% | 12.7% | 15.8% | 11.1% | 8.6% | 8.4 | 2.28 |
| REITs | 2.8% | 6.5% | 9.3% | 6.5% | 4.0% | 17.8 | 1.49 |
| Dividend Aristocrats | 2.4% | 8.5% | 10.9% | 7.6% | 5.2% | 14.0 | 1.65 |
| S&P 500 | 1.7% | 8.5% | 10.2% | 7.1% | 4.7% | 15.4 | 1.58 |
(Sources: Morningstar, FactSet, Ycharts)
There are no diversified portfolio options that yield almost 6% and offer return potential higher than the dividend aristocrats and S&P 500.
What does that potentially mean for you?
Inflation-Adjusted Consensus Total Return Forecast: $1,000 Initial Investment
| Time Frame (Years) | 7.6% CAGR Inflation-Adjusted S&P Consensus | 8.4% Inflation-Adjusted Aristocrats Consensus | 9.8% CAGR Inflation-Adjusted 12 High-Yield/Low Vol Blue-Chip Consensus | Difference Between Inflation-Adjusted 12 High-Yield/Low Vol Blue-Chip Consensus Vs S&P Consensus |
| 5 | $1,445.67 | $1,493.29 | $1,598.10 | $152.43 |
| 10 | $2,089.97 | $2,229.92 | $2,553.93 | $463.96 |
| 15 | $3,021.42 | $3,329.92 | $4,081.45 | $1,060.04 |
| 20 | $4,367.98 | $4,972.54 | $6,522.58 | $2,154.60 |
| 25 | $6,314.67 | $7,425.45 | $10,423.76 | $4,109.09 |
| 30 | $9,128.95 | $11,088.36 | $16,658.26 | $7,529.30 |
(Source: DK Research Terminal, FactSet)
Analysts think these high-yield blue-chips could deliver almost 17X returns over the next 30 years.
- the standard retirement time frame even if you just retired
| Time Frame (Years) | Ratio Aristocrats/S&P Consensus | Ratio Inflation–Adjusted 12 High-Yield/Low Vol Blue-Chip Consensus & S&P |
| 5 | 1.03 | 1.11 |
| 10 | 1.07 | 1.22 |
| 15 | 1.10 | 1.35 |
| 20 | 1.14 | 1.49 |
| 25 | 1.18 | 1.65 |
| 30 | 1.21 | 1.82 |
(Source: DK Research Terminal, FactSet)
That’s about 60% more than they expect from the dividend aristocrats and 80% more than the S&P 500 which yields 3.5X less.
What evidence is there that these 12 high-yield Ultra SWANs can deliver anything like 12% long-term returns?
Historical Returns Since April 2001 (Annual Rebalancing)
“The future doesn’t repeat, but it often rhymes.” – Mark Twain
Past performance is no guarantee of future results, but studies show that blue-chips with relatively stable fundamentals over time offer predictable returns based on yield, growth, and valuation mean reversion.
Bank of America 
So let’s take a look at how these 12 high-yield blue-chips did over the last 21 years when over 91% of total returns were due to fundamentals, not luck.
(Source: Portfolio Visualizer Premium)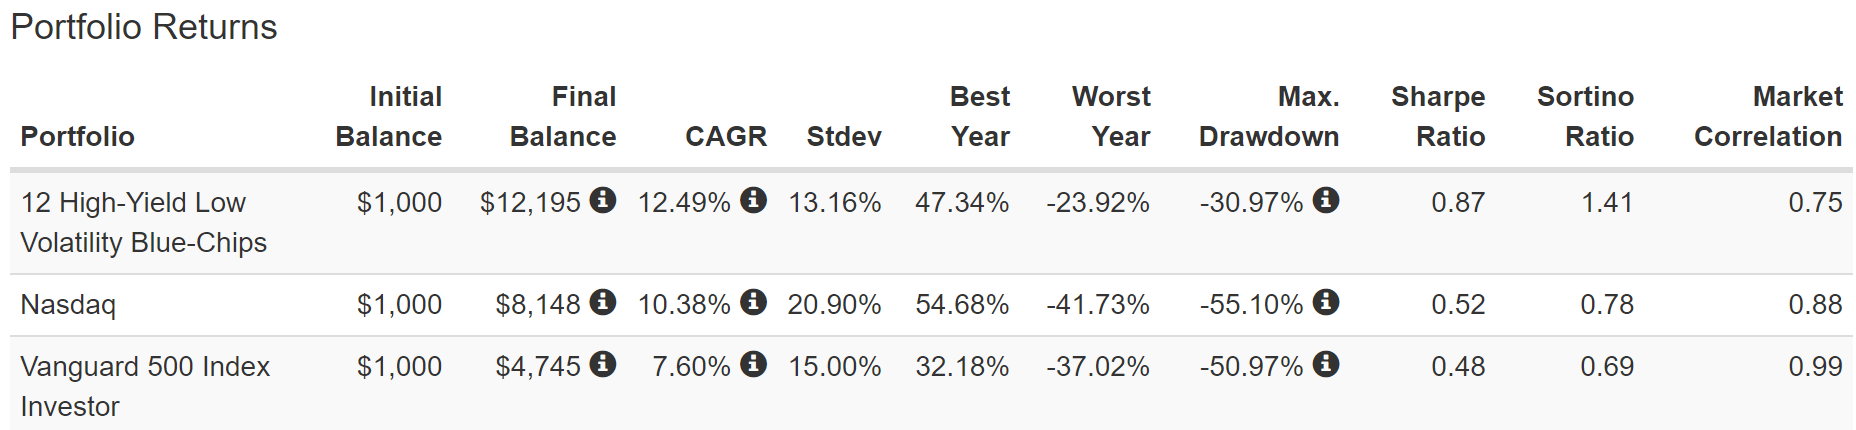
Analysts expect 12.3% long-term returns and these high-yield blue-chips have historically delivered… 12.5% annual returns.
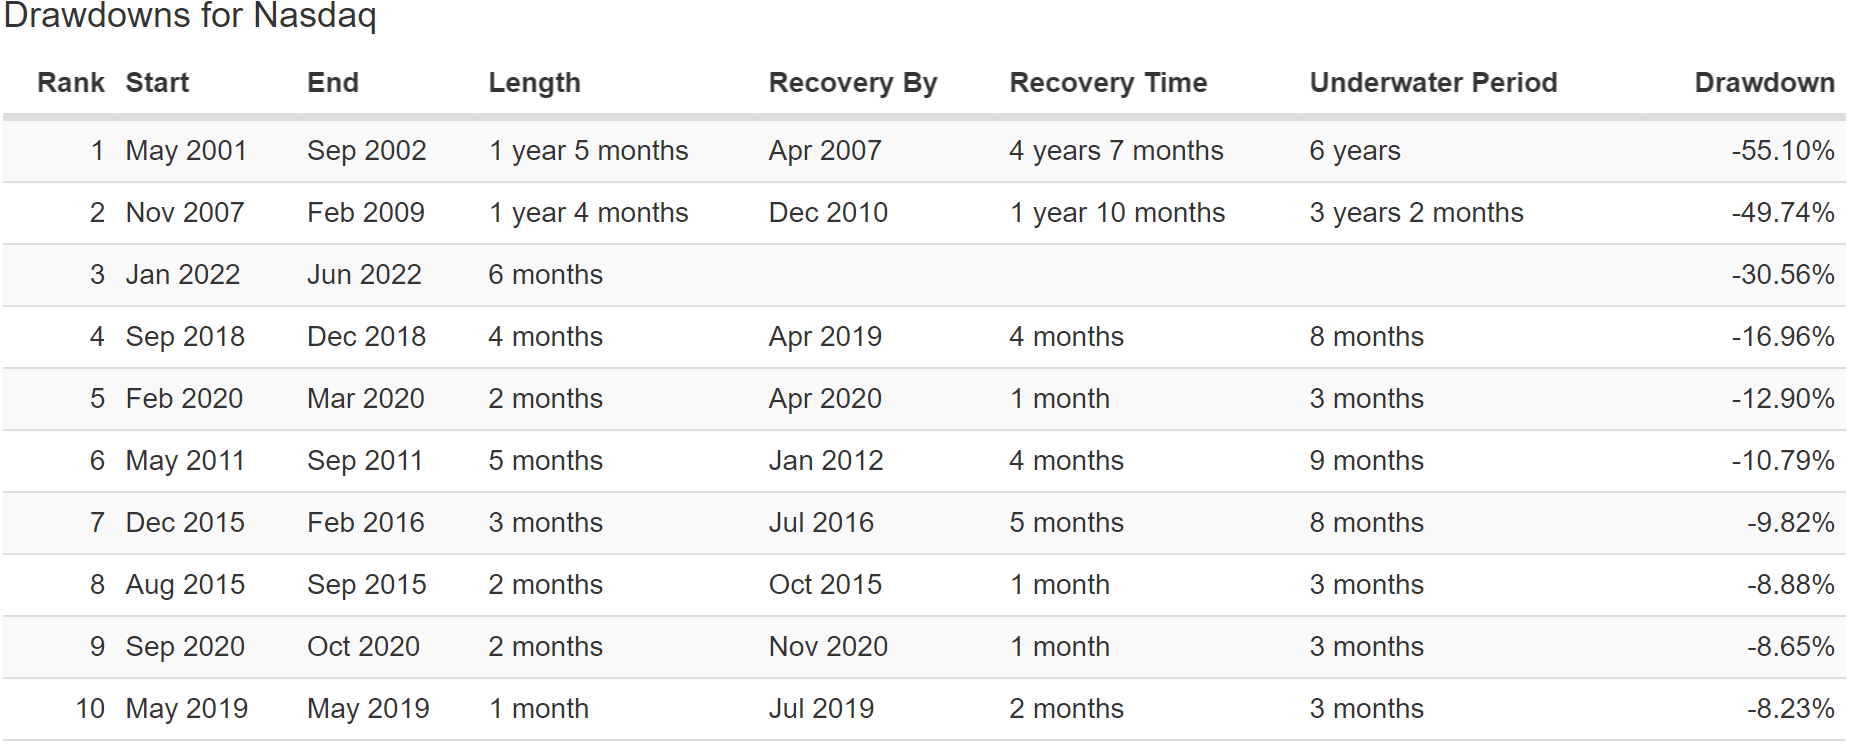
That’s not just better than the S&P 500’s 7.6%, it’s also about 20% better than the Nasdaq.
Except that their average annual volatility was 13% annually, 2% less than the S&P and 8% less than the Nasdaq.
- 81% better negative-volatility adjusted total returns than the Nasdaq
- 2X better negative-volatility adjusted total returns than the S&P 500
(Source: Portfolio Visualizer Premium)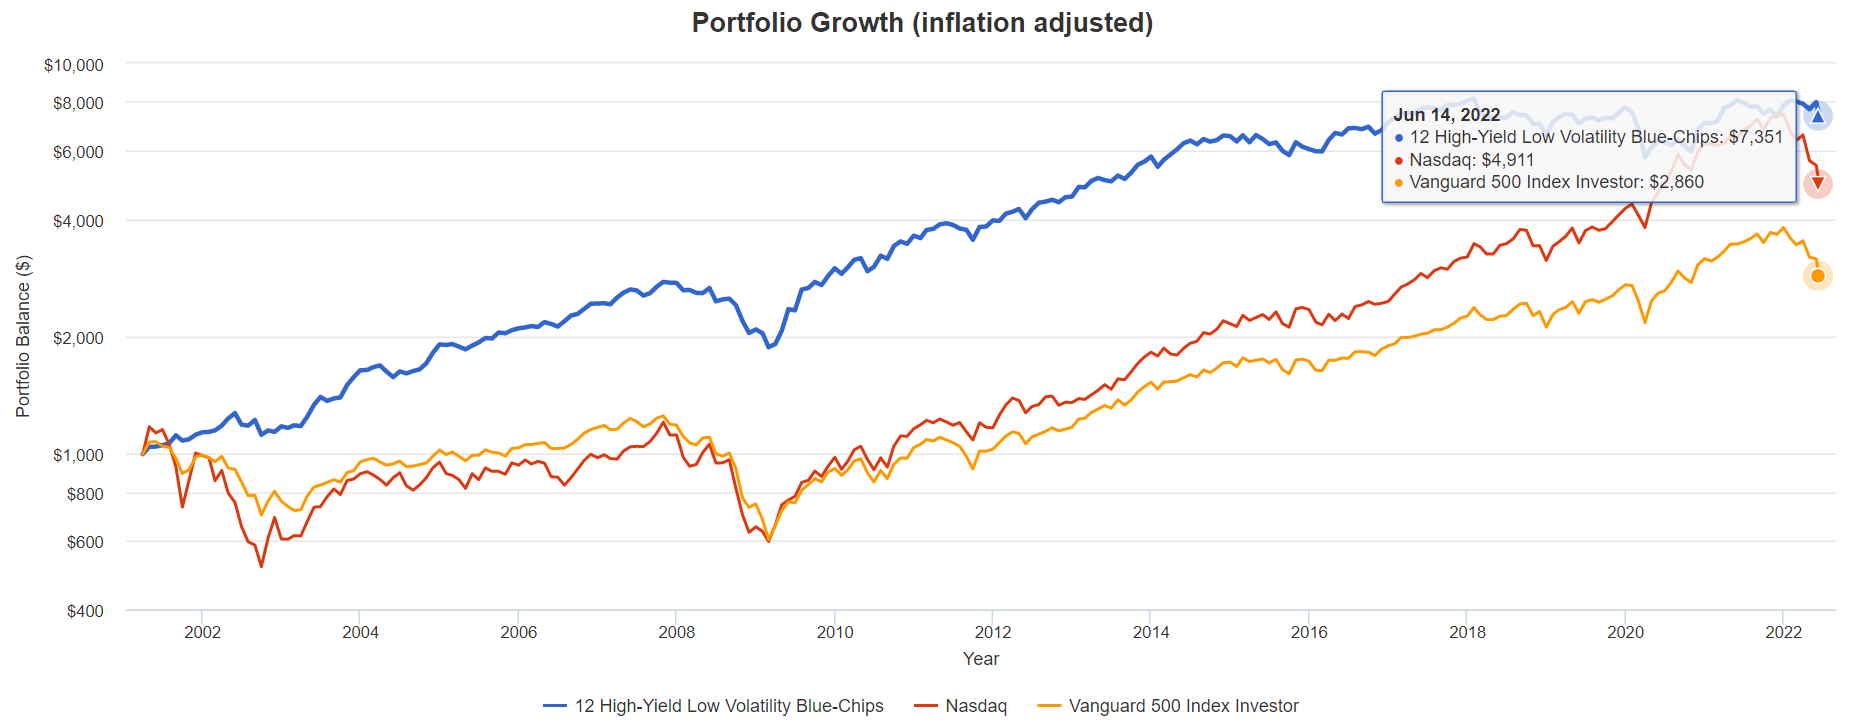
Over the next 20 years, analysts expect about 6.5X inflation-adjusted returns, and these high-yield blue-chips historically delivered 7.4X real returns over the last 21 years.
That’s almost 2X better than the Nasdaq and 3X better than the S&P 500.
(Source: Portfolio Visualizer Premium)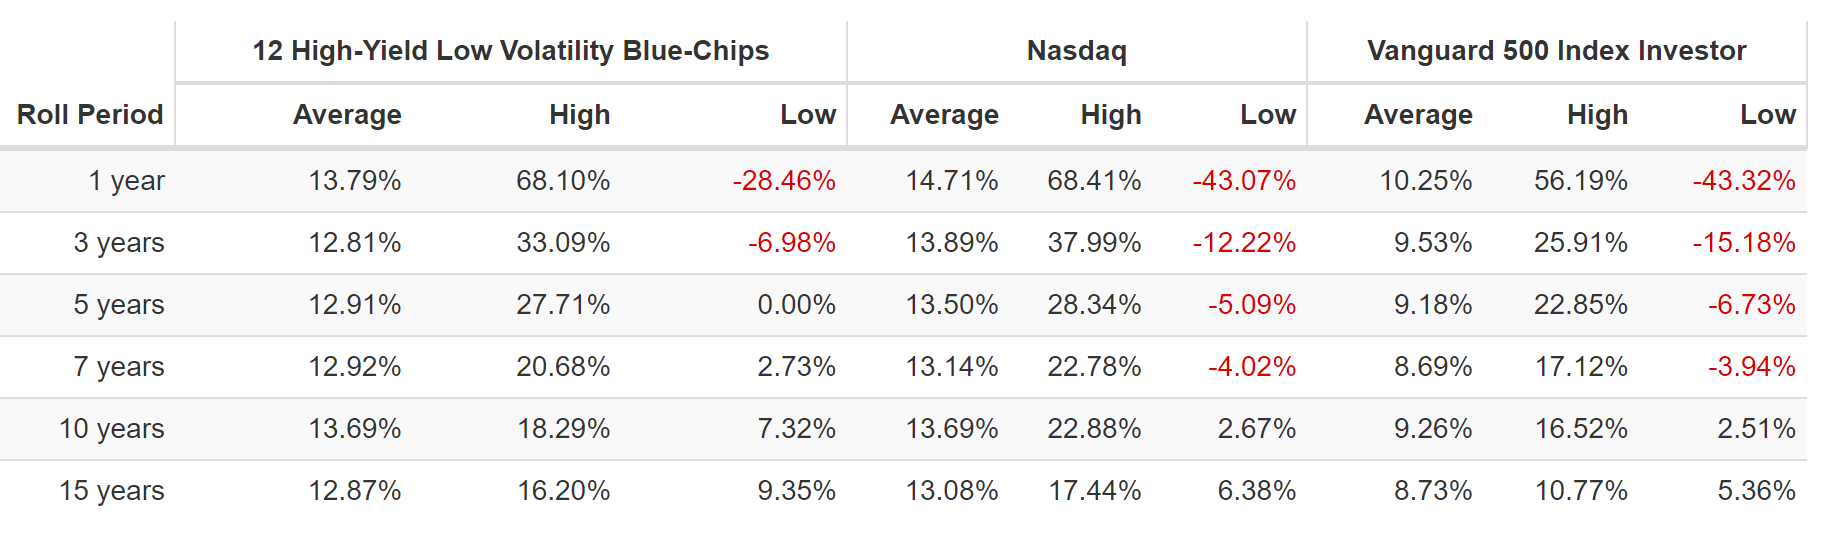
Their average 15-year rolling return is almost 13%, matching the Nasdaq and trouncing the S&P 500 by almost 4% per year.
(Source: Portfolio Visualizer Premium)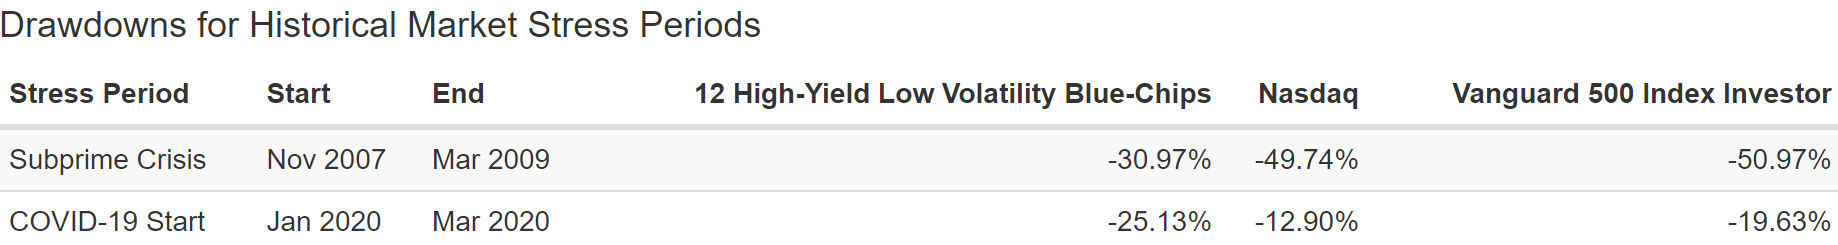
During the Great Recession, they fell just 31% compared to 50% crashes in the S&P and Nasdaq.
- a 60/40 stock/bond portfolio fell 31% as well
- this is the power of low volatility blue-chip investing
(Source: Portfolio Visualizer Premium) (Source: Portfolio Visualizer Premium) (Source: Portfolio Visualizer Premium)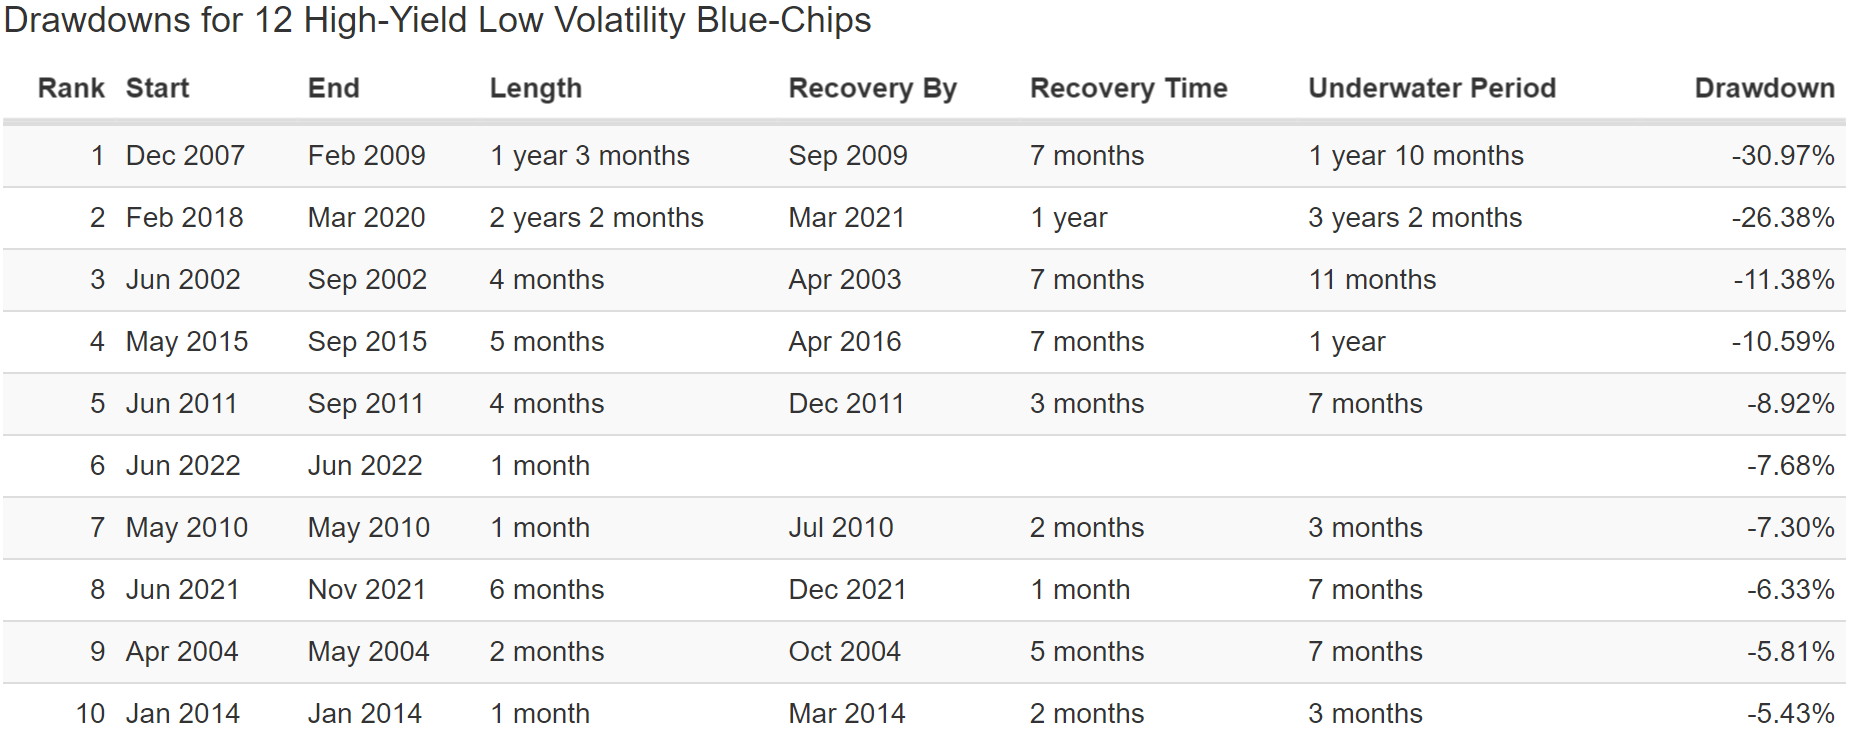
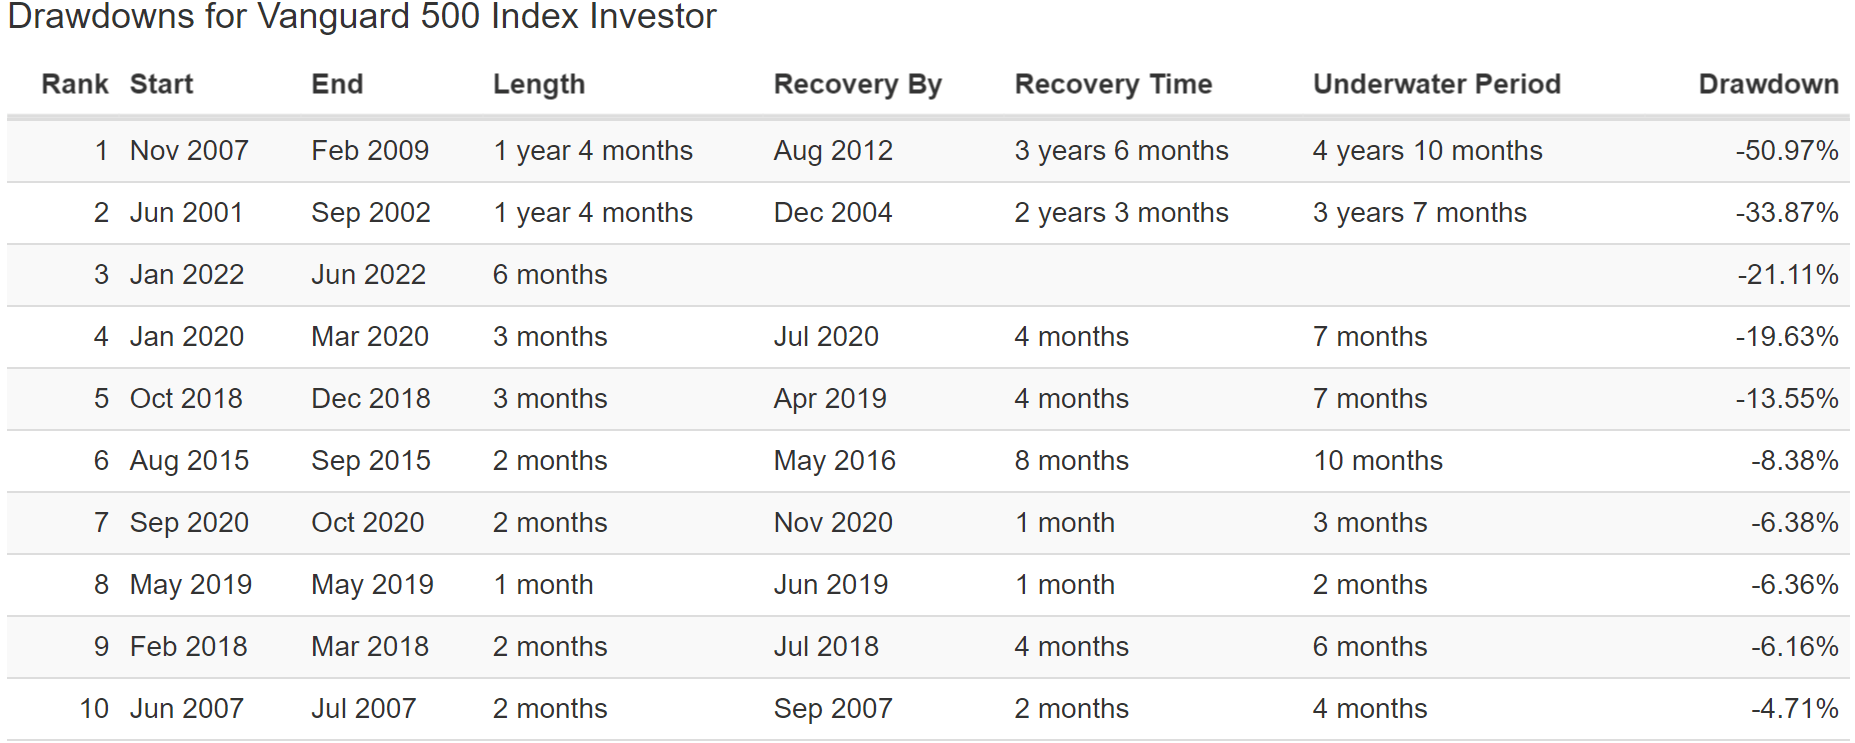
The S&P is down 21% in this bear market, the Nasdaq 31%, a 60/40 18%, and these low volatility high-yield Ultra SWANs just 8%.
And let’s not forget about income.
| Portfolio | 2002 Income Per $1,000 Investment | 2021 Income Per $1,000 Investment | Annual Income Growth | Starting Yield | 2021 Yield On Cost |
| 12 High-Yield, Low Volatility Blue-Chips | $48 | $663 | 14.82% | 4.8% | 66.3% |
(Source: Portfolio Visualizer Premium)
Over the last 19 years, these Ultra SWANs delivered 15% annual income growth turning a 4.8% yield in 2022 (lower than today) into a yield on cost of 66.3%.
What about future income growth?
| Analyst Consensus Income Growth Forecast | Risk-Adjusted Expected Income Growth | Risk And Tax-Adjusted Expected Income Growth |
Risk, Inflation, And Tax Adjusted Income Growth Consensus |
| 14.6% | 10.2% | 8.7% | 6.1% |
(Source: DK Research Terminal, FactSet Research)
Analysts expect similar 15% long-term income growth from these high-yield blue-chips.
Adjusting for the risk of these companies not growing as expected, inflation, and taxes, that’s 6.1% real expected income growth.
Now compare that to what they expect from the S&P 500.
| Time Frame | S&P Inflation-Adjusted Dividend Growth | S&P Inflation-Adjusted Earnings Growth |
| 1871-2021 | 1.6% | 2.1% |
| 1945-2021 | 2.4% | 3.5% |
| 1981-2021 (Modern Falling Rate Era) | 2.8% | 3.8% |
| 2008-2021 (Modern Low Rate Era) | 3.5% | 6.2% |
| FactSet Future Consensus | 2.0% | 5.2% |
(Sources: S&P, FactSet, Multipl.com)
What about a 60/40 retirement portfolio?
- 0.5% consensus inflation, risk, and tax-adjusted income growth.
In other words, these 4 midstream blue-chips offer:
- 3.5X the market’s yield (and a much safer yield at that)
- 3X its long-term inflation-adjusted consensus income growth potential
- 12X better long-term inflation-adjusted income growth than a 60/40 retirement portfolio
This is the power of high-yield, low volatility blue-chip investing in this bear market.
Bottom Line: Even If The Bear Market Is Just Getting Started, These High-Yield Blue-Chips Can Help You Retire In Safety And Splendor
Is the bear market nearing its bottom or just getting warmed up?
Yahoo Finance 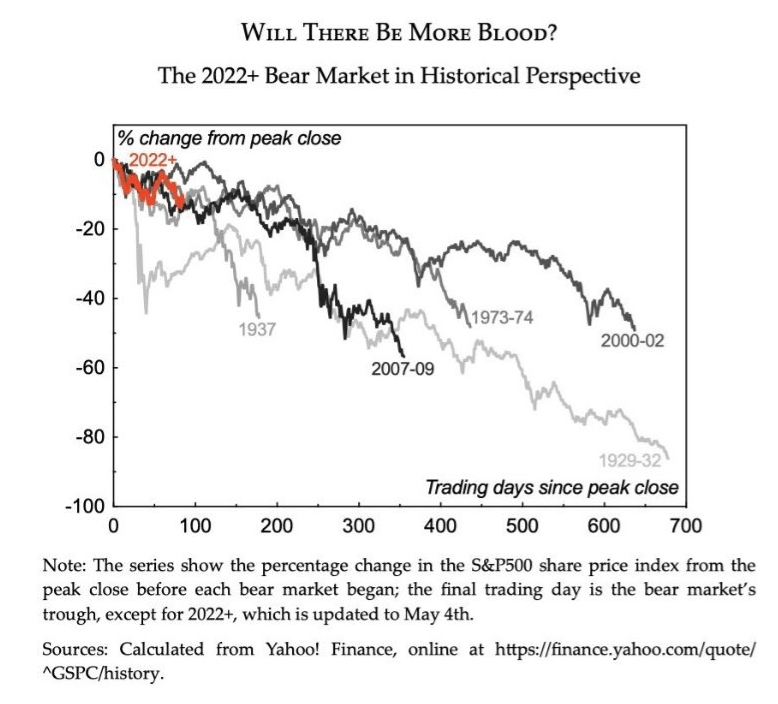
No one knows. This bear market might be bottoming soon or we might keep falling for several more months.
But here’s what I can tell you with high confidence about NVS, UL, MO, MMM, BTI, FLIC, ENB, BNS, TD, MMP, EPD, and MURGY.
- one of the safest 5.7% yields on earth
- 1.6% average risk of a dividend cut in a severe recession
- 6.6% long-term growth consensus
- 12.3% CAGR long-term return potential consensus
- vs 12.5% annual returns over the past 21 years (more than the S&P, aristocrats, and Nasdaq)
- A-credit rating
- 3.5% fundamental risk
- 23% undervalued
- 10.6X earnings
- 13% average annual volatility since 2001 vs 15% for the S&P 500
- 31% peak decline in the Great Recession vs 31% 60/40 and 50% S&P 500
- 8% decline so far in this bear market vs 18% 60/40, 21% S&P 500 and 31% Nasdaq
These are the kinds of companies that you want to own if the market still has 8% to 24% more to fall.
This is how you stop praying for luck on Wall Street and start making your own.
This is how you take charge of your financial destiny and retire in safety and splendor no matter what happens with inflation, interest rates, the economy, or the stock market in the coming years and decades.
Be the first to comment