

Jose Luis Pelaez Inc
According to BlackRock’s research, the US stock market has delivered 6.8% inflation-adjusted returns for the last 206 years.
- 768,561X real return since 1816
Ben Carlson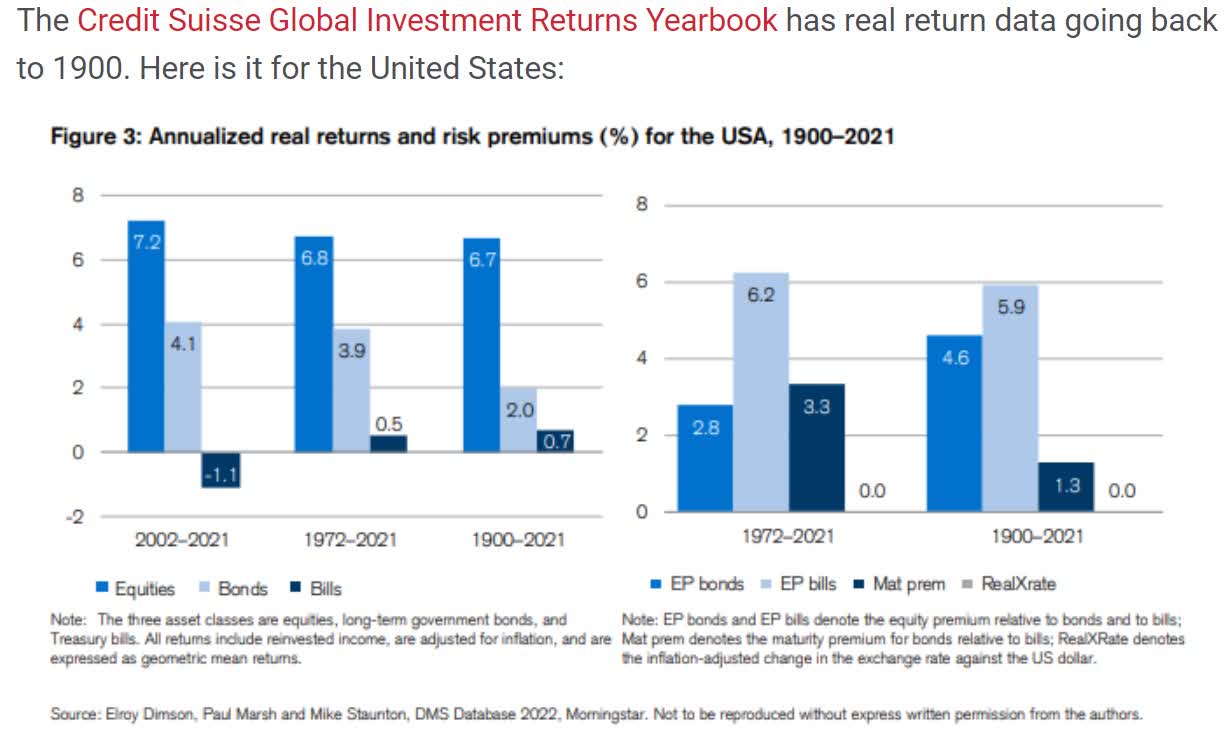
That’s similar to the returns it delivered since 1900, 1972, 2002, as well as since 1926 and 1950.
But the world is far larger than just the US. There are nearly 700,000 globally listed companies, with almost 9,000 large ones listed on the most popular exchanges.
Let me show you why international diversification is a powerful tool you can use to maximize your long-term income and wealth, and potentially retire in safety and splendor.
I’ll also show why international ETFs might not be the optimal strategy, and why you might want to build your own high-yield international blue-chip basket, to help you retire rich, and stay rich in retirement.
The Value In Owning International Companies
US and international companies go through long cycles of what’s outperforming the other.
Daily Shot
Do international stocks beat US stocks over the long-term? No, they don’t.
Ben Carlson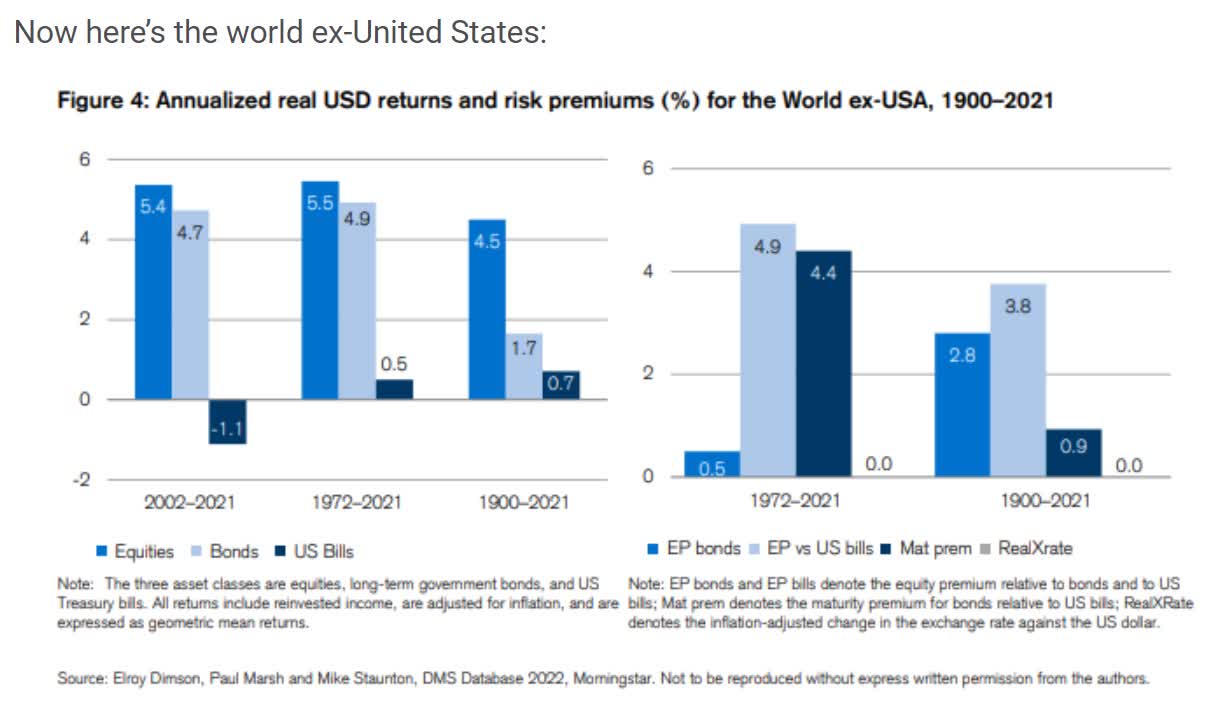
US stocks have outperformed international ones for 122 years.
- according to Fidelity, there is a 97% statistical probability that US companies will continue to outperform in the future
- due to superior governance, innovation, and various other factors
International stocks have also underperformed US stocks since:
- 1950
- 1996
- the last decade
But that doesn’t mean there isn’t value in owning international stocks.
Atlantic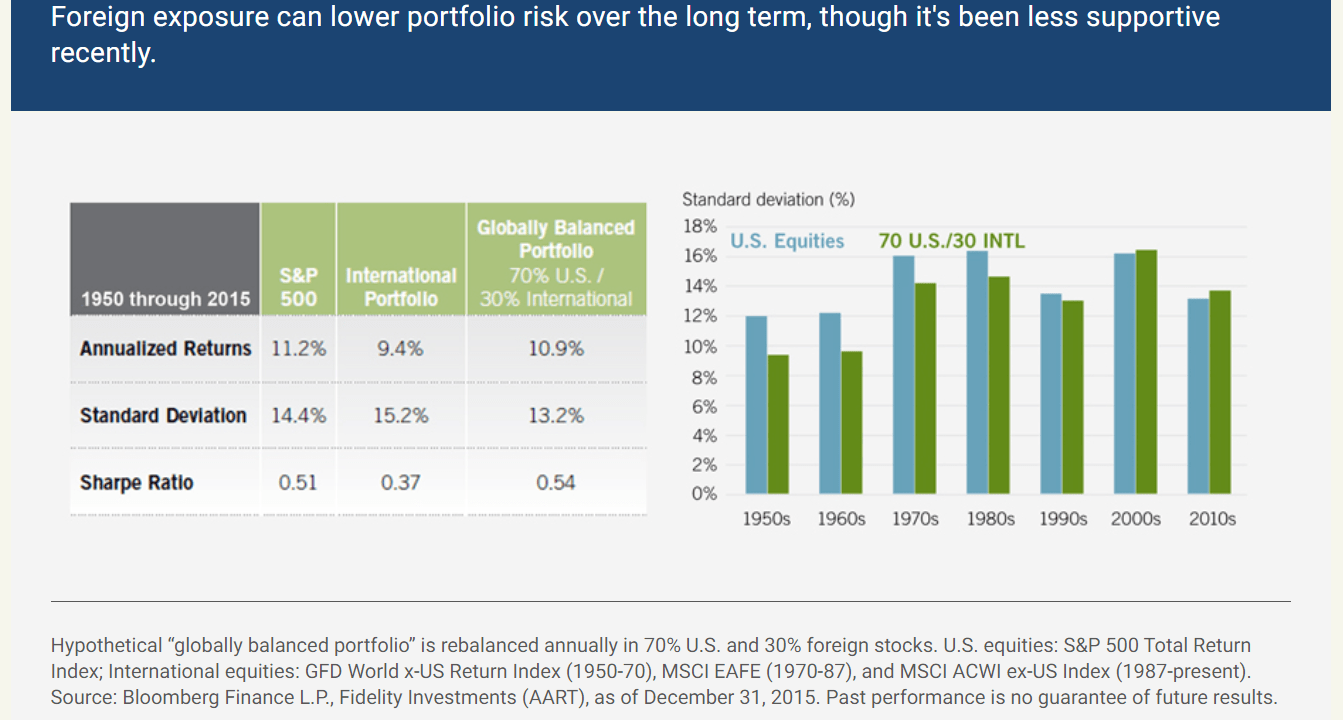
Since 1950 owning 30% international companies helped a diversified portfolio deliver slightly superior volatility-adjusted returns.
Depending on your return objectives and risk tolerance, your international allocation should be 5-25% of your total stock market investments. – Schwab
So what’s the best way to diversify your portfolio into foreign companies? It’s probably not through ETFs.
The Problem With International ETF Investing
I recently did a deep dive special video report look into four of Morningstar’s favorite high-yield ETFs. The best one was the Vanguard International High Dividend Yield Index (VYMI).
Let me show you the analysis to showcase why individual high-yield foreign companies are probably the best choice for achieving prudent international diversification.
Vanguard International High Dividend Yield Index
A nice balance between yield and risk…
Vanguard International High Dividend Yield Index has a lot to like. It strikes a favorable balance between pursuing stocks with high dividend yields and managing the associated risk, leaning toward larger, more stable firms that should offer some downside protection. After re-examining its advantages, we no longer think it ranks among the very best in the foreign large-value Morningstar Category, so we have downgraded its Morningstar Analyst Rating to Silver from Gold.
This fund tracks the FTSE All-World ex U.S. High Dividend Yield Index. It starts with large- and mid-cap stocks in the FTSE All-World ex U.S. Index, excluding REITs, and ranks them by their expected dividend yield over the next 12 months. The index selects those representing the higher-yielding half of eligible dividend-paying stocks. Focusing on dividend yield gives the portfolio a value orientation and can be a source of risk. High yields can stem from stocks with poor prospects and depressed prices. Some of these firms may also pay out a high percentage of their earnings as dividends, reducing the portion that can be reinvested to grow their businesses. – Morningstar
Portfolio Fundamentals
(Source: Morningstar)
The average PE for this ETF is 9X with a mind-blowing 4.3X cash flow. The 5.1% yield is also extremely attractive.
(Source: Morningstar)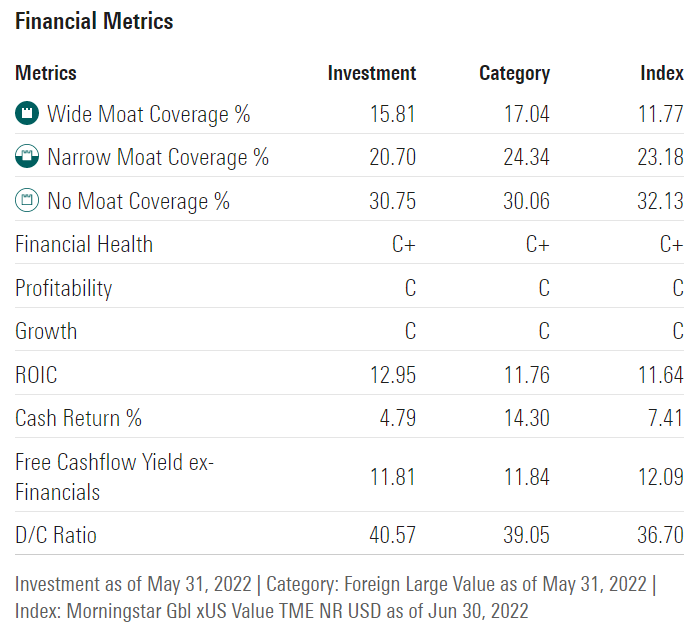
Financial health takes a hit with C+ and its 36% wide and narrow moat, with a lower 12% FCF yield and 41% very safe payout ratio.
(Source: Morningstar)
Highly diversified across every sector though overweight financials.
(Source: Morningstar)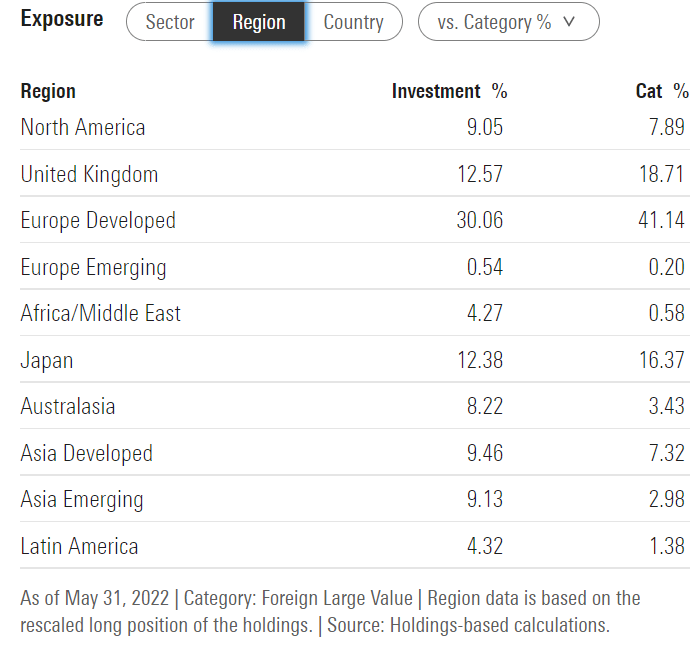
Highly diversified across every part of the world.
- 9% Canada
- 43% Europe
- 31% Asia
- 26% Australia/Latin America/Africa/Middle East
(Source: Morningstar)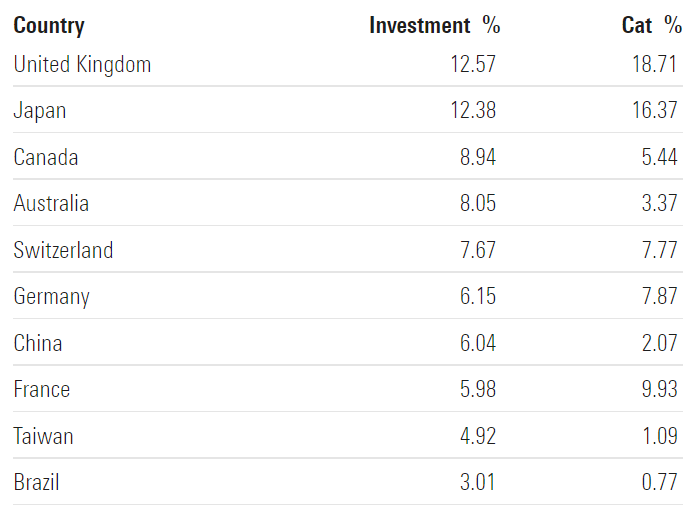
Focused on developed countries with prudent and diversified emerging market exposure (9% China and Brazil).
(Source: Morningstar) (Source: Morningstar) (Source: Morningstar)
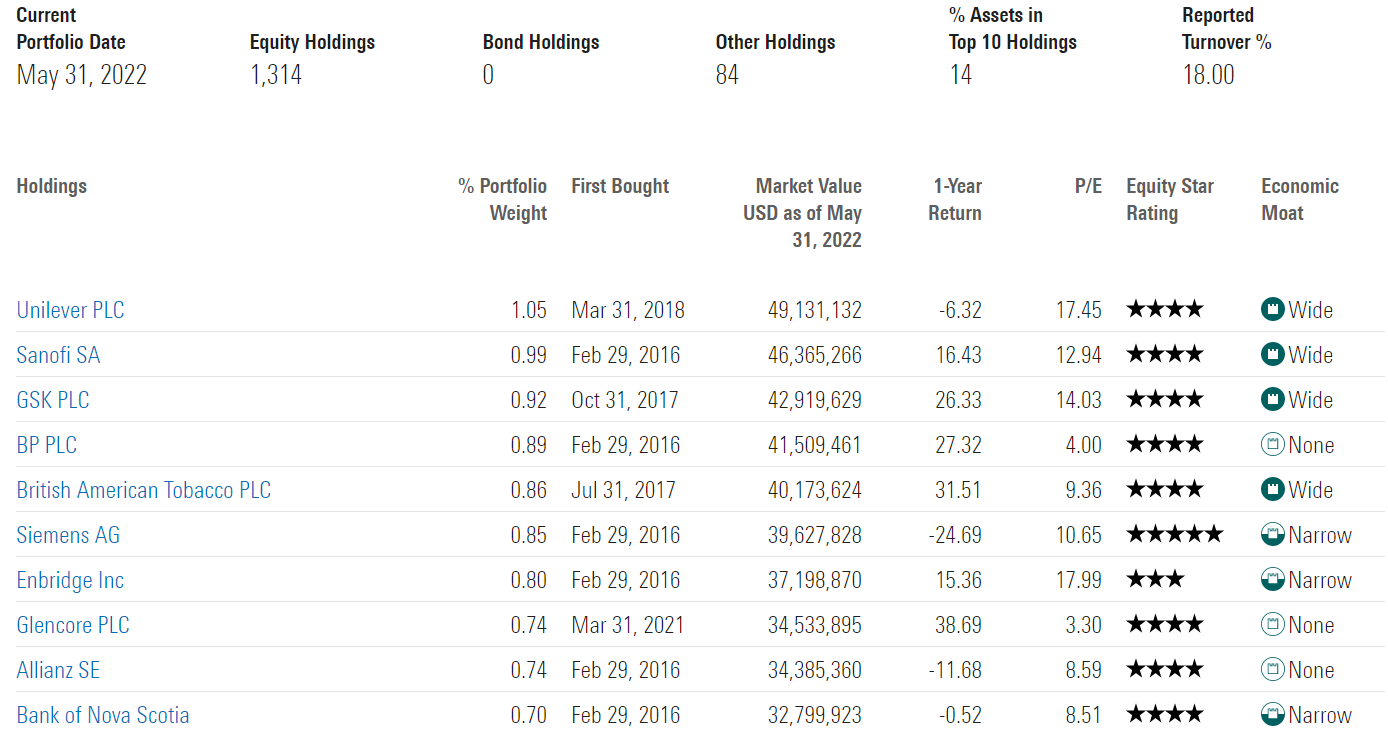
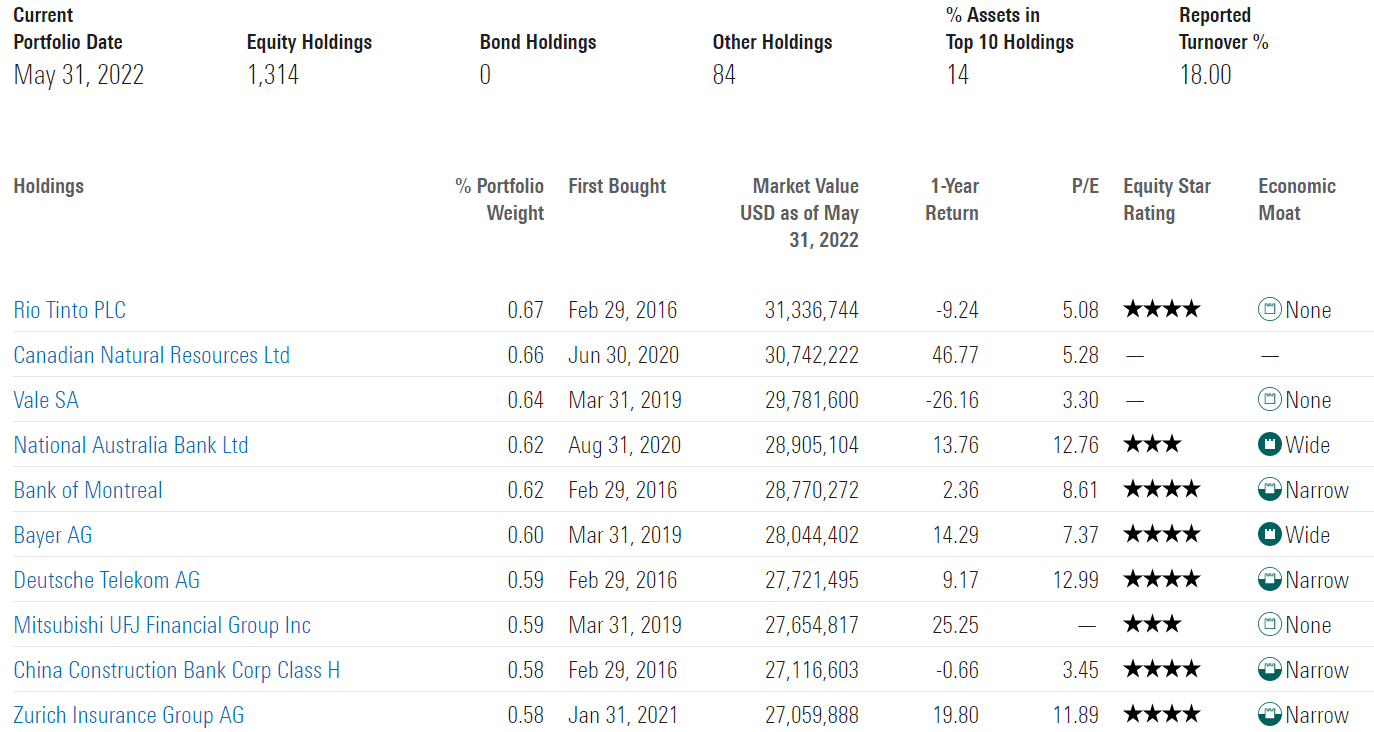
- over 1300 companies
- very low turnover
- some of our favorite high-yield blue-chips like ENB, BTI, ALIZY, and BNS
Historical Return Data: One Of The Best International ETF Still Underwhelms
The future doesn’t repeat, but it often rhymes. – Mark Twain
Past performance is no guarantee of future results, but studies show that blue-chips with relatively stable fundamentals over time offer predictable returns based on yield, growth, and valuation mean reversion.
Bank of America
So let’s take a look at how this ETF has done historically, since its inception dates.
Vanguard International High Yield Dividend Index ETF Since April 2016
(Source: Portfolio Visualizer Premium) (Source: Portfolio Visualizer Premium) (Source: Portfolio Visualizer Premium)

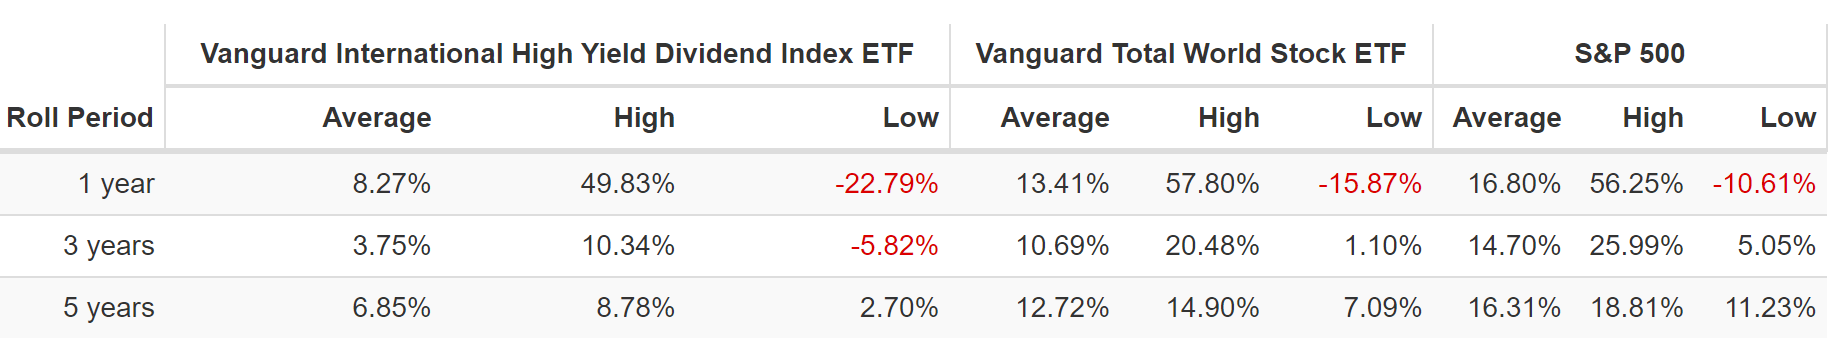
It’s six years of data but again we see some shockingly bad real returns.
- 7% inflation-adjusted return over 6 years = 1.1% CAGR real return
- vs 8.8% CAGR S&P
- S&P 500 outperformed international by 8X
Even the average 8.3% annual return was half that of the S&P 500 and far less than the global stock market (which is 50% US).
(Source: Portfolio Visualizer Premium)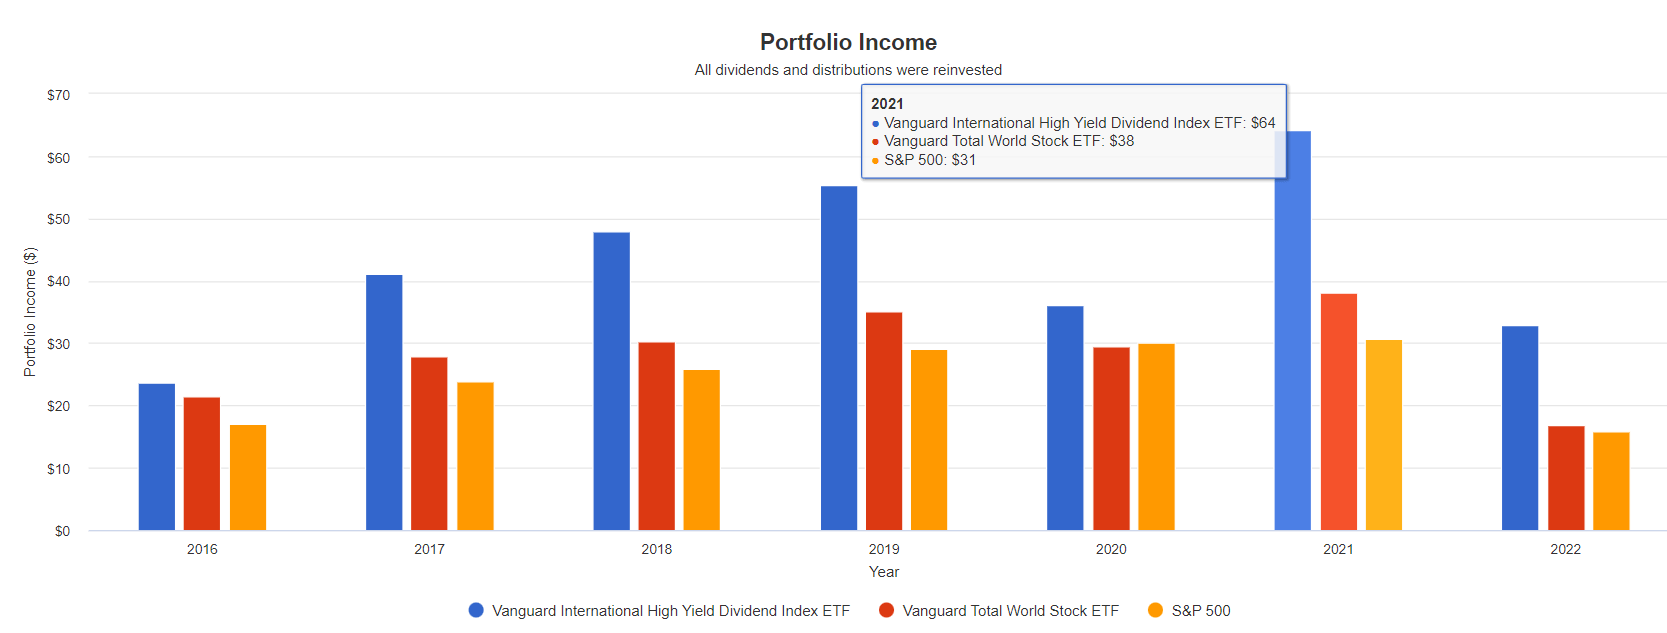
VYMI has a short dividend track record but it’s one of relatively consistent annual income growth, outside of the pandemic.
- potentially less stable income in recessions, time will tell
| Portfolio | 2017 Income Per $1,000 Investment | 2021 Income Per $1,000 Investment | Annual Income Growth | Starting Yield |
2021 Yield On Cost |
| S&P 500 | $24 | $31 | 6.61% | 2.4% | 3.1% |
| Vanguard International High Dividend Yield Index ETF | $41 | $64 | 11.78% | 4.1% | 6.4% |
(Source: Portfolio Visualizer Premium)
While only four years of full income data, VYMI’s dividend growth rate of 12% (including dividend reinvestment) is 2X that of the S&P 500 over this time frame.
What about future income growth?
| Analyst Consensus Income Growth Forecast | Risk-Adjusted Expected Income Growth | Risk And Tax-Adjusted Expected Income Growth |
Risk, Inflation, And Tax Adjusted Income Growth Consensus |
| 20.1% | 14.1% | 11.9% | 9.4% |
(Source: Portfolio Visualizer Premium)
I’m rather skeptical of Morningstar’s income growth forecast for VYMI, though less so than VXUS.
- since 2016 we’ve seen slower growth internationally which could mean revert
- thus driving 8.9% earnings and dividend growth
- I would personally expect about 9% income growth (roughly 4.5% after taxes and inflation)
- about 3X more than the S&P 500
Now compare that to what they expect from the S&P 500.
| Time Frame | S&P Inflation-Adjusted Dividend Growth | S&P Inflation-Adjusted Earnings Growth |
| 1871-2021 | 1.6% | 2.1% |
| 1945-2021 | 2.4% | 3.5% |
| 1981-2021 (Modern Falling Rate Era) | 2.8% | 3.8% |
| 2008-2021 (Modern Low Rate Era) | 3.5% | 6.2% |
| FactSet Future Consensus | 2.0% | 5.2% |
(Sources: S&P, FactSet, Multipl.com)
- 1.3% CAGR inflation, risk, and tax-adjusted expected dividend growth
Why do international ETFs underperform over time? Because of de-worsification.
Atlantic
The world’s best international blue-chips can make you rich. Most can’t, and owning a large number of foreign companies together is why international stocks have underperformed US ones for 122 years.
- also since 1950
- and since 1996
- and the last decade
How To Find The Best High-Yield International Blue-Chips In Minutes
Here is how I put together the following high-yield international blue-chip portfolio.
- which I’ll cover in depth in an upcoming article
The screening criteria I used were:
- foreign dividend stock list: (65 companies)
- good buys or better (margin of safety sufficient to compensate for each company’s risk profile and quality): 37 companies
- investment grade credit rating from S&P (BBB- or higher credit rating): 34 companies
- 3+% yield: 26 companies
- 12+% consensus long-term return potential: 14 companies
- 81+ safety score (2% or less risk of a dividend cut in a severe recession): 12 companies
- 80+ quality: Super SWAN or better overall quality (similar to dividend aristocrat quality): 12 companies
(Source: DK Zen Research Terminal)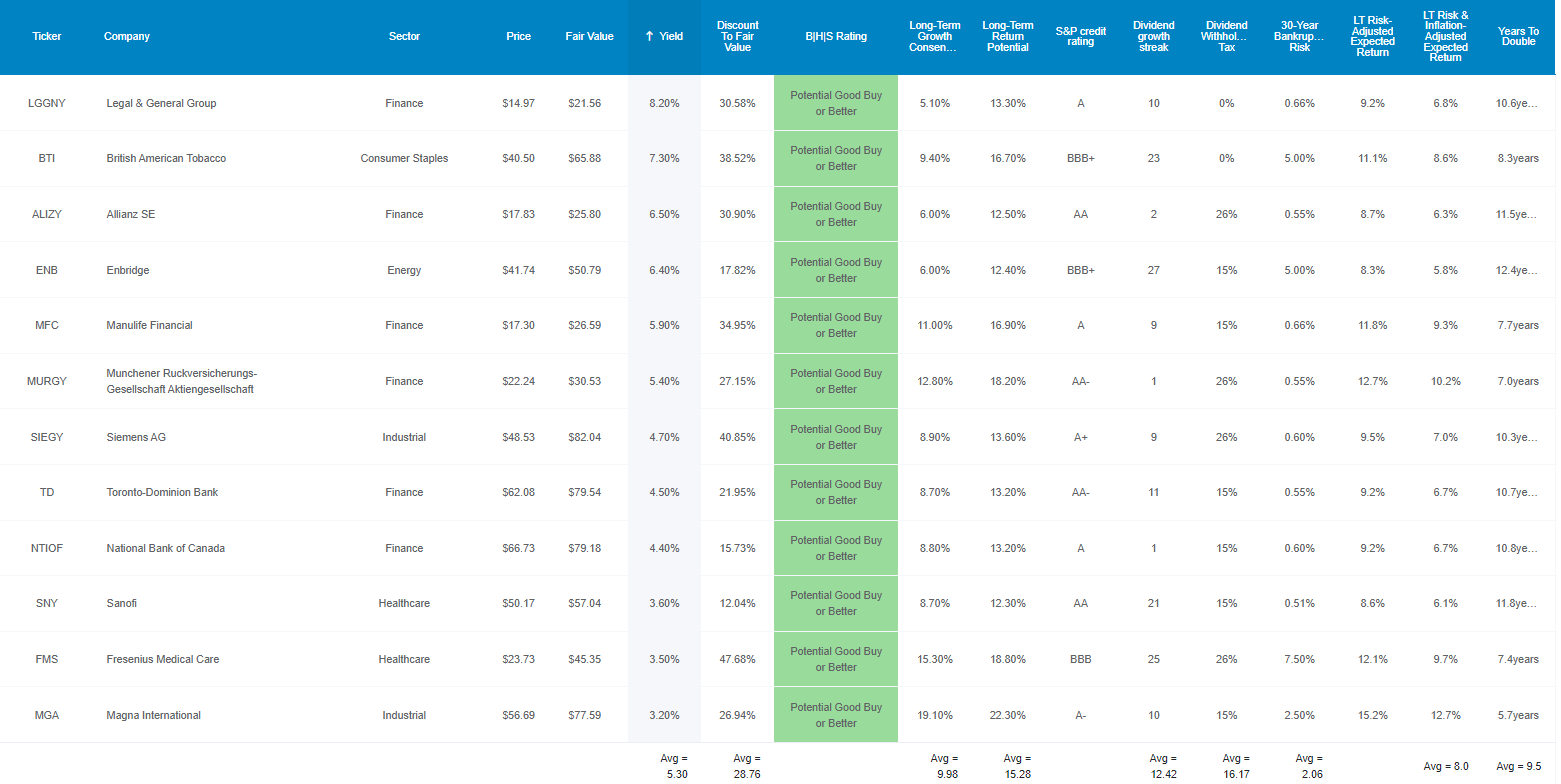
I’ve linked to articles that further clarify each company’s growth outlook, investment thesis, risk profile, valuation, and long-term return potential.
- Legal & General (OTCPK:LGGNY) (LGEN) – UK version avoids the ADR fee which is about 5% of the dividend – UK
- British American Tobacco (BTI) -UK
- Allianz (OTCPK:ALIZY) – Germany
- Enbridge (ENB) – Canada
- Manulife Financial (MFC) – Canada
- MunichRe (OTCPK:MURGY) – Germany
- Siemens (OTCPK:SIEGY) – Germany
- Toronto-Dominion Bank (TD) – Canada
- National Bank of Canada (OTCPK:NTIOF) – Canada
- Sanofi (SNY) – France
- Fresenius Medical Care (FMS) – Germany
- Magna International (MGA) – Canada
This high-yield international blue-chip portfolio yields a very safe 5.3% and analysts expect 10% long-term growth.
- 15.3% CAGR consensus long-term return potential
- inflation and risk-adjusted expected return: 8.0%
- time to double your money: 9.5 years vs 15.3 years S&P 500
Now let me show you all the reasons why these are 12 of the best under-the-radar (for American investors) high-yield blue-chip bargains you don’t want to miss.
12 High-Yield International Blue-Chip Bargains You Don’t Want To Miss
First, let me prove that these are 12 of the world’s best companies by showing you their exceptional safety and quality profiles.
(Source: DK Zen Research Terminal)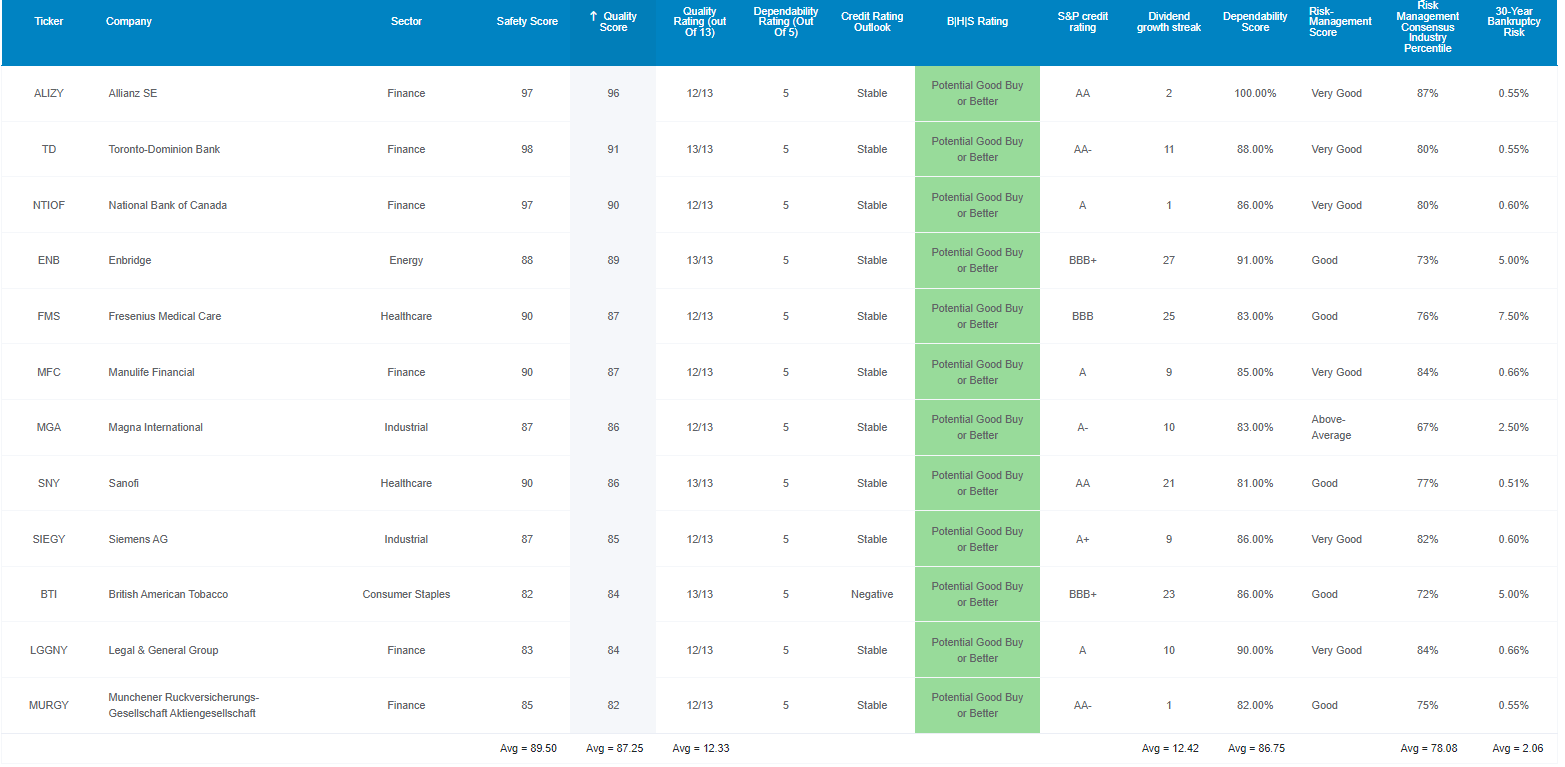
These aren’t just blue-chip companies they are 12/13 Super SWAN quality companies, some of the safest and most dependable companies on earth.
How do we know? By comparing them to the dividend aristocrats, the bluest of US dividend blue-chips.
Higher Quality Than The Dividend Aristocrats
| Metric | Dividend Aristocrats | 12 High-Yield International Blue-Chips | Winner Dividend Aristocrats |
12 High-Yield International Blue-Chips |
| Quality | 87% | 87% | 1 | 1 |
| Safety | 89% | 90% | 1 | |
| Dependability | 84% | 87% | 1 | |
| Long-Term Risk Management Industry Percentile | 67% Above-Average | 78% Good, Bordering On Very Good | 1 | |
| Average Credit Rating | A- Stable | A- Stable | 1 | 1 |
| Average 30-Year Bankruptcy Risk | 3.01% | 2.06% | 1 | |
| Average Dividend Growth Streak (Years) | 44.3 | 12.4 | 1 | |
| Average Return On Capital | 100% | 69% | 1 | |
| Average ROC Industry Percentile | 83% | 76% | 1 | |
| 13-Year Median ROC | 89% | 72% | 1 | |
| Forward PE | 18.8 | 9.2 | 1 | |
| Discount To Fair Value | 8.0% | 29.0% | 1 | |
| DK Rating | Good Buy | Very Strong Buy | 1 | |
| Yield | 2.6% | 5.3% | 1 | |
| LT Growth Consensus | 8.6% | 10.0% | 1 | |
| Total Return Potential | 11.2% | 15.3% | 1 | |
| Risk-Adjusted Expected Return | 7.6% | 10.5% | 1 | |
| Inflation & Risk-Adjusted Expected Return | 5.1% | 8.0% | 1 | |
| Years To Double | 14.0 | 9.0 | ||
| Total | 6 | 14 |
(Source: DK Zen Research Terminal)
These 5.3% yielding global Super SWANs offer one of the safest high-yields on earth. How safe?
| Rating | Dividend Kings Safety Score (162 Point Safety Model) | Approximate Dividend Cut Risk (Average Recession) | Approximate Dividend Cut Risk In Pandemic Level Recession |
| 1 – unsafe | 0% to 20% | over 4% | 16+% |
| 2- below average | 21% to 40% | over 2% | 8% to 16% |
| 3 – average | 41% to 60% | 2% | 4% to 8% |
| 4 – safe | 61% to 80% | 1% | 2% to 4% |
| 5- very safe | 81% to 100% | 0.5% | 1% to 2% |
| 12 High-Yield International Blue-Chips | 90% | 0.5% | 1.5% |
| Risk Rating | Low-Risk (78th industry percentile risk-management consensus) | A- stable outlook credit rating 2.06% 30-year bankruptcy risk | 15% OR LESS Max Risk Cap Recommendation (Each) |
(Source: DK Research Terminal)
Their average risk of a dividend cut in the historically average recession is about 1 in 200. The risk in a severe Pandemic or Great Recession level downturn is about 1 in 67.
The aristocrats beat these foreign blue-chips on dividend streak, but their average 12-year streak is still very good. How good?
Justin Law
In the pandemic companies with 12+ year dividend growth streaks were far less likely to cut their dividends.
Now let’s consider return on capital, Joel Greenblatt’s gold standard of proxy for quality and moatiness.
- return on capital = annual pre-tax profit/the cost of running the business
Greenblatt delivered 40% annual returns for 21 years using strategies based on undervalued companies with high ROC.
- S&P 500 ROC in 2021 was 14.6%
- aristocrats 100%
- these Super SWANs 69%
- not as good as aristocrats but almost 5X more than the S&P 500
Their average ROC industry percentile is 76%, not quite as wide moat as the aristocrats’ 83% but still indicating a wide moat.
Their 13-year median ROC is 72% indicating wide and stable moats over time.
S&P estimates their average 30-year bankruptcy risk at 2.06%, below the aristocrats 3%.
- A- stable credit rating, just like the aristocrats
- but with 50% lower fundamental risk on average
Finally, six rating agencies estimate their long-term risk-management at the 78th percentile.
- better risk management than all but 22% of companies in their respective industries
How good is that?
| Classification | Average Consensus LT Risk-Management Industry Percentile |
Risk-Management Rating |
| S&P Global (SPGI) #1 Risk Management In The Master List | 94 | Exceptional |
| 12 High-Yield International Blue-Chips | 78 |
Good – Bordering On Very Good |
| Strong ESG Stocks | 78 |
Good – Bordering On Very Good |
| Foreign Dividend Stocks | 75 | Good |
| Ultra SWANs | 71 | Good |
| Low Volatility Stocks | 68 | Above-Average |
| Dividend Aristocrats | 67 | Above-Average |
| Dividend Kings | 63 | Above-Average |
| Master List average | 62 | Above-Average |
| Hyper-Growth stocks | 61 | Above-Average |
| Monthly Dividend Stocks | 60 | Above-Average |
| Dividend Champions | 57 | Average bordering on above-average |
(Source: DK Research Terminal)
That’s far better than the aristocrats, better than the Ultra SWANs (wide moat aristocrats and future aristocrats), and better than the average foreign dividend company on the DK 500 Master List.
In other words, according to six rating agencies, these Super SWANs have adaptable and prudent management teams, strong balance sheets, and proven abilities to adapt and overcome challenges and adversity.
So now that you understand why these are 12 of the world’s best high-yield international blue-chips, let me show you why now might be a great time to buy some or all of them.
Wonderful Companies At Wonderful Prices
(Source: DK Zen Research Terminal)
For context, the S&P 500 trades at 15.9X forward earnings, a 6% historical discount.
- 10, 25, and 45-year average is 16.9X
- 97% statistical probability that about 17X forward earnings is fair value for US stocks
International stocks trade at 9X earnings, and these trade at 9.2X, a 29% historical discount.
- low-risk Super SWAN companies at a 29% discount are a potentially very strong buy for anyone comfortable with their risk profiles
But these are not your average international company, but 12 of the highest quality, safest, and most dependable names you can own.
The last time the S&P traded at 9.2X earnings? It bottomed at 9.3X in the Great Recession, the 2nd biggest US market crash in history.
- the S&P 500 hasn’t traded at 9.2X earnings since the early 1980s.
So these 12 high-yield blue-chips offer one of the world’s safest 5.3% yields (on par with the highest yielding international ETFs).
- 3X the S&P 500’s yield
- high-yield ETFs in the US (like VYM and SCHD) yield about 3.7%
Analysts expect them to deliver 44% total returns in the next 12 months.
And they are so undervalued that their fundamentals justify a 49% total return.
- if they all grow as expected and return to historical mid-range fair value then investors will see almost 50% total returns in the next year
But I’m not trying to JUST help you potentially earn 44% or even 50% returns in a year, though these high-yield blue-chips are capable of that.
My goal is to help achieve 20+X returns over the next few decades, potentially life-changing income and wealth compounding.
Long-Term Return Fundamentals That Could Help You Retire In Safety And Splendor
(Source: DK Zen Research Terminal)
Not only do these 12 international Super SWANs offer one of the safest 5.3% yields on earth, but analysts currently expect them to grow at 10% over time, potentially delivering 15.3% long-term total returns.
- on par with the greatest investors in history
- 8% risk and inflation-adjusted expected returns
- a doubling time of 9.5 years vs 14 years for dividend aristocrats and 15.3 years for the S&P 500
Inflation and risk-adjusted expected returns are the analyst consensus adjusted the risk of these companies not growing as expected, and even going bankrupt over the next 30 years.
- 8% vs 6.8% historical inflation-adjusted returns for the S&P 500
What could that potentially mean for you? Life-changing wealth and safe income compounding.
Inflation-Adjusted Consensus Total Return Potential: $1,000 Initial Investment
| Time Frame (Years) | 7.7% CAGR Inflation-Adjusted S&P Consensus | 8.7% Inflation-Adjusted Aristocrats Consensus | 12.8% CAGR Inflation-Adjusted 12 High-Yield International Blue-Chip Consensus | Difference Between Inflation-Adjusted 12 High-Yield International Blue-Chip Consensus Vs S&P Consensus |
| 5 | $1,451.05 | $1,519.66 | $1,828.62 | $377.56 |
| 10 | $2,105.56 | $2,309.37 | $3,343.84 | $1,238.29 |
| 15 | $3,055.27 | $3,509.46 | $6,114.61 | $3,059.34 |
| 20 | $4,433.36 | $5,333.20 | $11,181.29 | $6,747.92 |
| 25 | $6,433.04 | $8,104.66 | $20,446.30 | $14,013.26 |
| 30 | $9,334.69 | $12,316.34 | $37,388.47 | $28,053.78 |
(Source: DK Research Terminal, FactSet)
Analysts currently think these 12 high-yield blue-chips can deliver 37X inflation-adjusted returns over the next 30 years.
| Time Frame (Years) | Ratio Aristocrats/S&P Consensus | Ratio Inflation-Adjusted 12 High-Yield International Blue-Chip Consensus vs S&P consensus |
| 5 | 1.05 | 1.26 |
| 10 | 1.10 | 1.59 |
| 15 | 1.15 | 2.00 |
| 20 | 1.20 | 2.52 |
| 25 | 1.26 | 3.18 |
| 30 | 1.32 | 4.01 |
(Source: DK Research Terminal, FactSet)
That’s potentially 4X more than the S&P 500 and 3X more than the dividend aristocrats.
- and with 3X the yield on day one
What evidence is there that these 12 high-yield international blue-chips can deliver anything close to 15% returns or 8% risk-and inflation adjusted returns in the long-run?
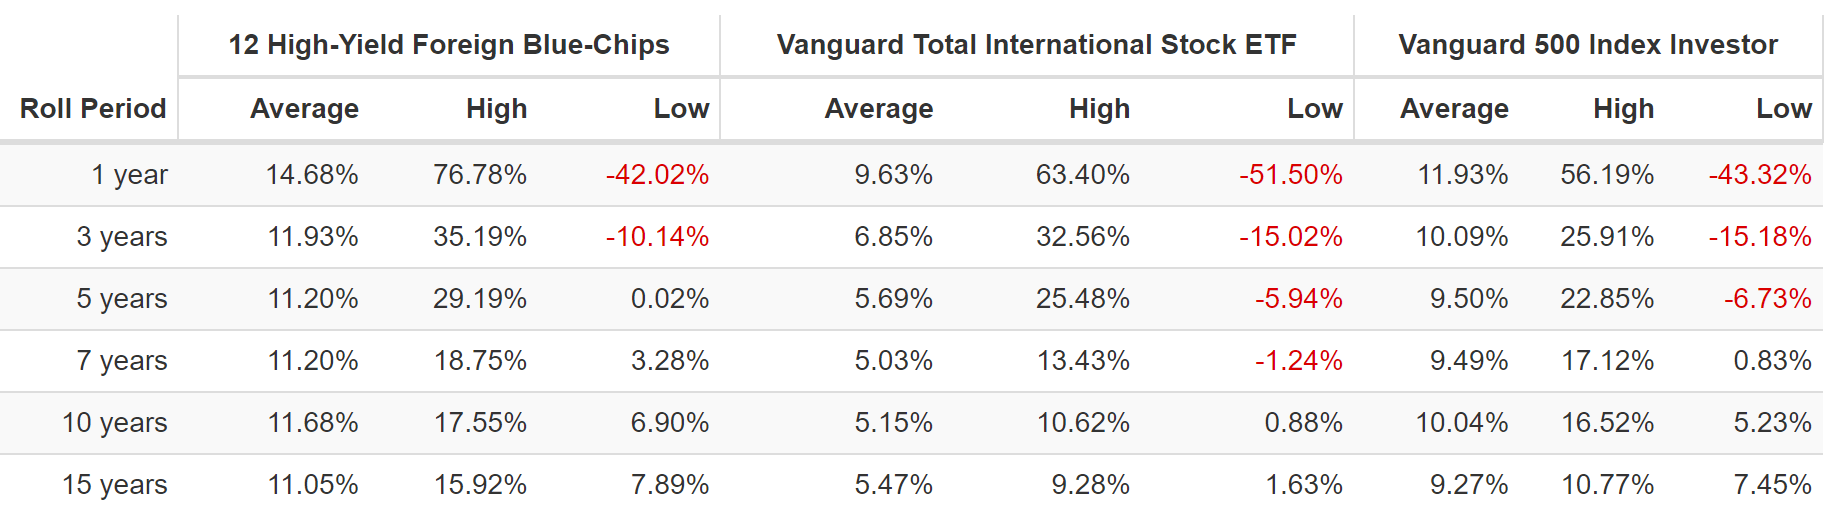
Historical Returns Since July 2002 (Equal Weight, Annual Rebalancing)
(Source: Portfolio Visualizer) (Source: Portfolio Visualizer)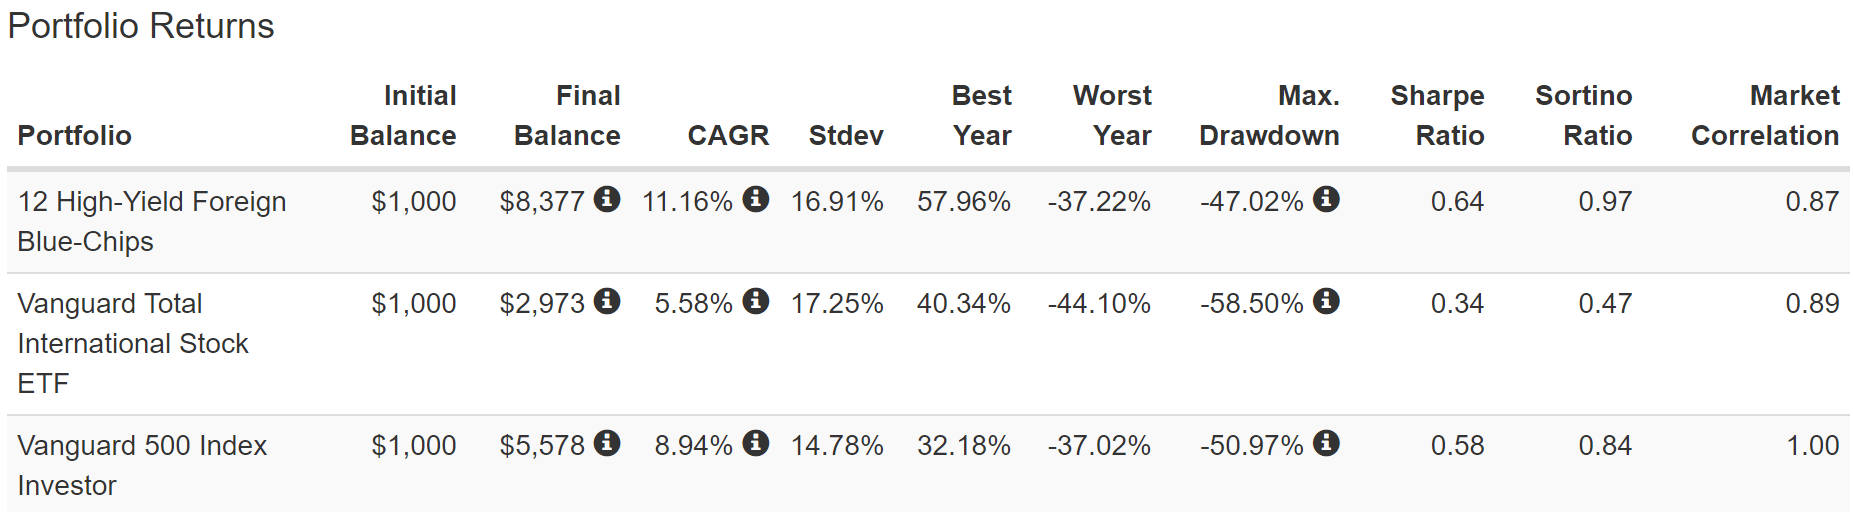
- Average 1-year return since 2002: 14.7%
- long-term returns: 11.2% = more than 2X international stocks
- lower volatility than international stocks
- smaller peak declines in the Great Recession
- 2.5X the negative volatility-adjusted returns of international stocks
- and a yield that’s more than 2% higher
These high-yield blue-chips didn’t deliver 15% returns over the last 20 years, but they did double the annual returns of international stocks and crush the market.
(Source: Portfolio Visualizer)
Over the last 20 years, these high-yield blue-chips delivered 5X inflation-adjusted returns or 8.4% CAGR inflation-adjusted returns.
What is their risk and inflation-adjusted expected return today? 8.0%.
- vs international stock 1.8X = 3.0% annual inflation-adjusted returns
- S&P 500’s 3.4X = 6.3% annual inflation-adjusted returns.
Or to put another way, in the last 20 year, when 91% of returns are explained by fundamentals and not luck:
- 33% better real returns than the S&P 500
- 2.8X better real returns than international stocks
These high-yield blue-chips’ superior quality isn’t just my opinion, or that of rating agencies or Joel Greenblatt, it’s object market-determined fact.
As Ben Graham, in the short-term, the market is a voting machine, but in the long-term, it’s a weighing machine, “correctly weighing the substance of a company”.
20 years of market and international stock outperformance of this magnitude means a 91% statistical probability that these are superior companies that will keep outperforming.
Just like US stocks outperforming international ones for 10 to 122 years, indicates that over the long-term US stocks are likely to keep outperforming.
But let’s not forget about income, the entire point of buying high-yield blue-chips in the first place.
(Source: Portfolio Visualizer)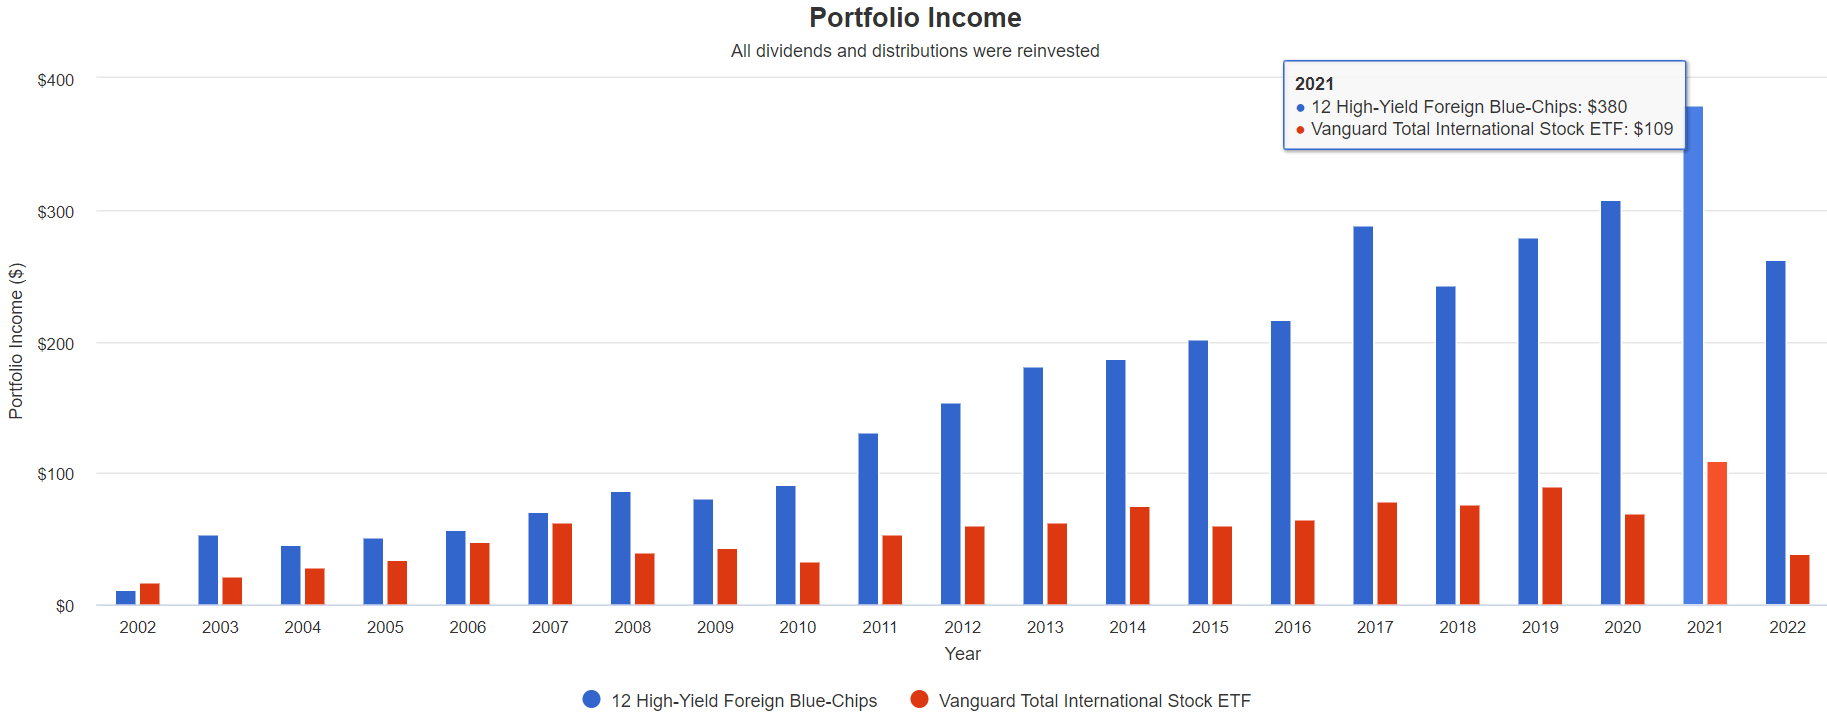
Compared to the S&P 500 and international stocks, these high-yield blue-chips offer far superior annual income growth and are far more stable, especially in recessions.
| Portfolio | 2003 | 2022 Income Per $1,000 Investment | Annual Income Growth | Starting Yield |
2022 Yield On Cost |
| S&P 500 | $17 | $86 | 9.42% | 1.7% | 8.6% |
| Vanguard International High Dividend Yield Index ETF | $21 | $78 | 7.56% | 2.1% | 7.8% |
| 12 High-Yield International Blue-Chips | $53 | $524 | 13.57% | 5.3% | 52.4% |
(Source: Portfolio Visualizer)
In the past 20 years, they’ve delivered 14% annual income growth, 2X that of international stocks, and 40% more than the S&P 500. They turned a 5.3% yield in 2023 (the same yield as today) into a 52.4% yield this year.
What about future income growth?
| Analyst Consensus Income Growth Forecast | Risk-Adjusted Expected Income Growth | Risk And Tax-Adjusted Expected Income Growth |
Risk, Inflation, And Tax Adjusted Income Growth Consensus |
| 13.9% | 9.7% | 8.3% | 5.7% |
(Source: DK Research Terminal, FactSet)
- 3.5X the S&P 500’s yield
- and potentially 3.5X faster real income growth
- 11X faster than a 60/40
This is the power of high-yield international blue-chip investing in a bear market.
Bottom Line: 12 High-Yield International Blue-Chip Bargains You Don’t Want To Miss
I can’t tell you when this bear market will end because that’s the short-term, and the market often does irrational things in the short-term.
| Time Frame (Years) |
Total Returns Explained By Fundamentals/Valuations |
| 1 Day | 0.01% |
| 1 month | 0.25% |
| 3 month | 0.75% |
| 6 months | 1.5% |
| 1 | 3% |
| 2 | 6% |
| 3 | 23% |
| 4 | 31% |
| 5 | 39% |
| 6 | 47% |
| 7 | 55% Medium-term |
| 8 | 62% |
| 9 | 70% |
| 10 | 78% Long-Term |
| 11+ | 90% to 91% |
| 30+ | 97% Very Long-Term |
(Sources: JPMorgan, Bank of America, Princeton, RIA, Fidelity)
Don’t even try to guess why the market does what it does in a day, week, or even year.
Do you know what the long-term really is?
If you aren’t willing to own a stock for 10 years, don’t even think about owning it for 10 minutes. – Warren Buffett
Good investing is harder than most periods because it represents real companies that operate on time frames spanning years and decades.
- blue-chip bear markets can last 7 years (in which they are constantly undervalued)
- bubbles can last 7 years as well
What happens over 6 years or less is mostly explained by luck and sentiment, not fundamentals.
That is the secret that Buffett has learned, embraces, and has made him the greatest investor of all time and one of the richest men on earth.
Buffett’s secret to success isn’t genius, it’s patience and discipline – the same patience and discipline that can help us all be better investors and compound our income and wealth to incredible degrees over years and decades.
And that’s where these incredible 12 high-yield blue-chip bargains come in.
- Legal & General (LGEN) – UK version avoids the ADR fee which is about 5% of the dividend – UK
- British American Tobacco – UK
- Allianz – Germany
- Enbridge – Canada
- Manulife Financial – Canada
- MunichRe – Germany
- Siemens – Germany
- Toronto-Dominion Bank – Canada
- National Bank of Canada – Canada
- Sanofi – France
- Fresenius Medical Care – Germany
- Magna International – Canada
Why consider these companies today?
- 5.3% very safe yield, 3X that of the S&P 500
- average A- stable credit rating, 2.1% 30-year bankruptcy risk
- 78th industry percentile risk management (good bordering on very good)
- 10% long-term growth consensus
- 15.3% long-term consensus return potential
- 8% risk and inflation-adjusted consensus return potential vs 8.4% inflation-adjusted over the last 20 years
- 2X better historical returns than international stocks
- 33% better historical returns than the S&P 500
After underperforming US companies for the last 122 years, no one should expect international stocks to beat the S&P.
But with the right individual international blue-chips, representing the crème de la crème of income-growing companies, you can not only enjoy safe, generous, and growing yield today but can potentially retire in safety and splendor tomorrow.
No matter what the economy or stock market does in the coming years and decades.
Be the first to comment