

You wanted a yield? Here’s a big juicy dividend yield. JackF/iStock via Getty Images
Get ready for charts, images, and tables because they are better than words. The ratings and outlooks we highlight here come after Scott Kennedy’s weekly updates in the REIT Forum. Your continued feedback is greatly appreciated, so please leave a comment with suggestions.
Mortgage REITs and preferred shares are fun again! What makes them fun? Inefficient prices. I love when prices get inefficient. They could be too high or too low, but either way is more fun than having prices be “about right”.
Do you know how hard it is to make an interesting article that says: “yeah, so the market got this about right and the risk/reward is pretty normal? Okay, thanks for clicking.”
Those articles are boring, so we want something different.
Last time I told investors that I would bring them an idea for a share that’s undervalued. Today, I fulfill that pledge by bringing you PennyMac Mortgage Investment Trust (PMT).
The REIT Forum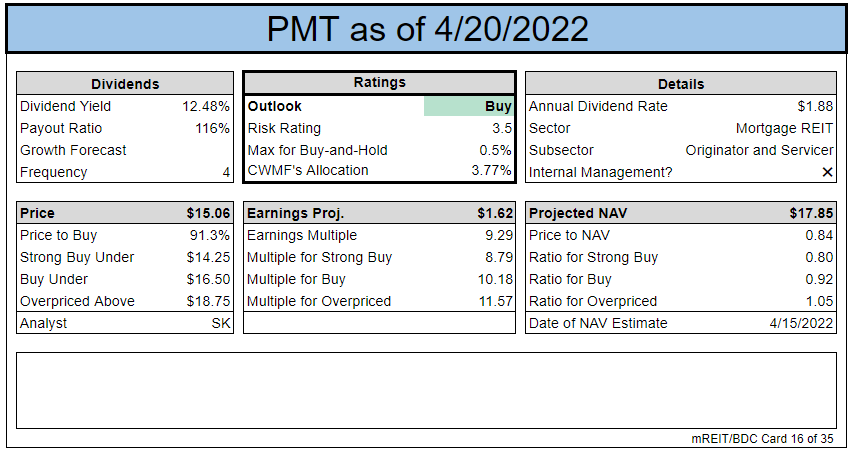
There are already two quick and easy ways to tell that PennyMac is undervalued. The first is that we said it before the image and the second is the “buy” rating for the outlook. It’s even highlighted!
Let’s check in for some recent comments from Scott Kennedy:
The REIT Forum
That’s a pretty clear comment. He increased his position in two of the shares we cover. I won’t be a jerk and leave other positions blocked out forever. It’ll be in an upcoming article, obviously that will be a public article because it wouldn’t make much sense otherwise.
Before I go too far, I want to reference that our targets for PMT have decreased to recognize a projected decline in book value. In late January, the target for PMT was a buy under $17.75. So why is the target lower and why do we maintain a bullish outlook?
Target Adjustments
We run frequent estimates on book value per share, in addition to estimates on earnings and dividend projections. As you may know, this has been a pretty tough year for mortgage REITs. We correctly picked a mortgage REIT with a portfolio better designed to withstand higher rates, but the magnitude of rate increases and widening spreads has pushed book value per share lower throughout the sector. So, it shouldn’t be a surprise that estimated values and targets are modestly lower.
The objective with mortgage REITs is not closing your eyes and collecting a massive yield forever. You might like to think that’s the goal, but it isn’t. You can make that your goal, but then you’re buying the wrong tool for the job. Might as well buy a drill when you need to hammer a nail. The shares do offer a very high yield, but you need to be monitoring them frequently, or at least having someone who monitors them for you and provides frequent updates.
The sad thing is investors who start out “needing” a 14% yield often find they soon need a 20% yield because their principal has decreased so much.
However, it is still possible to generate great returns in this sector. It just takes a bit of work. Why is work so effective? Because so many investors simply don’t do it.
Why PennyMac?
We’re projecting smaller declines in the net value of their investments. How can that be? Well, PennyMac owns a bunch of MSRs (mortgage-servicing rights). They kept increasing the size of that position:
PennyMac Mortgage Trust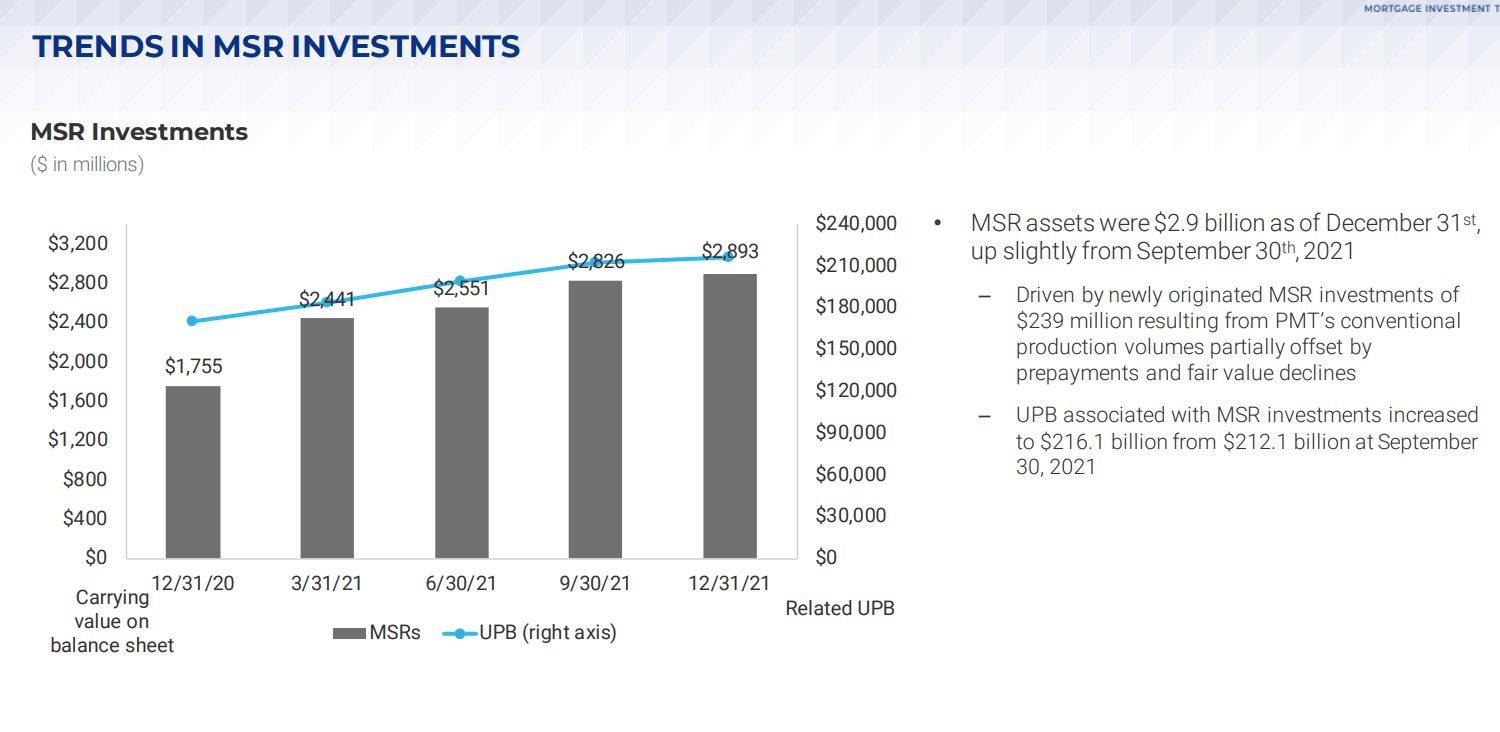
What is an MSR? It is the right to service a mortgage. Sounds boring? The company earns a modest amount of income from each mortgage they service. The unpaid balance is massive, so the total value of that income is pretty high. The one “bad” thing about MSRs is that customers can prepay their mortgage (refinance or move). When that happens, the MSR can die. Poof, no more MSR. Consequently, the MSR is only worth a few times the annual cash flow. What happens when the 30-year fixed rate mortgage goes from 3.25% to 5.25%? Do you think prepayments go up or down? Right, they plunge. Refinancing decreases dramatically, which means each of those MSRs will bring in far more money. For instance, imagine if you were going to make $50 per month for 4 years. If you could get that for 6 years, that would be better. Congratulations, you understand MSRs!
Can PennyMac Really Survive Rates Changing?
Yeah, they did pretty well before:
PennyMac Mortgage Trust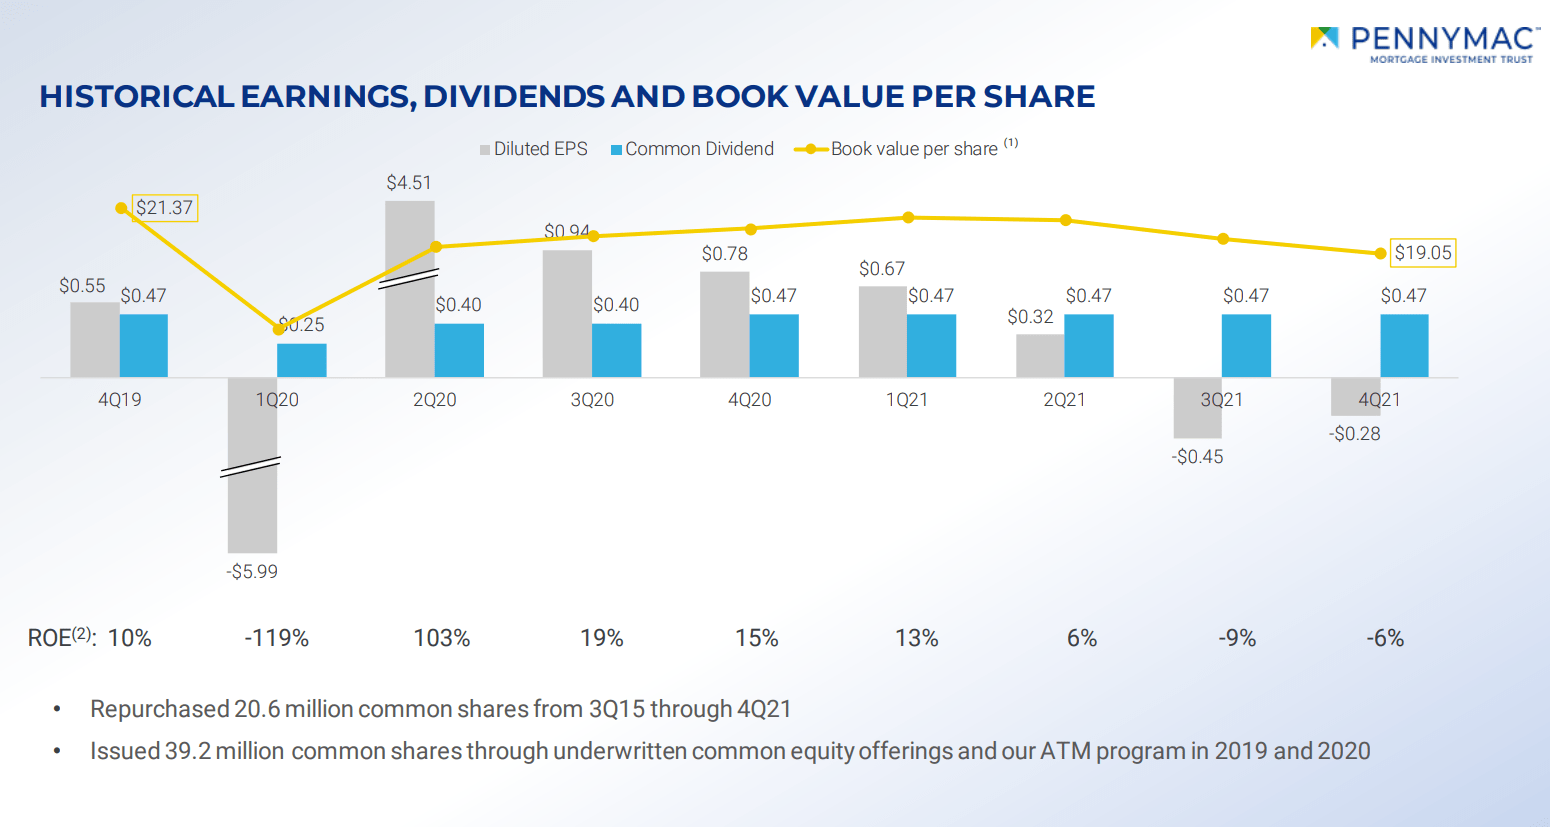
During the pandemic they took a hit, but it was smaller than most peers. They proceeded to bounce back nicely. Book value ended 2021 lower than it was before the pandemic, but that was an extremely difficult environment. Most mortgage REITs took it much worse.
So, what positioned PMT for those specific quarters? They own agency RMBS, right? Didn’t those plunge in value? Yes, and yes again, but they didn’t have the typical allocation. This is how PMT adjusted their portfolio in Q4 2021 and the final values for the year:
PennyMac Mortgage Trust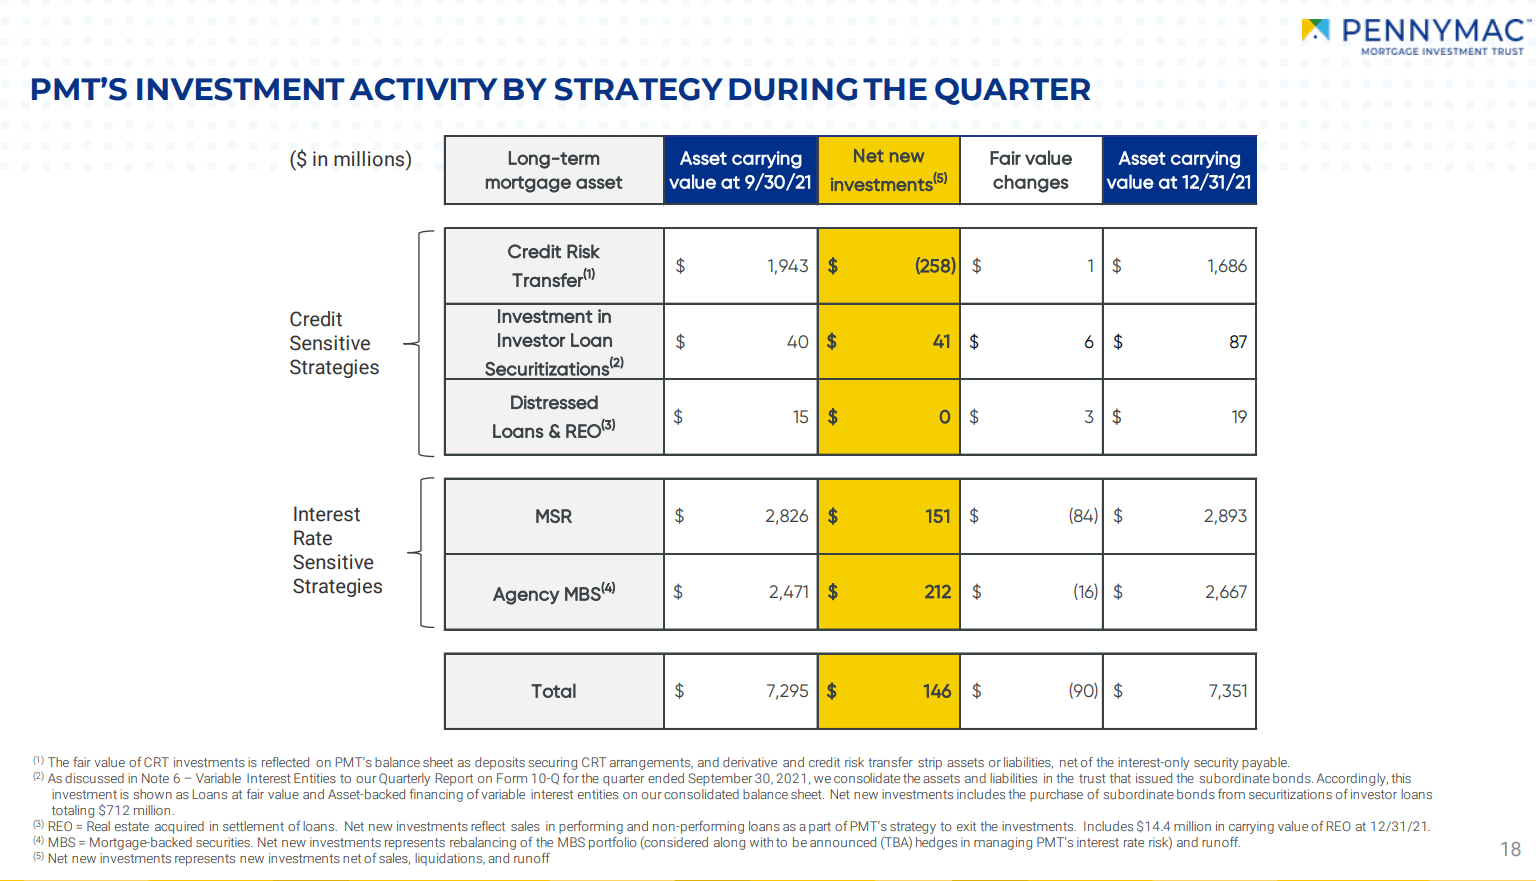
At the end of 2021, the value of MSRs was still higher than the value of agency MBS. That’s a big position in MSRs. They also had quite a bit invested in CRTs (Credit Risk Transfers). Since home values haven’t imploded, that isn’t a massive problem. Generally speaking, it’s the REITs with huge positions in agency MBS that were facing a rougher Q1 2022.
For comparison, this is the portfolio for AGNC Investment Corp. (AGNC):
AGNC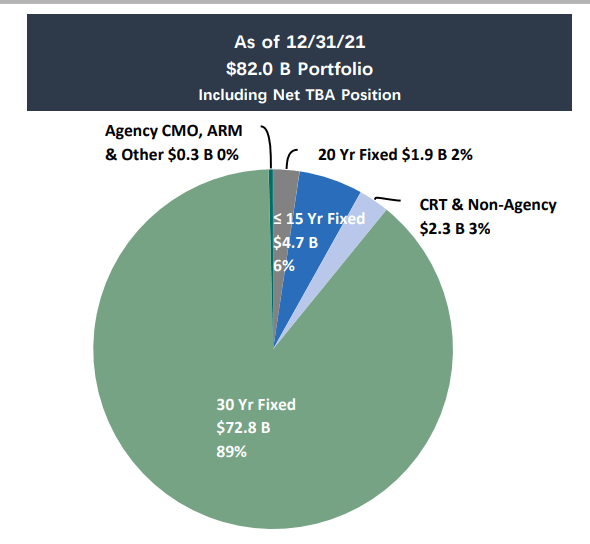
89% of the total asset value including net TBA exposure (which is a contract to purchase an asset at a specified price) was in 30-year fixed-rate MBS. Compared to that, PMT’s allocation is relatively small.
What Does it Mean?
PMT is one of the better options for investors in the sector today. Shares trade at a significant discount to projected book value. While projected book value has declined amid a very difficult period, it declined less than share prices. That’s important because book value is the source of capital for management to invest. A REIT without book value would have a hard time financing any assets. Because they’ve been able to protect book value, they’ve been in a better position to protect their income as well.
We can see that at work looking at their dividend history as well:
Seeking Alpha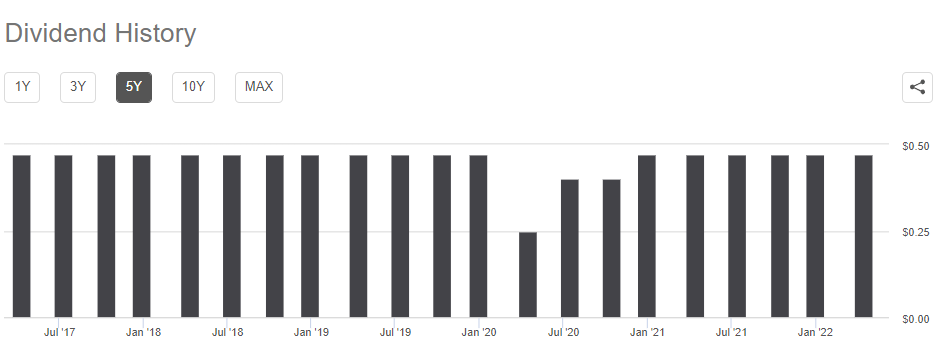
Five years ago, it was $.47 per share. During the pandemic, they trimmed the dividend to retain capital. Then they recovered and brought it back. There are very few mortgage REITs who had the same dividend level for 2021 as they did for 2016, 2017, and 2018. While dividend projections generally stay within the REIT Forum, I wanted to take a moment to highlight PMT’s much stronger history. With PMT’s superior history and portfolio positioned to withstand changes in interest rates better than many mortgage REITs, they earned one of our lowest risk ratings among the common shares.
One Last Thing
In the prior article I left out the index card for NLY-F (NLY.PF). It was requested in the comments, so here it is:
The REIT Forum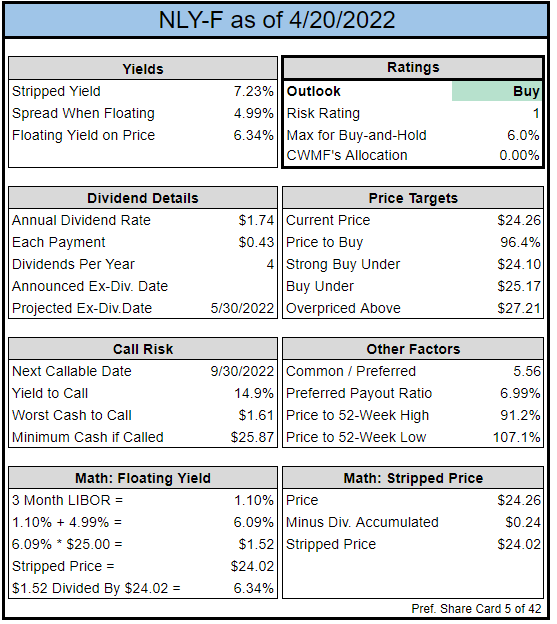
The rest of the charts in this article may be self-explanatory to some investors. However, if you’d like to know more about them you’re encouraged to see our notes for the series.
Stock Table
We will close out the rest of the article with the tables and charts we provide for readers to help them track the sector for both common shares and preferred shares.
We’re including a quick table for the common shares that will be shown in our tables:
Let the images begin!
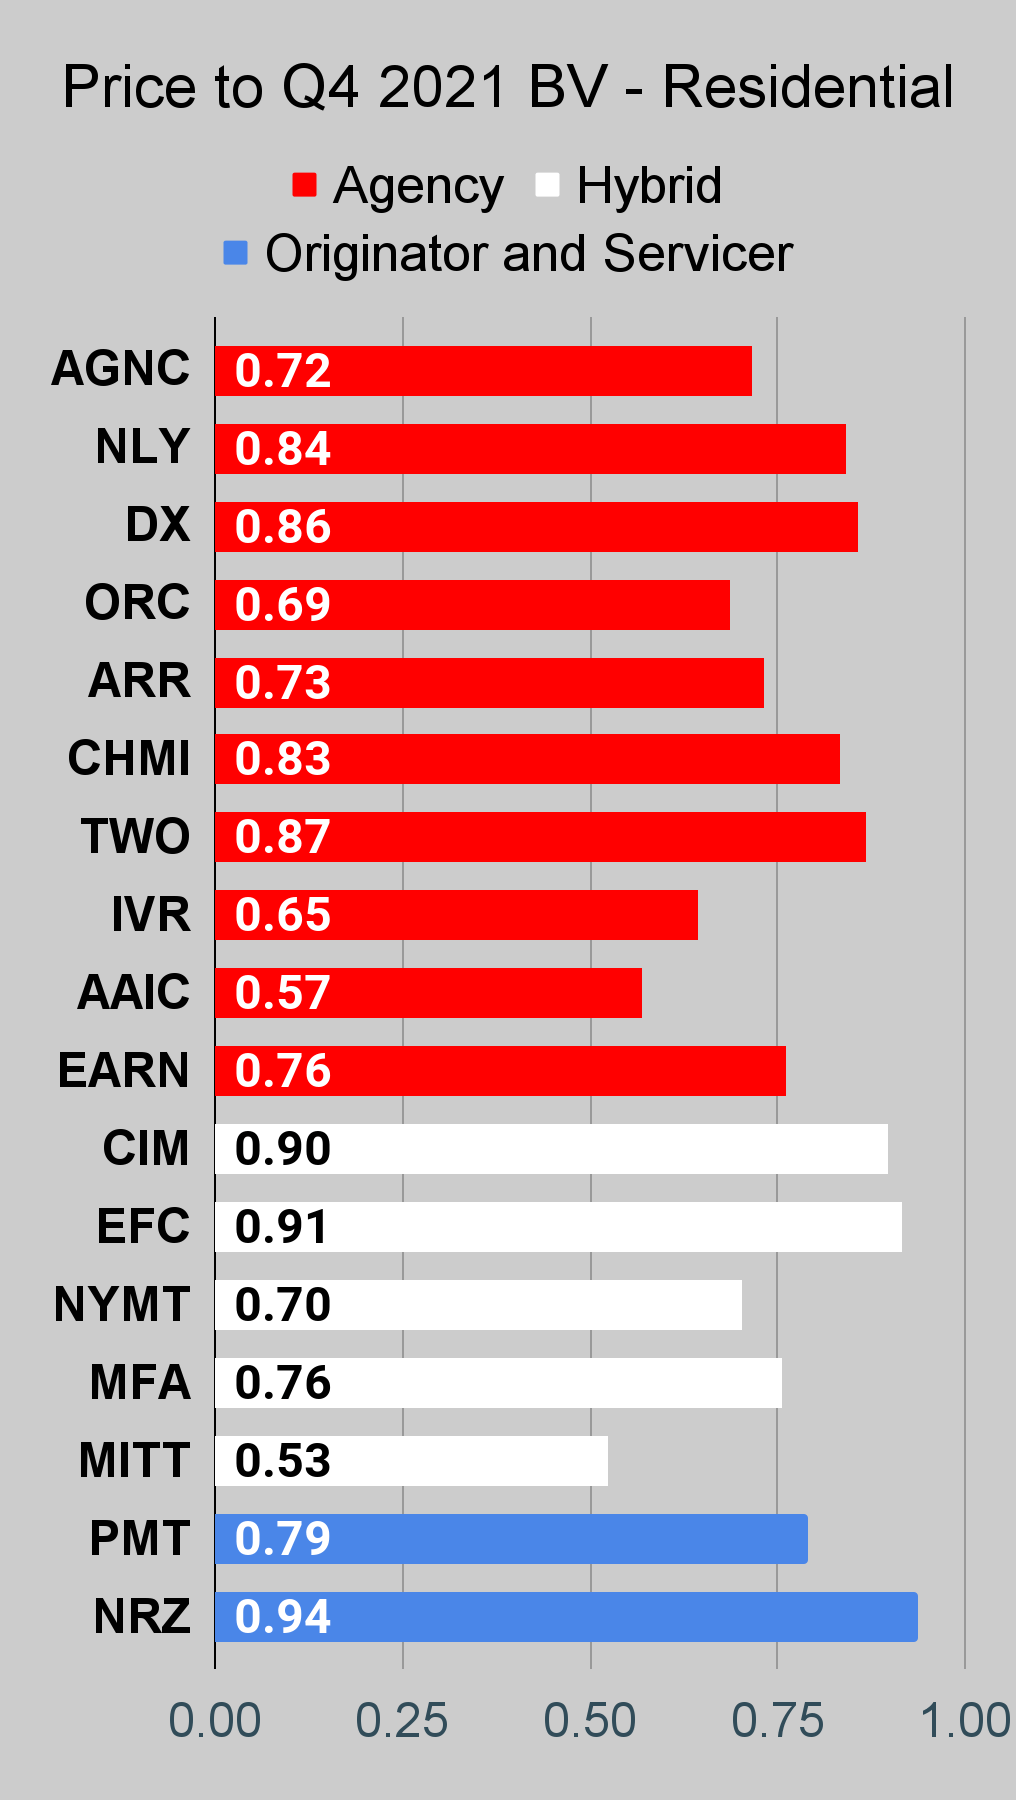
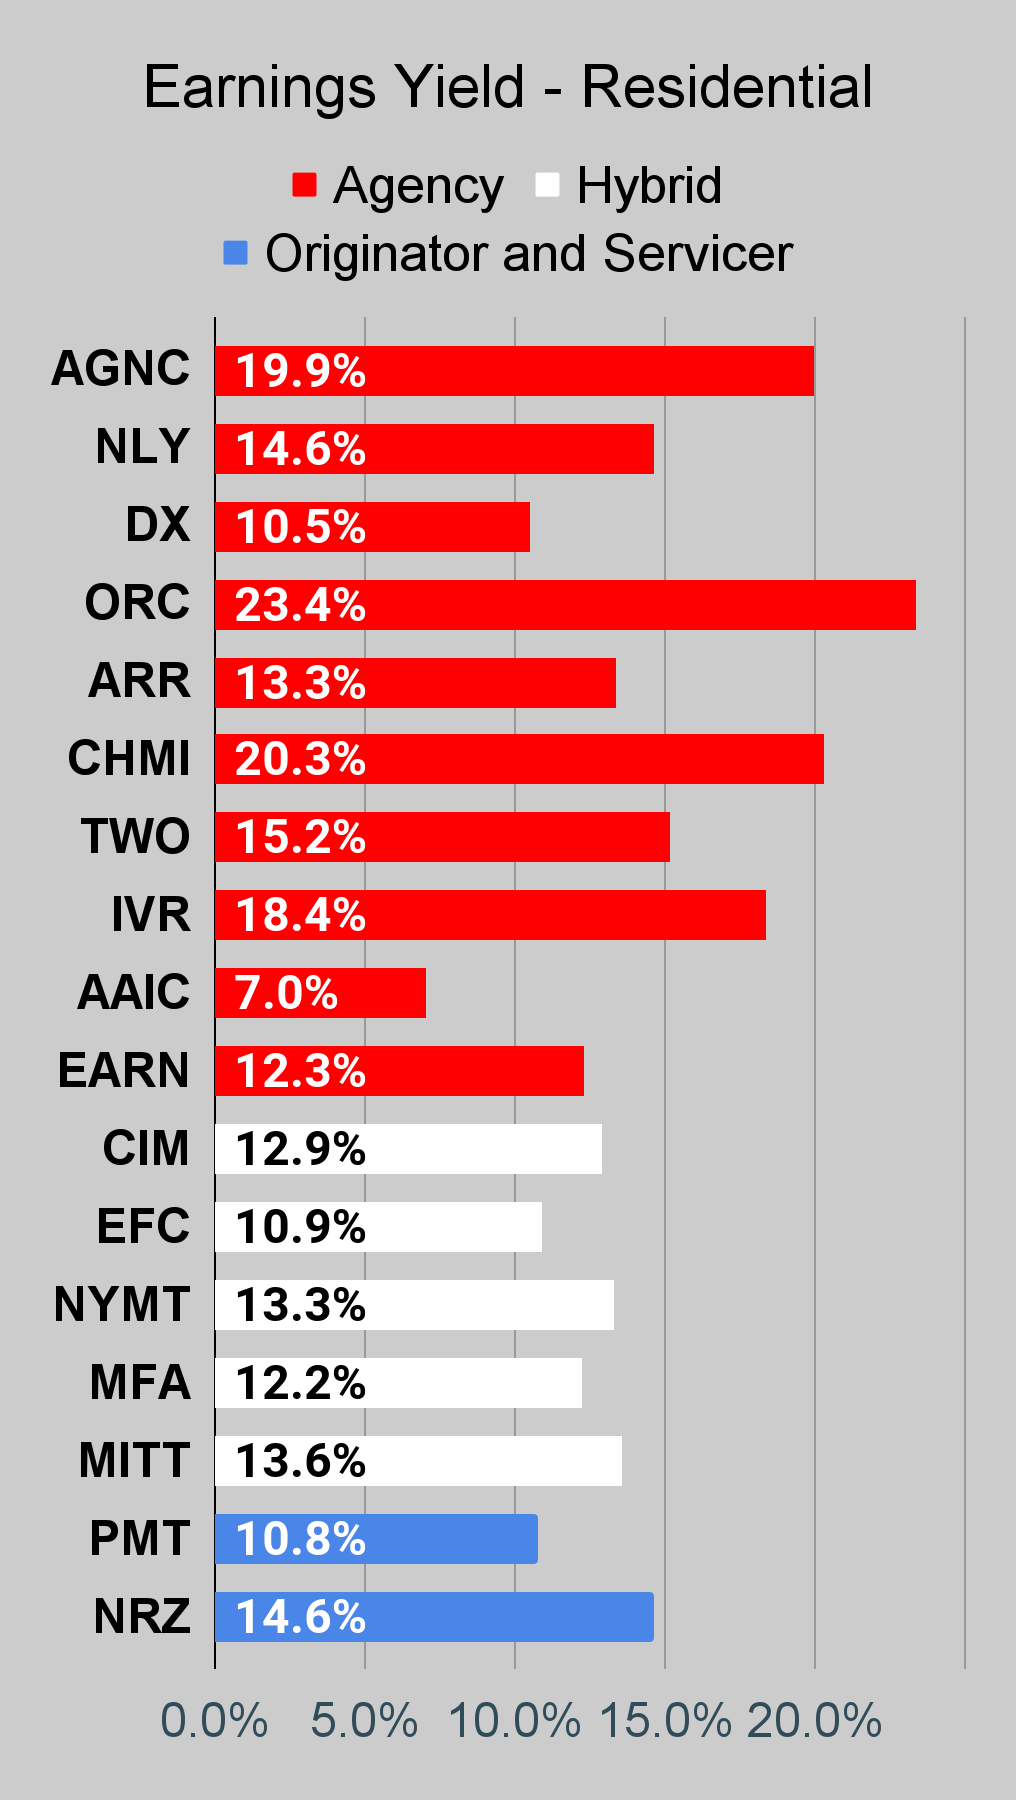
Residential Mortgage REIT Charts
Note: We are modeling some significant changes to BV since 12/31/2021 and some management teams have already publicly indicated a material change in BV per share. The chart for our public articles uses the book value per share from the latest earnings release. Current estimated book value per share is used in reaching our targets and trading decisions. It is available in our service, but those estimates are not included in the charts below.
 The REIT Forum |
 The REIT Forum |
 The REIT Forum |
Source: The REIT Forum
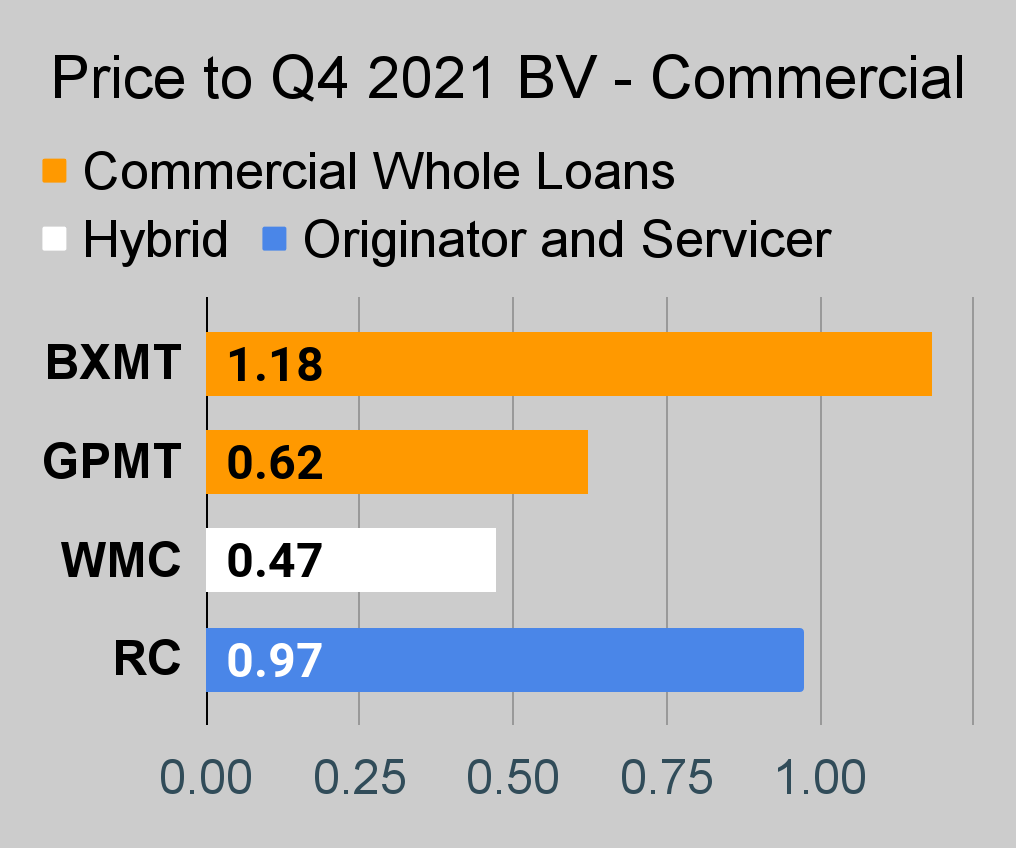
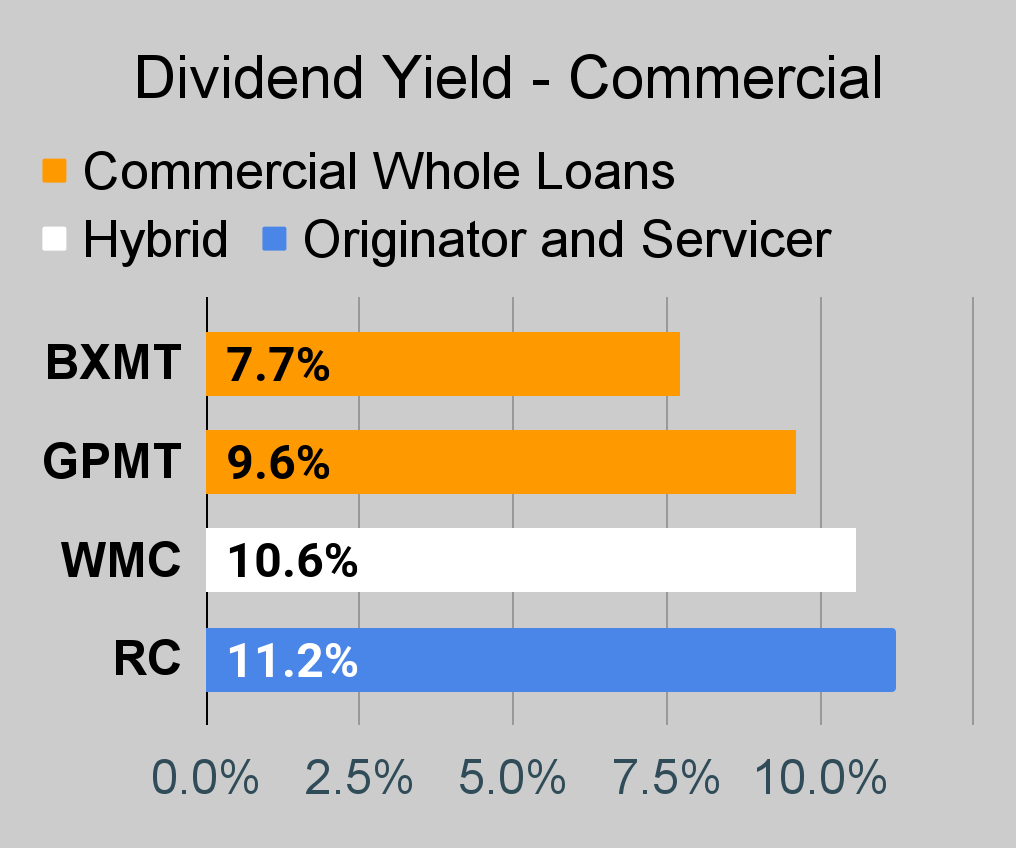
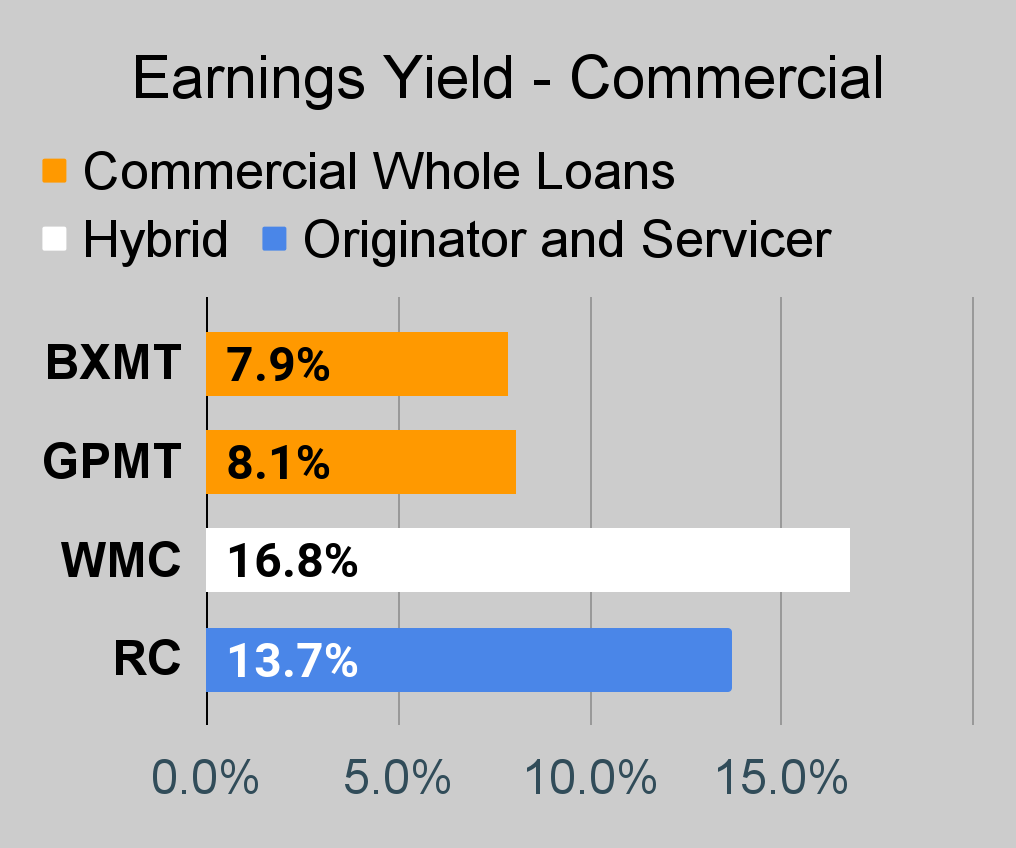
Commercial Mortgage REIT Charts
 The REIT Forum |
 The REIT Forum |
 The REIT Forum |
BDC Charts
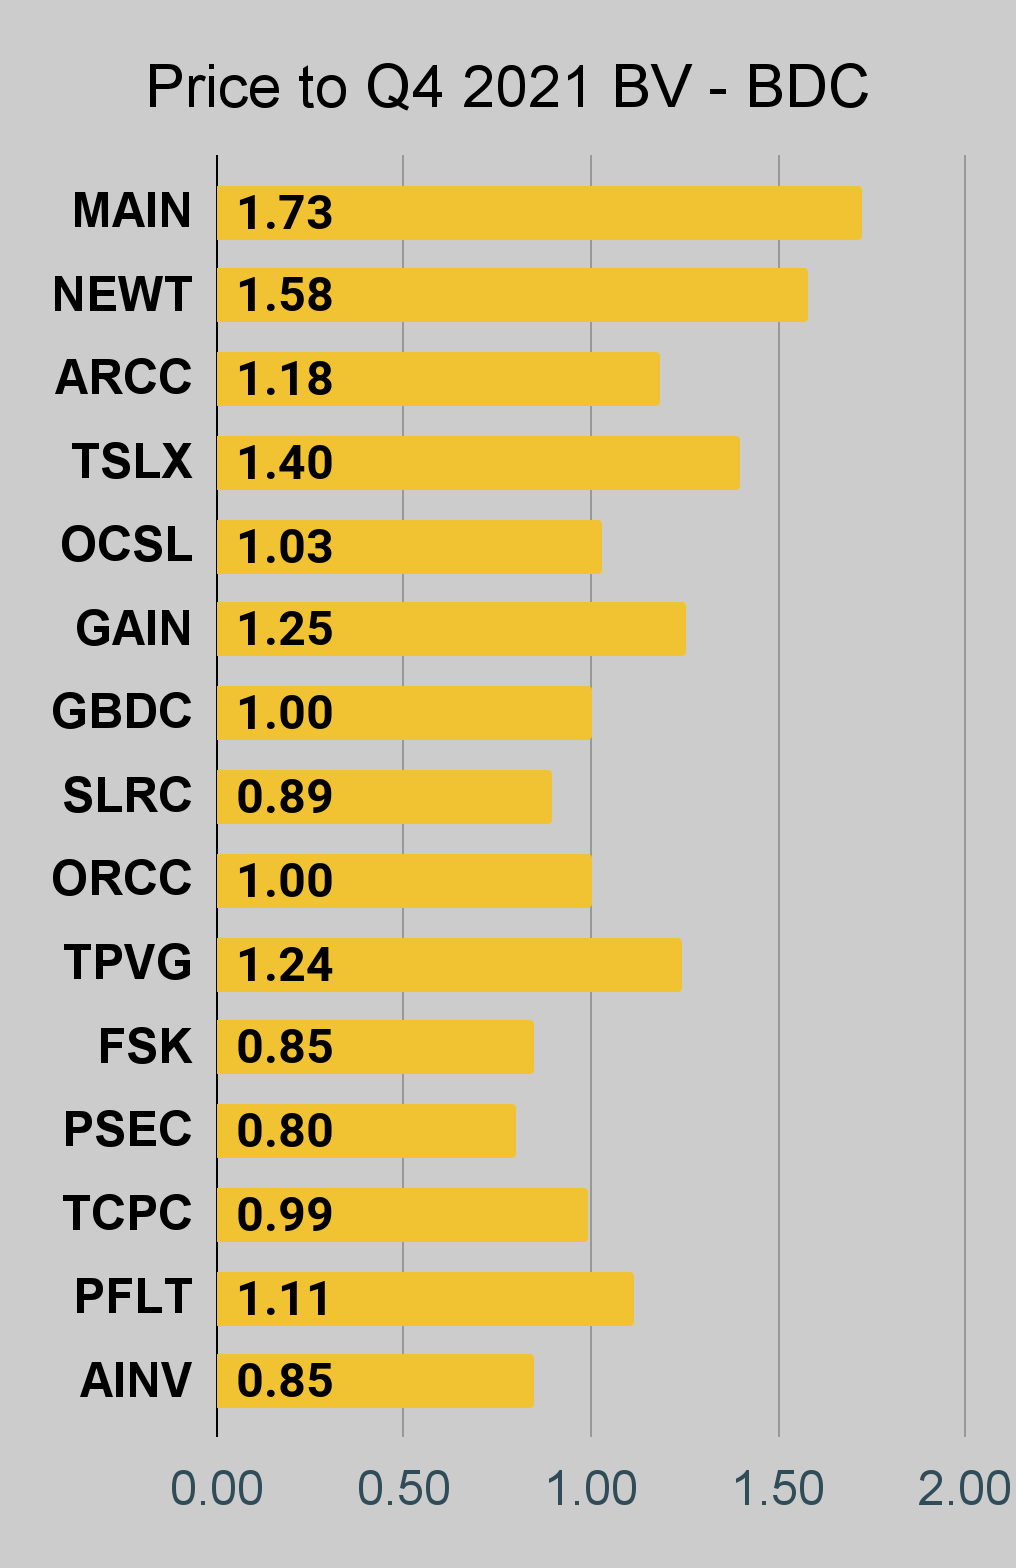 The REIT Forum |
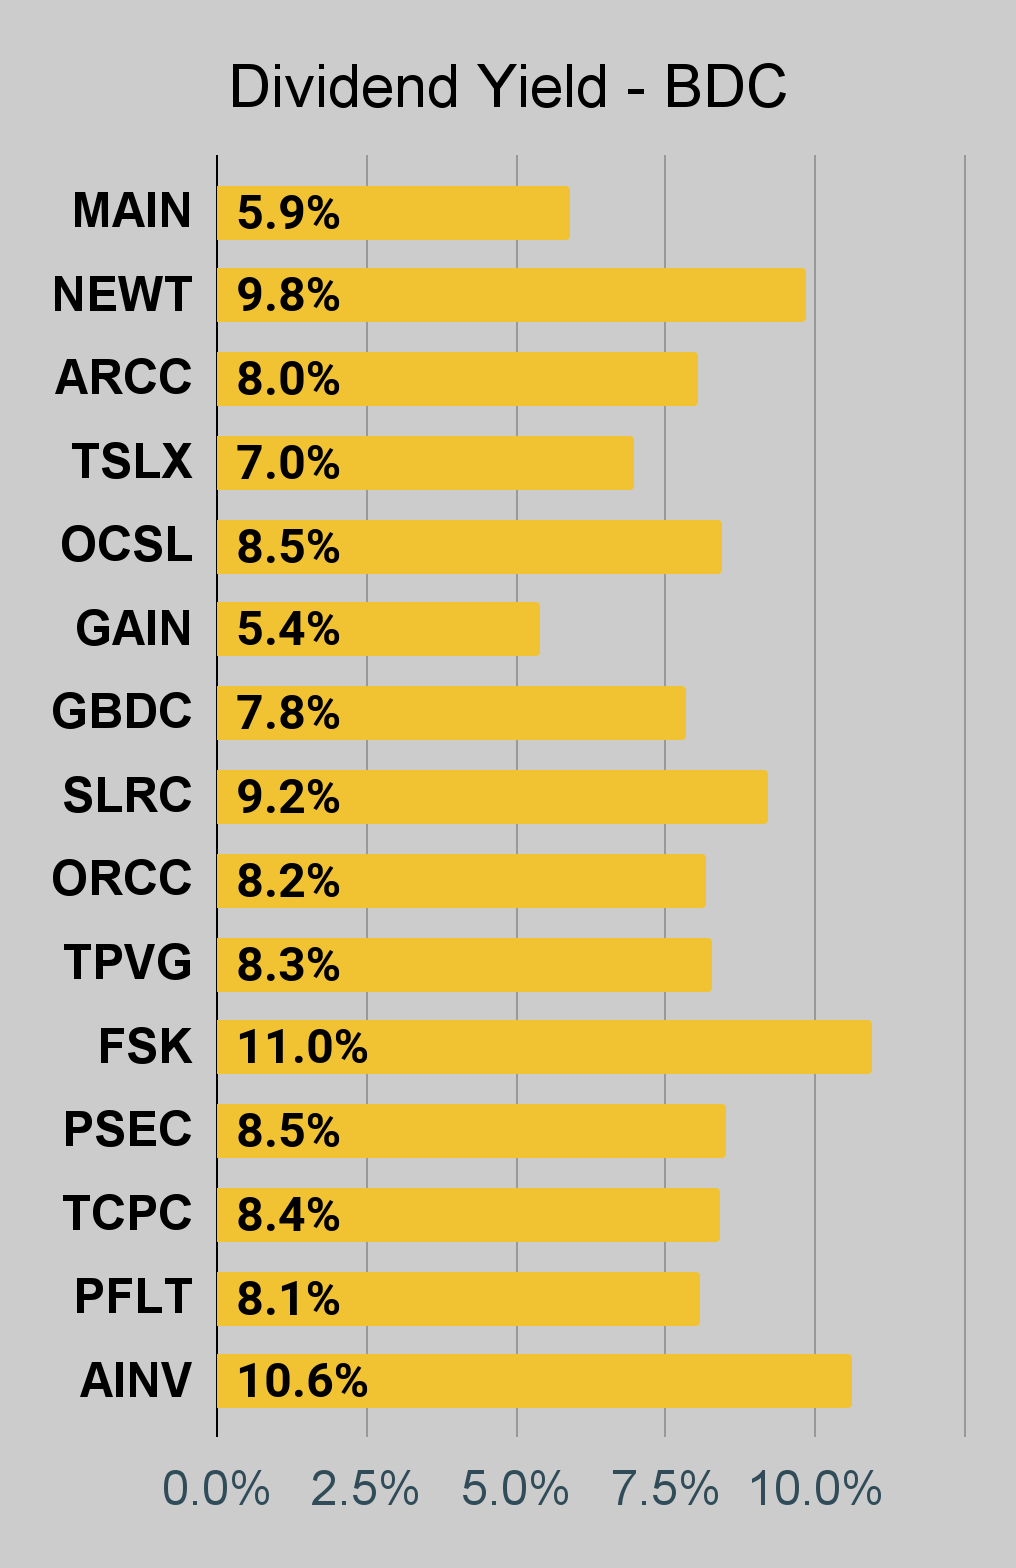 The REIT Forum |
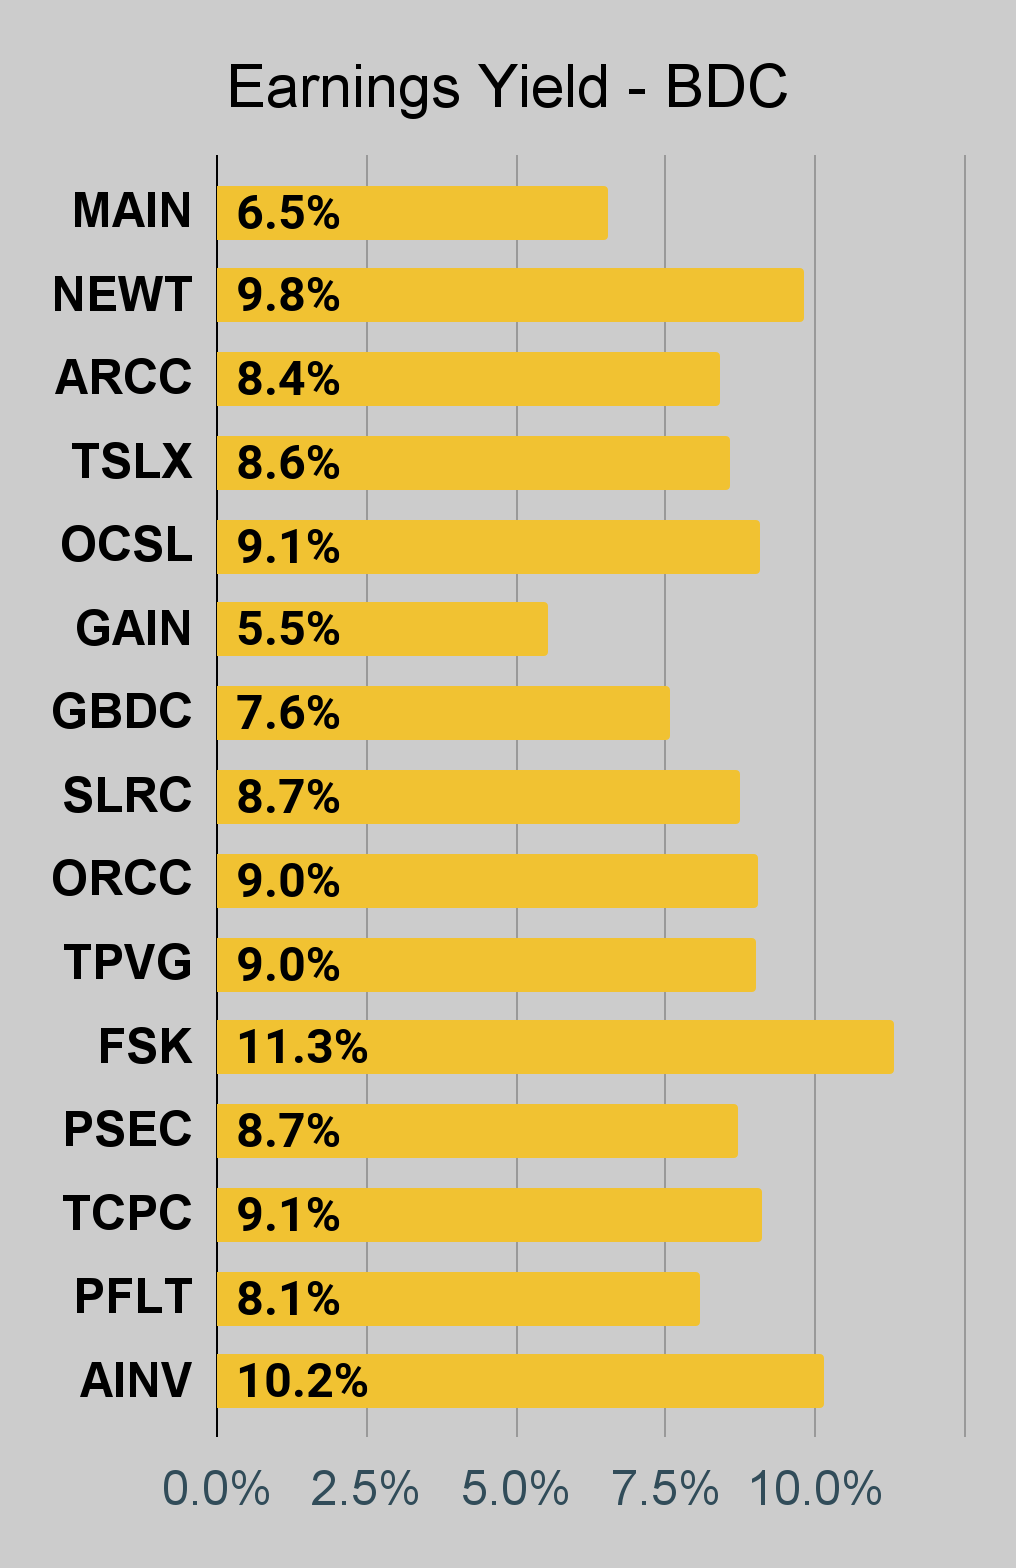 The REIT Forum |
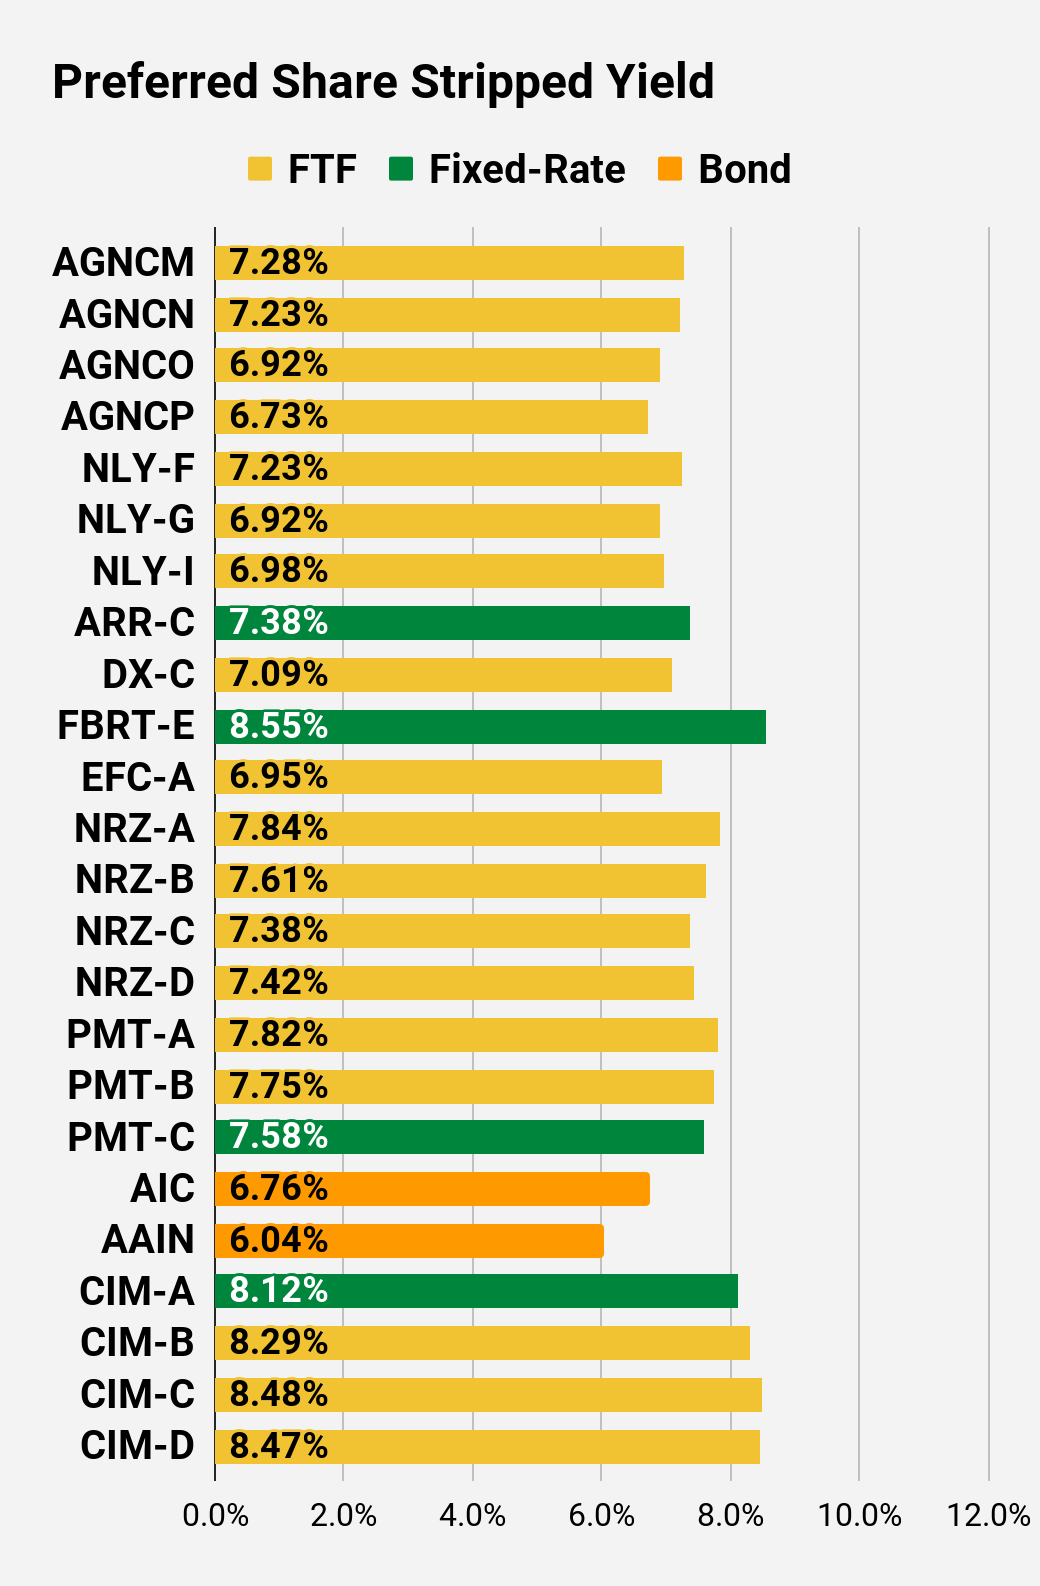
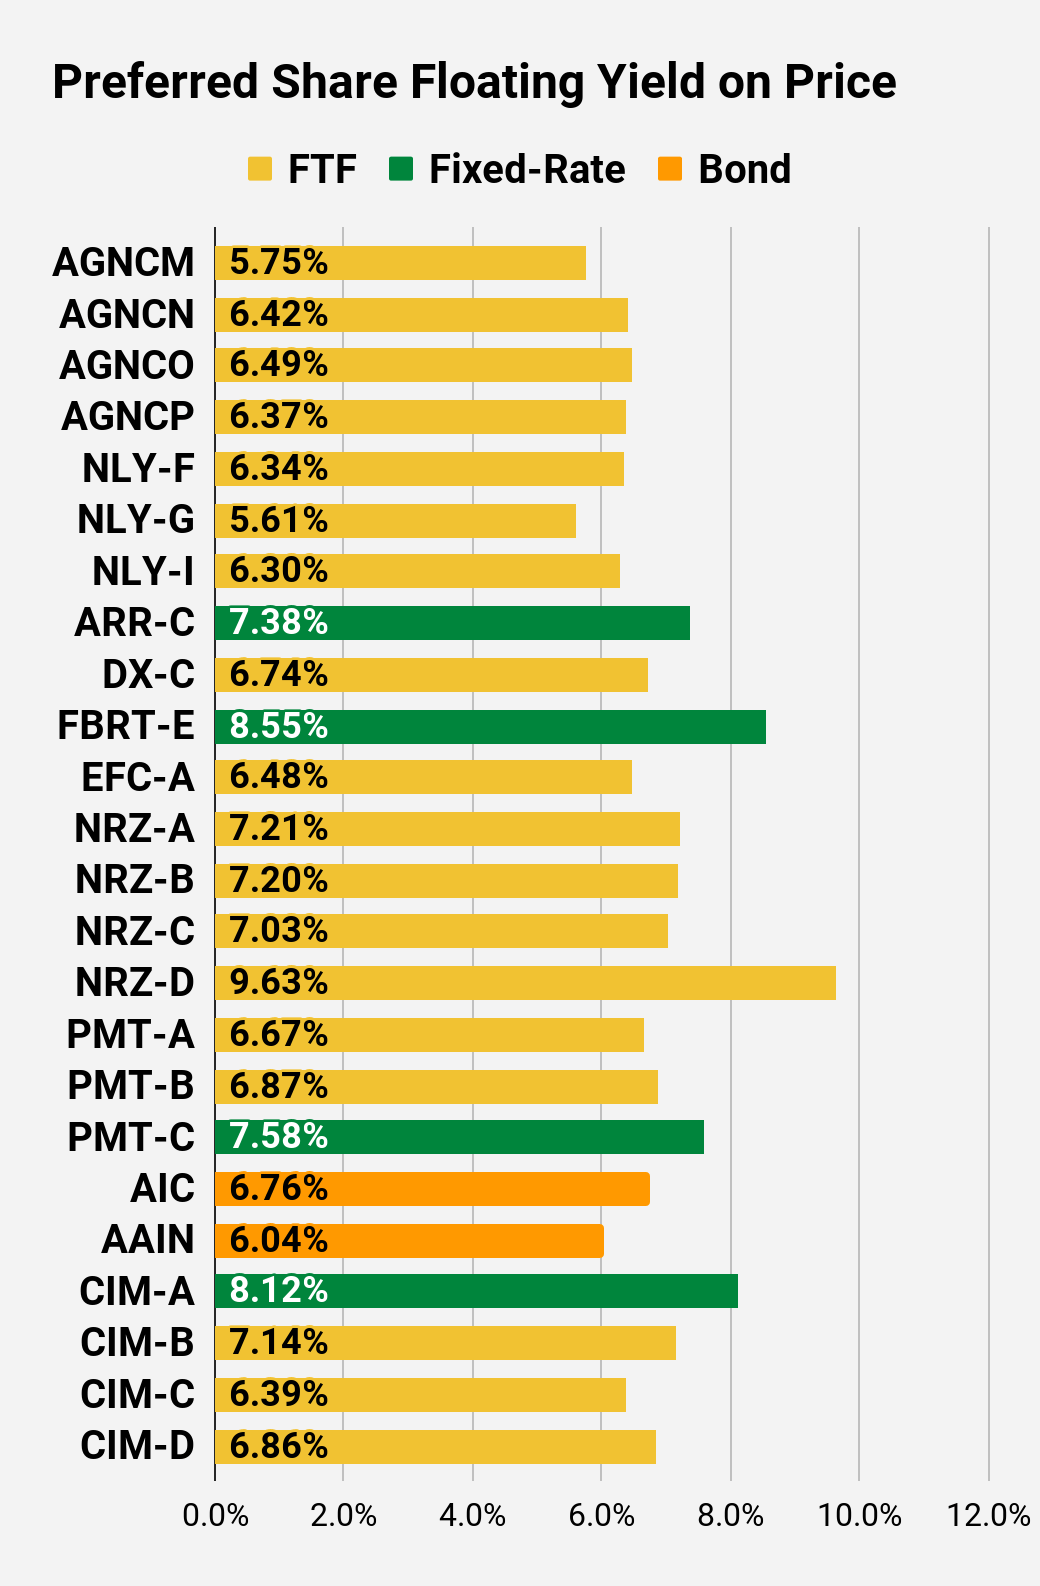
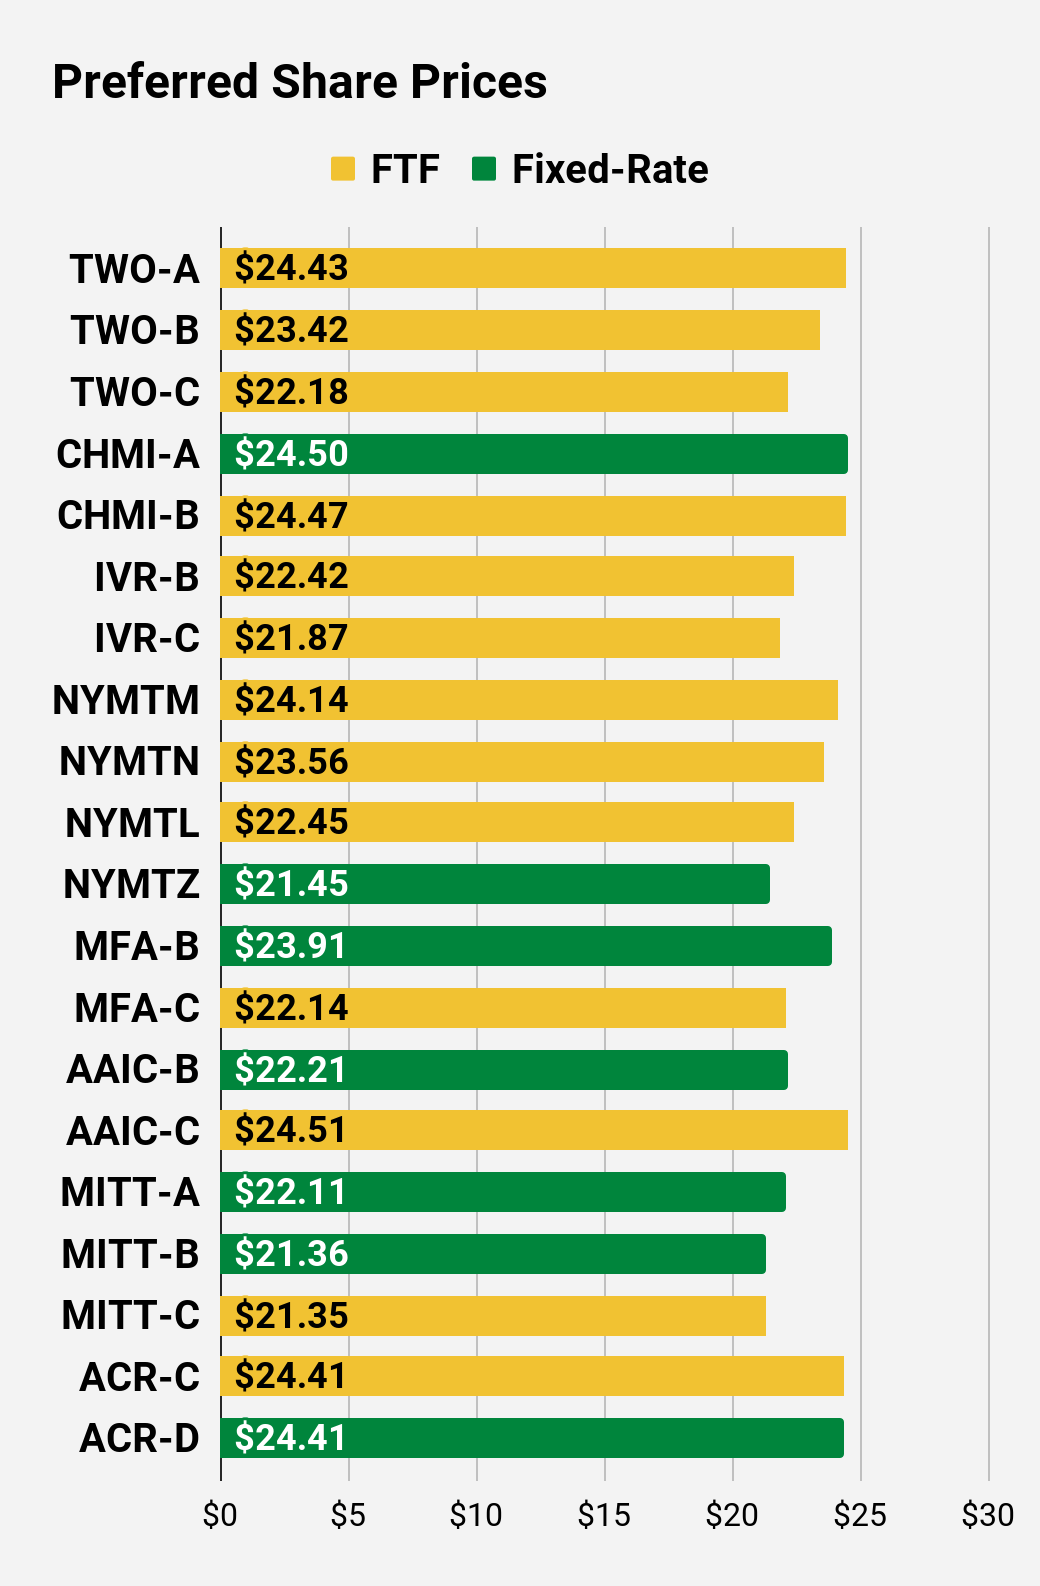
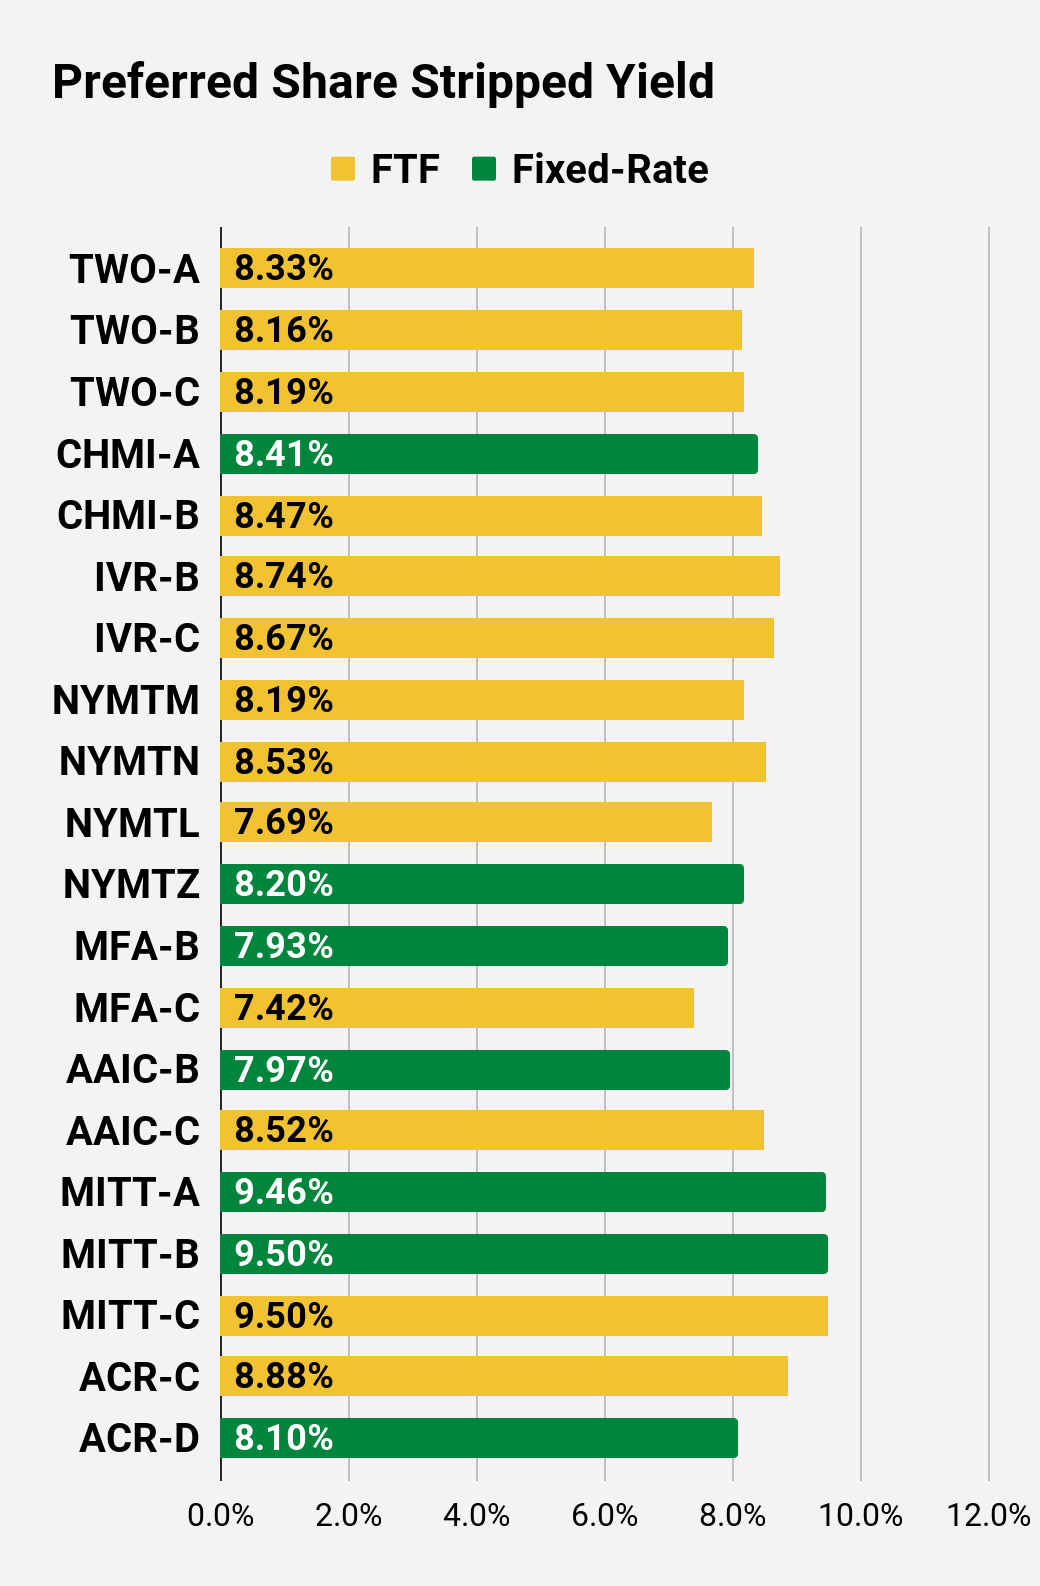
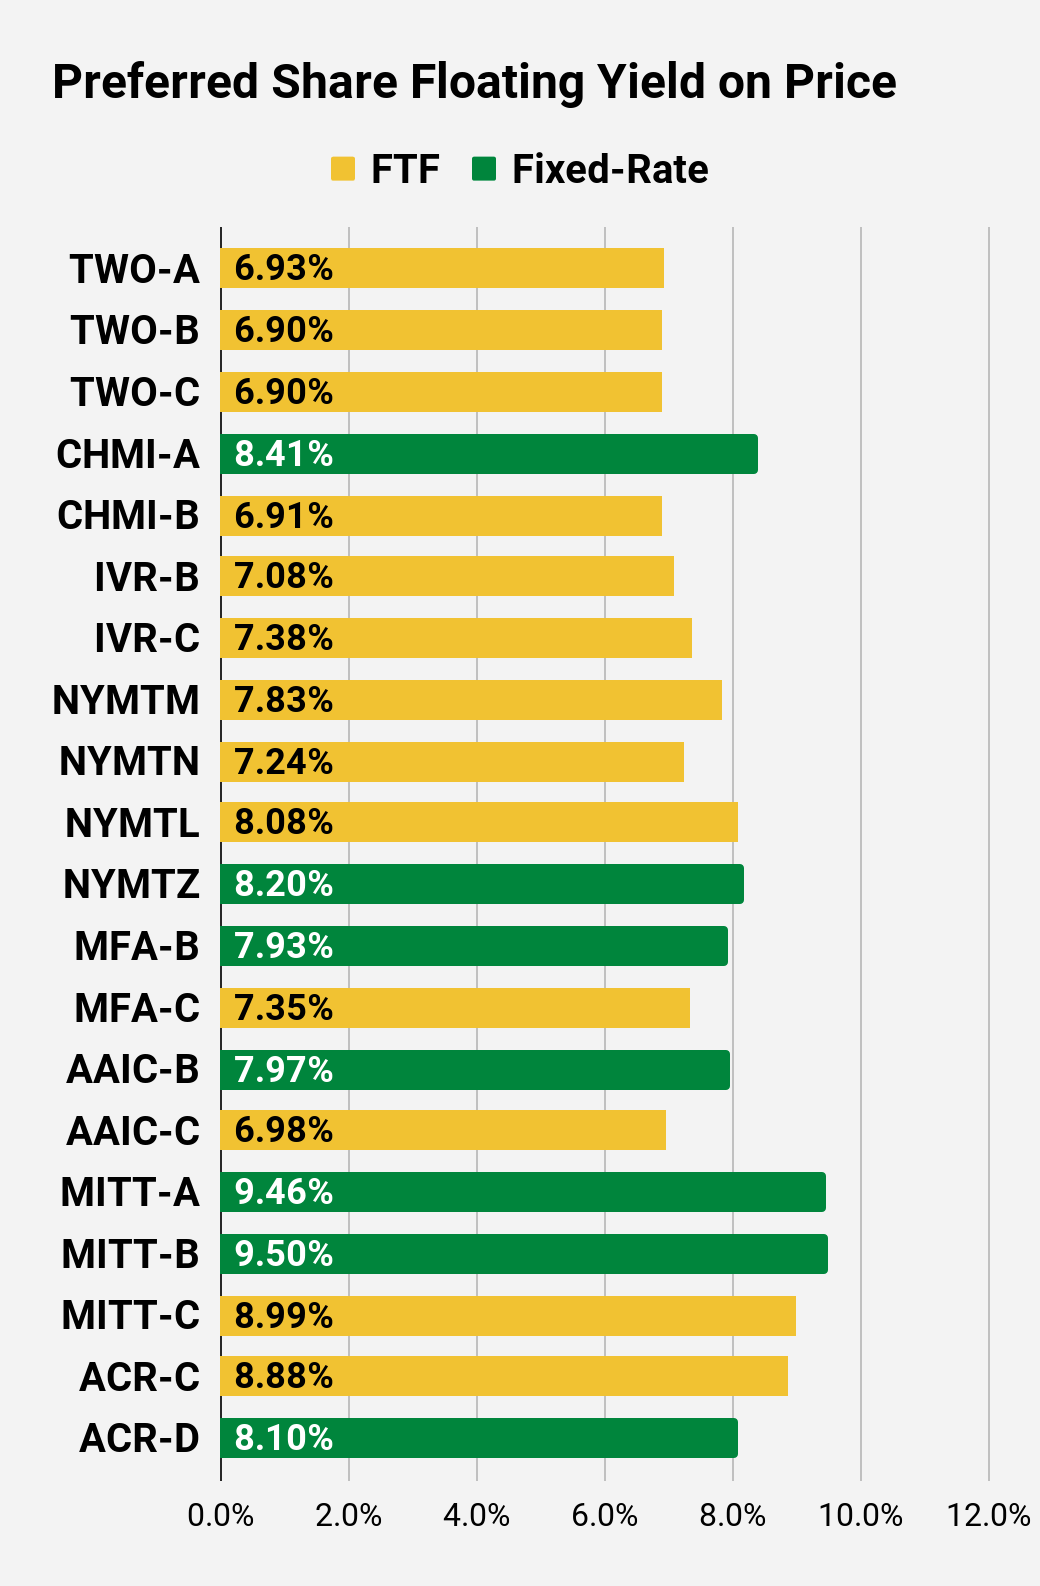
Preferred Share Charts
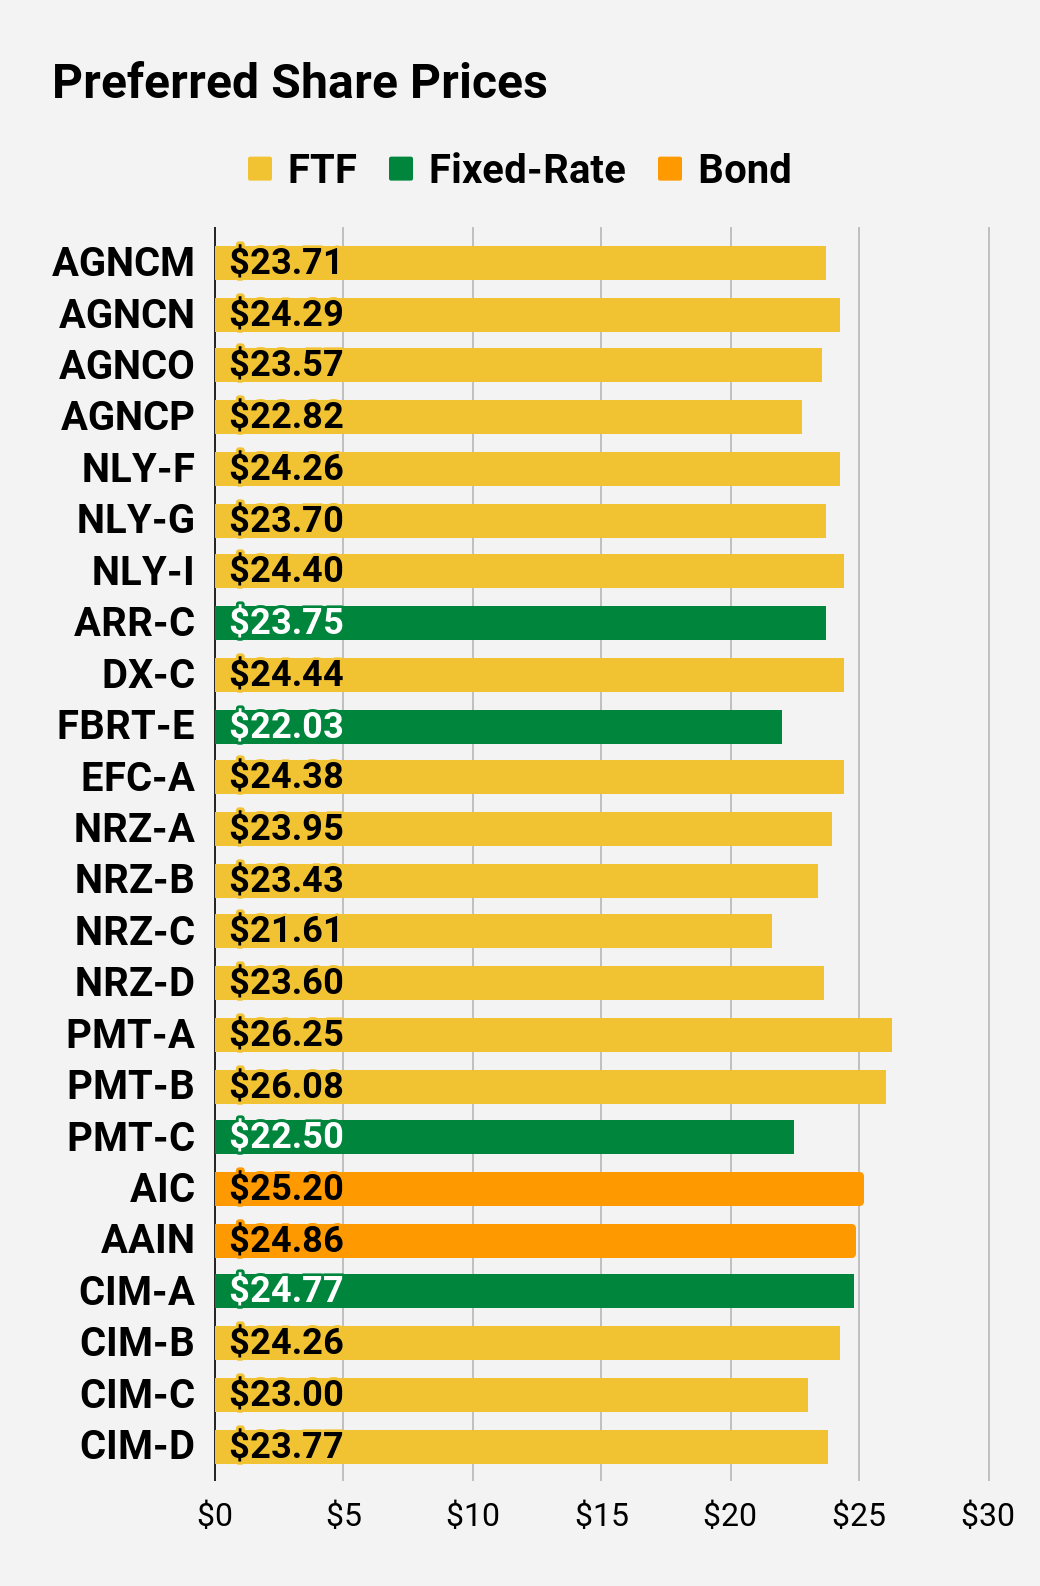 The REIT Forum |
 The REIT Forum |
 The REIT Forum |
 The REIT Forum |
 The REIT Forum |
 The REIT Forum |
Preferred Share Data
Beyond the charts, we’re also providing our readers with access to several other metrics for the preferred shares.
After testing out a series on preferred shares, we decided to try merging it into the series on common shares. After all, we are still talking about positions in mortgage REITs. We don’t have any desire to cover preferred shares without cumulative dividends, so any preferred shares you see in our column will have cumulative dividends. You can verify that by using Quantum Online. We’ve included the links in the table below.
To better organize the table, we needed to abbreviate column names as follows:
- Price = Recent Share Price – Shown in Charts
- BoF = Bond or FTF (Fixed-to-Floating)
- S-Yield = Stripped Yield – Shown in Charts
- Coupon = Initial Fixed-Rate Coupon
- FYoP = Floating Yield on Price – Shown in Charts
- NCD = Next Call Date (the soonest shares could be called)
- Note: For all FTF issues, the floating rate would start on NCD.
- WCC = Worst Cash to Call (lowest net cash return possible from a call)
- QO Link = Link to Quantum Online Page
Second Batch:
Strategy
Our goal is to maximize total returns. We achieve those most effectively by including “trading” strategies. We regularly trade positions in the mortgage REIT common shares and BDCs because:
- Prices are inefficient.
- Long-term, share prices generally revolve around book value.
- Short-term, price-to-book ratios can deviate materially.
- Book value isn’t the only step in analysis, but it is the cornerstone.
We also allocate to preferred shares and equity REITs. We encourage buy-and-hold investors to consider using more preferred shares and equity REITs.
Performance
We compare our performance against 4 ETFs that investors might use for exposure to our sectors:
The REIT Forum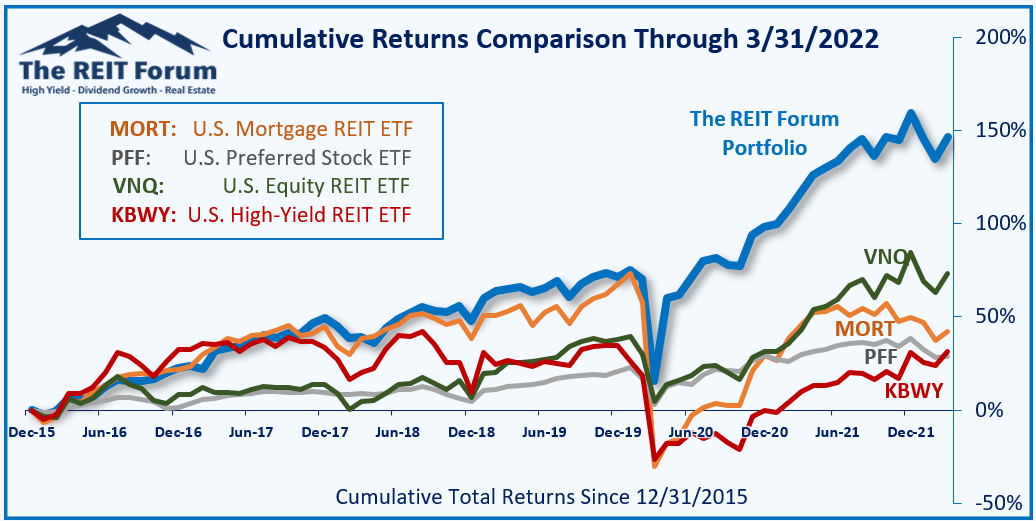
The 4 ETFs we use for comparison are:
|
Ticker |
Exposure |
|
One of the largest mortgage REIT ETFs |
|
|
One of the largest preferred share ETFs |
|
|
Largest equity REIT ETF |
|
|
The high-yield equity REIT ETF. Yes, it has been dreadful. |
When investors think it isn’t possible to earn solid returns in preferred shares or mortgage REITs, we politely disagree. The sector has plenty of opportunities, but investors still need to be wary of the risks. We can’t simply reach for yield and hope for the best. When it comes to common shares, we need to be even more vigilant to protect our principal by regularly watching prices and updating estimates for book value and price targets.
Ratings:
Be the first to comment