

AndreyPopov
Foreword
All but five equities and all of the funds listed in this October batch of monthly-paying dividend dogs live up to the ideal of paying annual dividends from a $1K investment exceeding their single share price. Here, in the MoPay collection, lie affordable (yet volatile and risky) bargains. One metric ($1k invested income>1 share price) fits all!
Two years and seven months past the 2020 Ides of March market dip, and before other pull-backs yet to come, the time to buy top yield MoPay dogs may be now.
To learn which of these 101 MoPay equities pay “safer” dividends, go to my dividend dogcatcher marketplace lists after October 30th (linked in the last bullet point in the Summary section above).
Actionable Conclusions (1-10): Brokers Estimated Top Ten MoPay Equities Could Net 37.96% to 120.71% Gains By October 2023
Six of ten top-yield MoPay stocks (shaded in the chart below) were verified as being among the top-ten gainers for the coming year based on analyst one-year target prices. Thus, the Dogcatcher yield-based strategy for this MoPay group, as graded by broker estimates this month, proved 60% accurate.
Estimated dividend payouts from $1000 invested in each of the ten highest-yielding stocks, plus analysts median 1yr target prices for those stocks, as reported by YCharts, produced the data points for the gains estimates below. Note: target prices from lone analysts were not counted. Ten probable profit-generating trades so identified to October 2023 were:
source: YCharts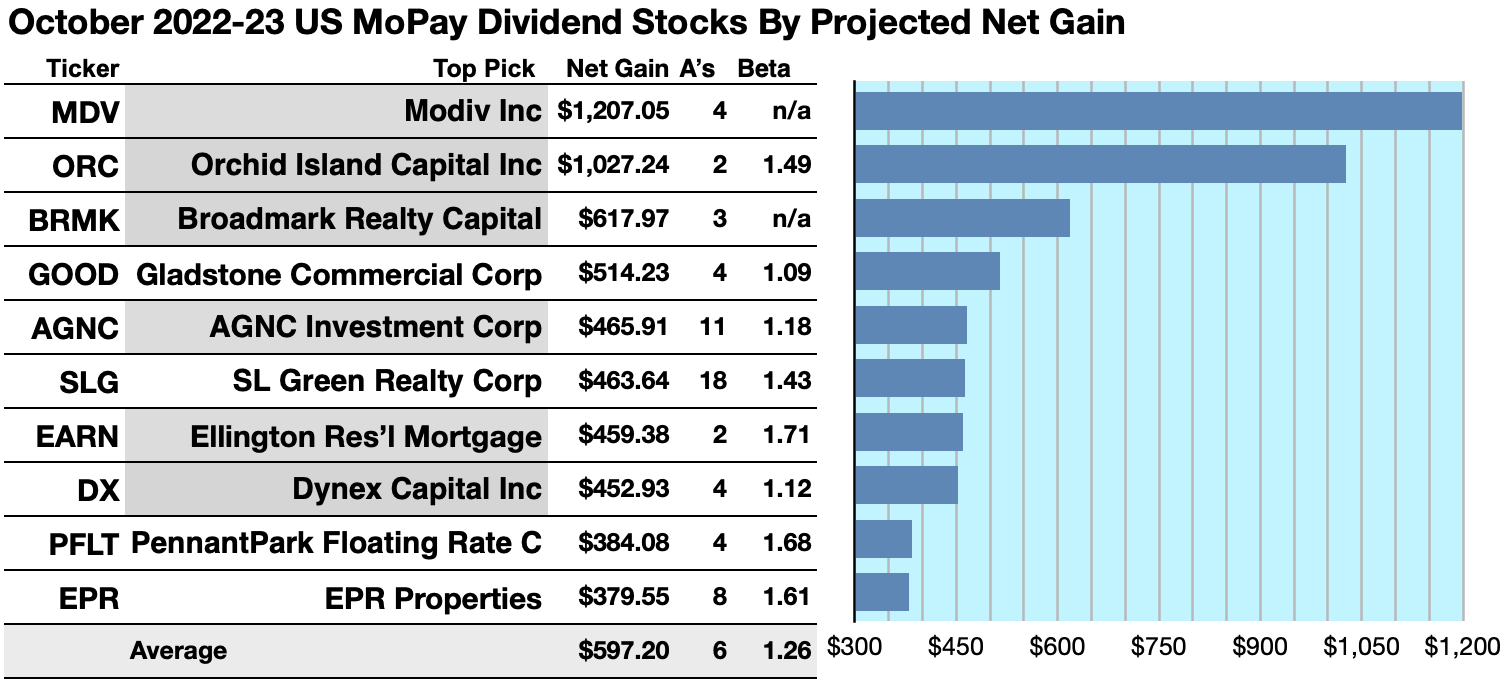
Modiv Inc. (MDV) was forecast to net $1,207.05 based on the median of target price estimates from 4 analysts, plus dividends, less broker fees. A Beta number was not available for MDV.
Orchid Island Capital, Inc. (ORC) netted $1,027.24 based on the median of target estimates from 2 analysts, plus estimated annual dividends less broker fees. The Beta number showed this estimate subject to risk/volatility 49% greater than the market as a whole.
Broadmark Realty Capital (BRMK) netted $617.97 based on the median of target estimates from 3 analysts, plus estimated annual dividends less broker fees. A Beta number was not available for BRMK.
Gladstone Commercial Corp. (GOOD) netted $514.23 based on the median of target price estimates from 4 analysts, plus dividends, less broker fees. The Beta number showed this estimate subject to risk/volatility 9% greater than the market as a whole.
AGNC Investment Corp. (AGNC) netted $465.91 based on the median of target price estimates from 11 analysts, plus dividends, less broker fees. The Beta number showed this estimate subject to risk/volatility 18% over the market as a whole.
SL Green Realty Corp. (SLG) netted $463.64 based on the median of target estimates from 18 analysts, plus estimated annual dividends less broker fees. The Beta number showed this estimate subject to risk/volatility 43% over the market as a whole.
Ellington Residential Mortgage REIT (EARN) netted $459.38 based on the median of annual price estimates from 2 analysts, plus dividends, less broker fees. The Beta number showed this estimate subject to risk/volatility 71% greater than the market as a whole.
Dynex Capital, Inc. (DX) netted $452.93 based on the median of target price estimates from 4 analysts, plus dividends, less broker fees. The Beta number showed this estimate subject to risk/volatility 12% greater than the market as a whole.
PennantPark Floating Rate Capital Ltd (PFLT) netted $384.08, based on the median of target price estimates from 4 analysts, plus dividends less broker fees. The Beta number showed this estimate subject to risk/volatility 68% greater than the market as a whole.
EPR Properties (EPR) netted $379.55 based on the median of target price estimates from 8 analysts, plus dividends less broker fees. The Beta number showed this estimate subject to risk/volatility 61% greater than the market as a whole.
Average net gain in dividend and price was 59.72% on $1k invested in each of these ten MoPay stocks. This gain estimate was subject to average risk/volatility 26% greater than the market as a whole.
Source: Open source dog art from dividenddogcatcher.com
The Dividend Dogs Rule
Stocks earned the “dog” moniker by exhibiting three traits: (1) paying reliable, repeating dividends, (2) their prices fell to where (3) yield (dividend/price) grew higher than their peers. Thus, the highest yielding stocks in any collection became known as “dogs.” More specifically, these are, in fact, best called “underdogs”.
October’s Monthly Pay Dividend Data
Three lists produce numerous actionable conclusions and several more un-numbered results. To draw these conclusions and results, August 11 closing prices and estimated annual dividends were referenced from Yahoo/Finance. Monthly pay (MoPay) equity (1) yield and (2) upside potential lists were compared and contrasted against (3) the high yield (and higher risk) MoPay CEICs/ETFs/ETNs list.
Monthly Pay Dividend Qualities
Quarterly, Semi-Annual and Annual dividend investors anxiously await announcements from a firm, fund, or brokerage to learn if their next dividend will be higher, lower, or paid at all.
Monthly pay stocks, funds, trusts, and partnerships inform the holder every four and one third weeks by check and/or statement. If the entity reduces or suspends a payment, the holder can sell out of the investment immediately to cut future losses.
This advantage has been curtailed when companies suddenly cut monthly dividends to save cash. Numerous prominent MoPay firms declared dividend cuts between May and June, 2020, including: Oxford Square Capital Corp.; Partners Real Estate Investment Trust; Orchid Island Capital Inc; Cross Timbers Royalty Trust; H&R Real Estate Investment Trust; BTB Real Estate Investment Trust; American Finance Trust Inc; Mesa Royalty Trust; Solar Senior Capital Ltd; Ellington Financial Inc; Dividend Select 15 Corp.; Chesswood Group Ltd; Sabine Royalty Trust; TORC Oil & Gas Ltd; Freehold Royalties Ltd; ARC Resources Ltd; Inter Pipeline Ltd; San Juan Basin Royalty Trust; Ag Growth International Inc.
Former MoPay top ten regular by yield. Bluerock Residential (BRG) announced December 2019 it was retreating to quarterly dividend payments “in keeping with industry tradition.” That tradition continued with Armour Residential REIT and Stellus Capital Investment Corp both transitioned to QPay in June, 2020. Within three months, however, both SCM and ARR returned to MoPay mode.
Capitala Finance Corp (CPTA) cut its monthly payout from $0.13 to $0.0833 as of October 30, 2017, then suspended it as of May 3, 2020. Oxford Square Capital (OXSQ), however, issued this nebulous statement regarding its pending monthly payments: “While no decision has yet been made with regard to the Company’s common stock distributions for July, August and September, we believe that the Company’s Board of Directors will likely elect to reduce or suspend the Company’s distributions for those months.” On June 2, 2020, the company declared $0.035 monthly distributions for July August and September, 2020 which have persisted for the past two and one-half years.
Top yield stock for July, 2018, June 2021, and September 2021, Orchid Island Capital, released this cautionary note with its monthly dividend announcements back in 2018: “The Company has not established a minimum distribution payment level and is not assured of its ability to make distributions to stockholders in the future.” ORC directors proceeded to back-up their words with actions cutting the dividend from $0.14 to $0.11 in February, to $0.09 in March, to $0.08 in September, 2018, and to $0.055 for May, 2020. However in August. 2020 ORC monthly dividend increased from $0.06 to $0.065 for September, October, and into 2021. ORC now pays a $0.16 monthly dividend and its price has risen above $5.00 per share, and is again listed here.
The U.S. exchange MoPay segment is volatile, transitive, recovering, and adding members. More trades in monthly pay equities are available from Canadian firms, many of which are also listed on U.S. OTC exchanges. Active listed MoPays priced over $2 were up from 71 in October to 73 in February 2021, and since October 2021 at the full strength of over 100 active, not seen for years. This list was limited to 101 by raising the share price limit to $5 and not listing dividends yielding over 20% or under 2.46%.
List One:
US Exchange Traded MoPay Dividend Equities by Yield
source: YCharts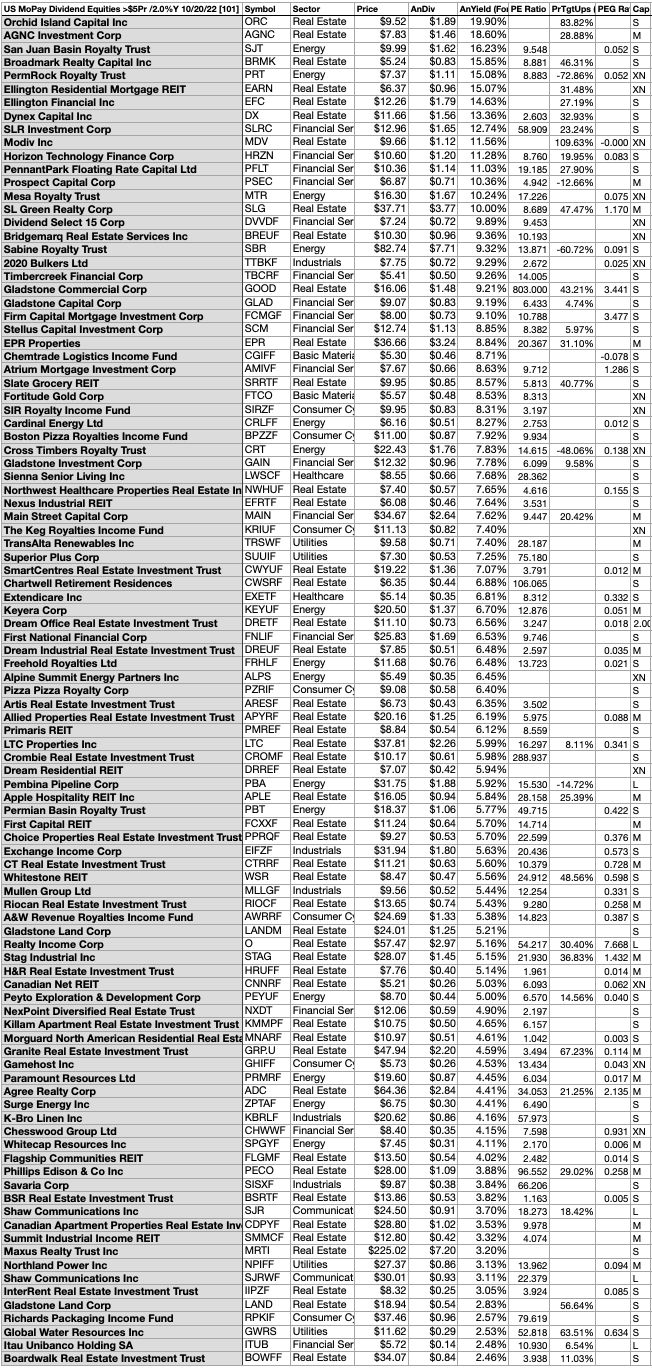
Top ten of these US exchange listed monthly pay dividend equities showing the best yields for October, represented just three of the eleven Morningstar market sectors. Representative firms split 7, 2, and 1 between the real estate, energy, and financial services sectors.
First place went to the first of seven real estate representatives: Orchid Island Capital [1]. The others placed 2nd, 4th, 6th to 8th, and 10th: AGNC Investment Corp [2]; Broadmark Realty Capital Inc [4]; Ellington Residential Mortgage REIT [6]; Ellington Financial Inc (EFC) [7]; Dynex Capital Inc (DX)[8]; Modiv Inc [10].
Third place was occupied by the first of two energy representatives, San Juan Basin Royalty Trust (SJT) [7]. The other energy stock placed fifth, PermRock Royalty Trust (PRT) [5].
Finally, one financial services sector member placed ninth, SLR Investment Corporation (SLRC) [9], which completed the October MoPay top ten equities list by yield.
List Two:
Monthly Pay Dividend Equities by Price Upsides
Results from YCharts, shown below, show 30 MoPay dividend stocks (as of market closing price October 20) compared with the median of analyst target prices one year-out. The ten top-stocks displayed 28.38% to 110.14% price upsides for the next year based on analyst one-year target price estimates.
source: YCharts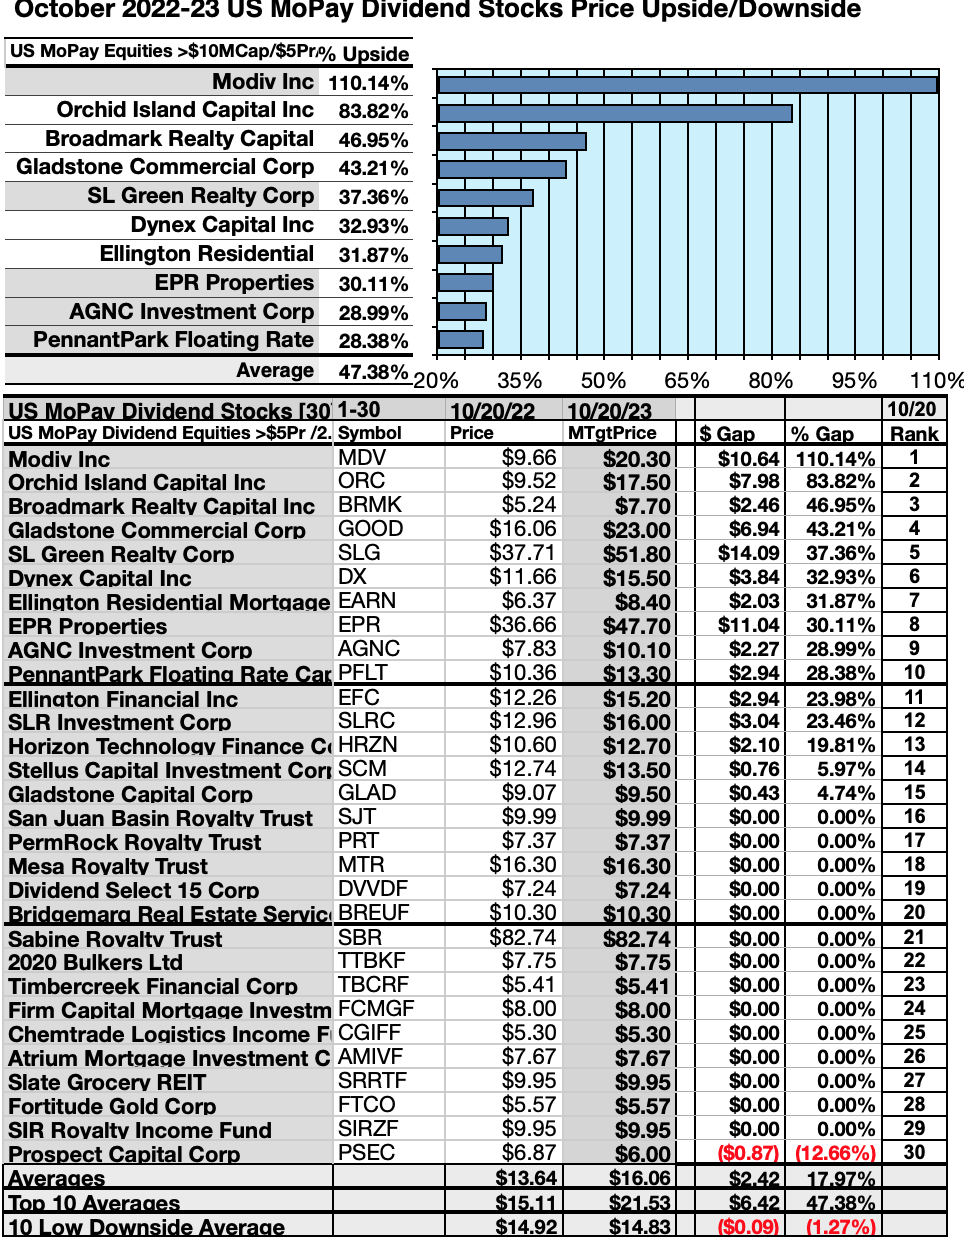
Five (tinted) of ten on this top ten price upside list were also members of the top ten list by yield. The first five places on this upside list went to: Modiv Inc [1], Orchid Island Capital Inc [2], Broadmark Realty Capital Inc [3], Gladstone Commercial Corp [4], and SL Green Corp [5].
The higher level five were, Dynex Capital Inc [6], Ellington Residential Mortgage REIT [7], EPR Properties [8], AGNC Investment Corp [9], and PennantPark Floating Rate Capital Ltd [10].
Price upside, of course, was defined as the difference between the current price and analyst target one-year median price targets for each stock.
Those ten MoPay stocks showing the highest upside price potential to October 2023 were gleaned from 30 selected by yield. Three to nine analysts have historically provided the most accurate median target price estimates.
List Three:
MoPay Dividend Closed End Investment Companies, Exchange Traded Funds, and Notes, by Yield
Eighty top monthly dividend paying Closed End Funds, Exchange Traded Funds and Notes listed below were culled from nearly 800 candidates. Yields of 14.36% or greater, calculated as of October 20, determined the top ten. All 80 show assets under management [AUM] greater than $10M and are priced above $5 per share.
source: YCharts source: YCharts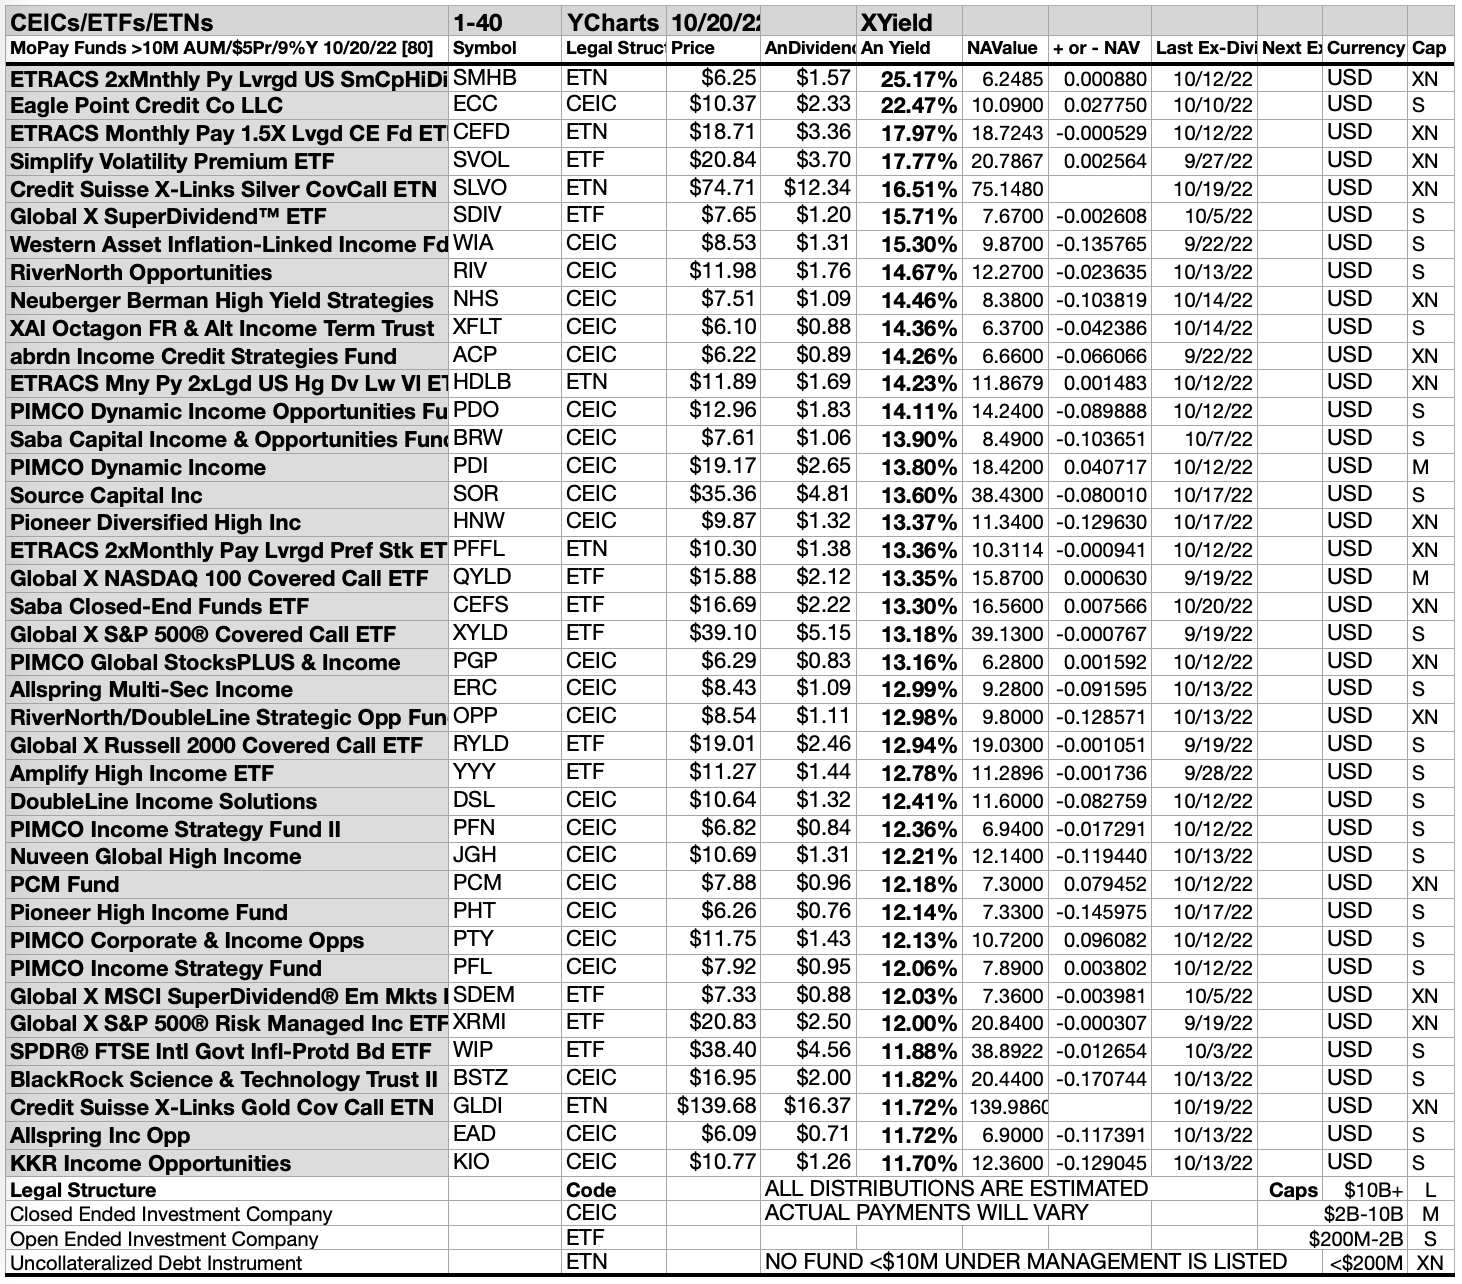
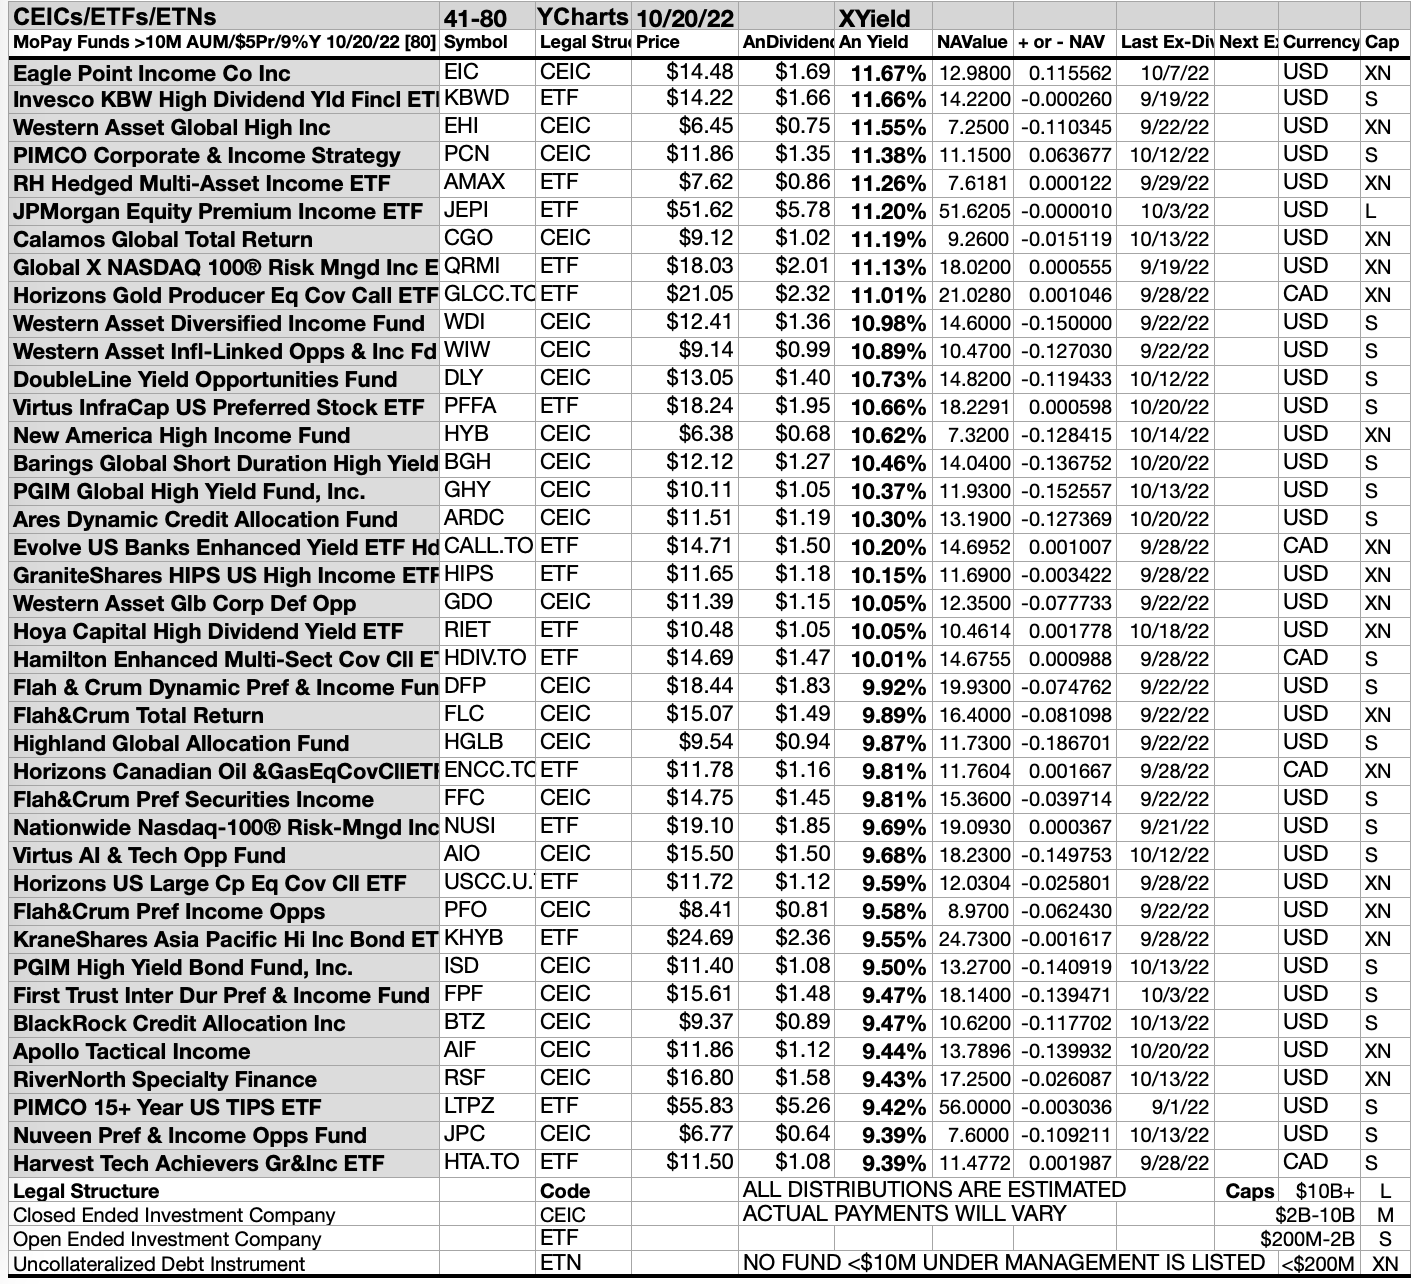
The top-ten monthly-paying dividend investment companies, funds, & notes showing the biggest yields for per YCharts & Yahoo Finance data featured three uncollateralized debt instruments [ETNs], five closed-ended investment company [CEICs], and two open-ended investment companies [ETFs].
source: YCharts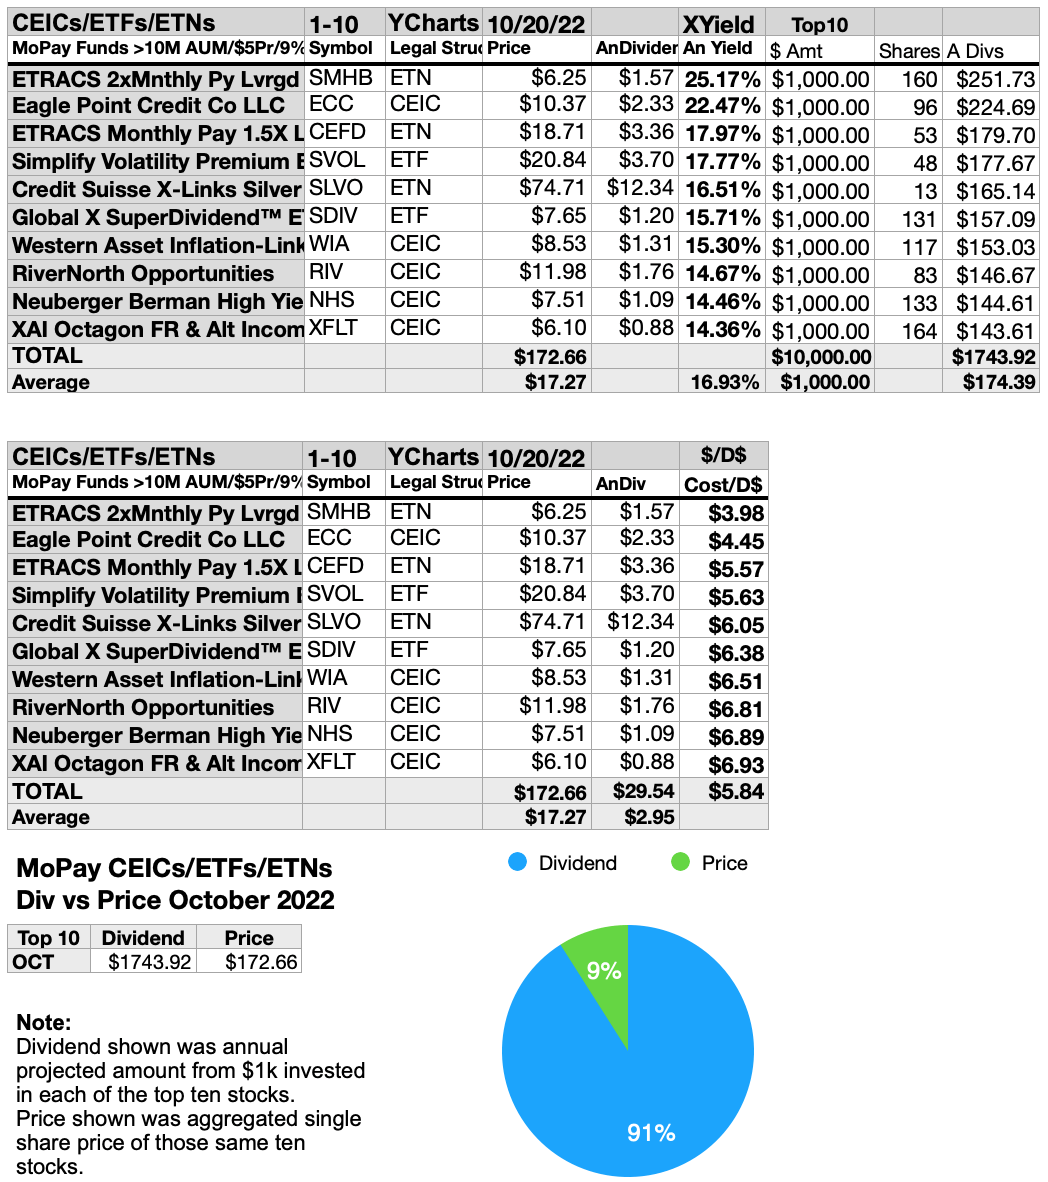
The three uncollateralized debt instrument companies (ETNs) placed first, third, and fifth: ETRACS Monthly Pay 2x Leveraged US Small Cap High Dividend ETN (SMHB) [1], ETRACS Monthly Pay 1.5X Leveraged Closed-End Fund Index ETN (CEFD) [3], and Credit Suisse Silver Shares Covered Call ETN (SLVO) [5].
Five closed-end investment companies (CEICs) placed second, and seventh to tenth. They were: Eagle Point Credit Co LLC (ECC) [2]; Western Asset Inflation-Linked Securities & Income Fund (WIA) [7]; RiverNorth Opportunities (RIV) [8]; Neuberger Berman High Yield Strategies (NHS) [9]; XAI Octagon Floating Rate & Alternative Income Term Trust (XFLT) [10].
Finally, one open ended investment company [ETF] placed sixth, Global X SuperDividend ETF (SDIV) [6], to complete the top-ten Exchange Traded Notes, Exchange Traded Funds, and Closed End Investment Companies list for October, 2022-23.
Compare Equity To Fund Performance
source: YCharts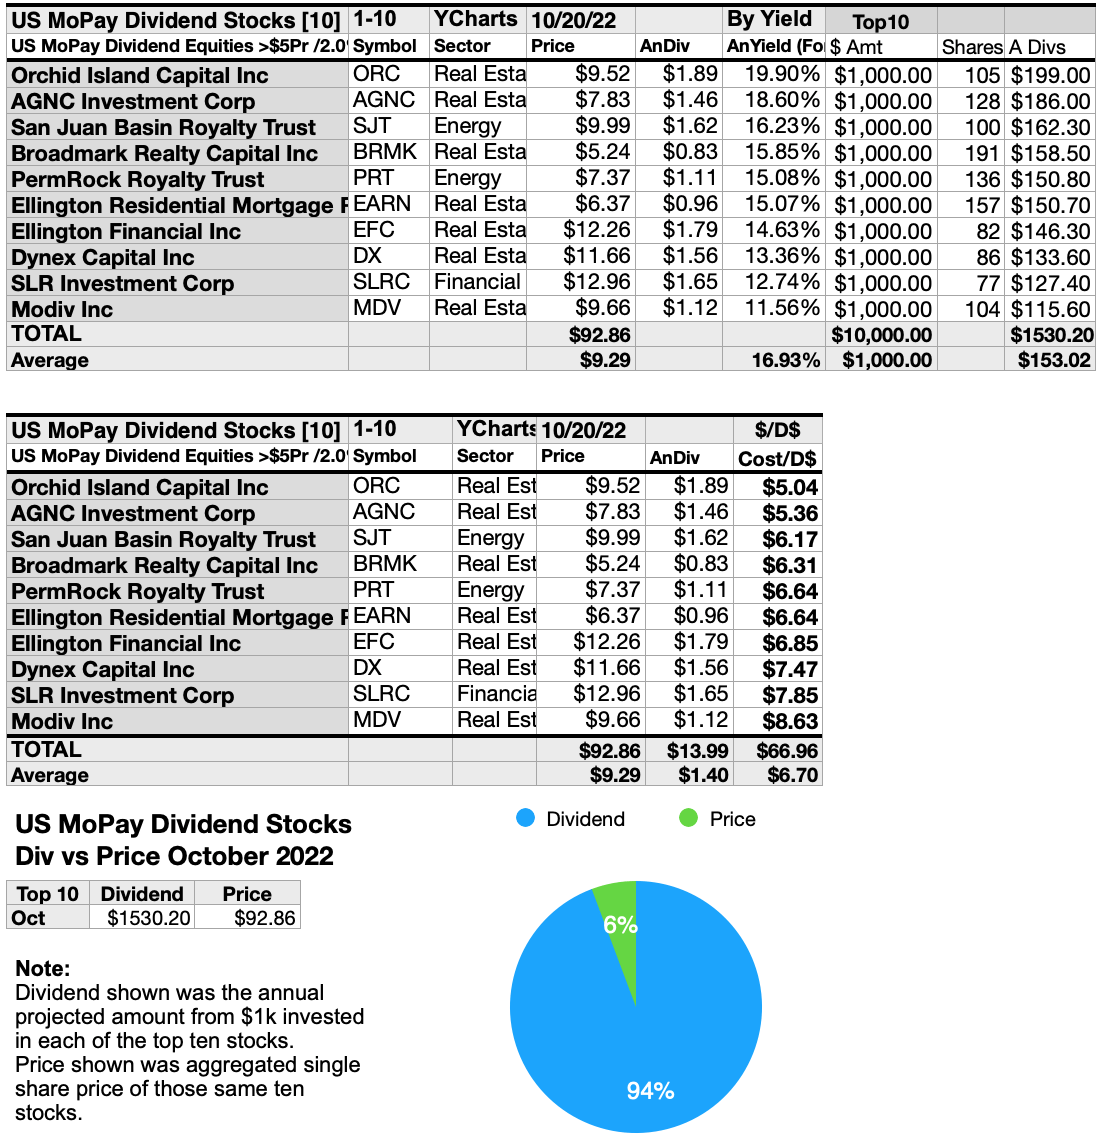
Note that the October 2022 top ten equity dividends are currently priced 3% under those of the top ten funds. Last September they were 2% higher. Last June they were 1% higher. The price differences were found in the outlandishly high dividends attributed to the top equities or funds. Without those old aberrations, funds are generally priced higher than the equities due to the overhead costs of fund management.
Background and Actionable Conclusions
In June 2012 readers suggested the author include these funds, trusts, and partnerships in the MoPay article. A list of MoPay equities to buy and hold in September 2012 resulted from those reader suggestions supplemented with a high yield collection from here. That list was supplemented by an upside potential article in October and a upside vs. buy & hold in November. Another list factored December 2012 reader comments.
Now we have a new decade of 2020 that began last January, and continued in February, March, April, early May, and mid-May, June, July, August, September, October, November, December. The progression continued in 2021 in January, February, March, April, May, June, July, August, September, October, November, and December. And carried-on in 2022, January, February, March, April, May, June/July, August, September, and now October we compare and contrast MoPay equity upside potential to the yield (and higher risk/volatility) should one be tempted to buy and hold Closed End Investments or Exchange Traded Funds and Notes.
Yield Metrics Found A 6.88% Disadvantage For The Five Lowest-Priced Of Ten High-Yield MoPay Equities In October
source: YCharts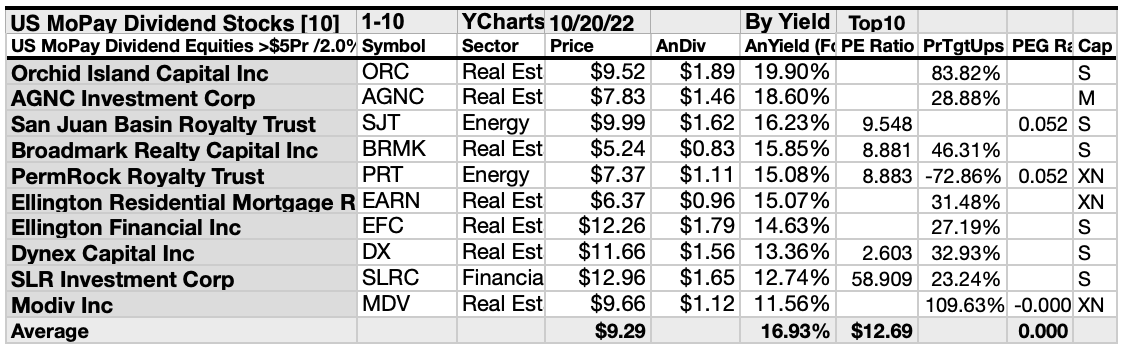
Ten monthly pay stock equities were ranked by yield. Those results, verified by YCharts and Yahoo Finance, produced the following charts.
Actionable Conclusions: Analysts Estimated 5 Lowest Priced of Top Ten High Yield MoPay Dividend Stocks (11) Would Produce 54.23% VS. (12) 52.52% Net Gains from All Ten by October, 2023
source: YCharts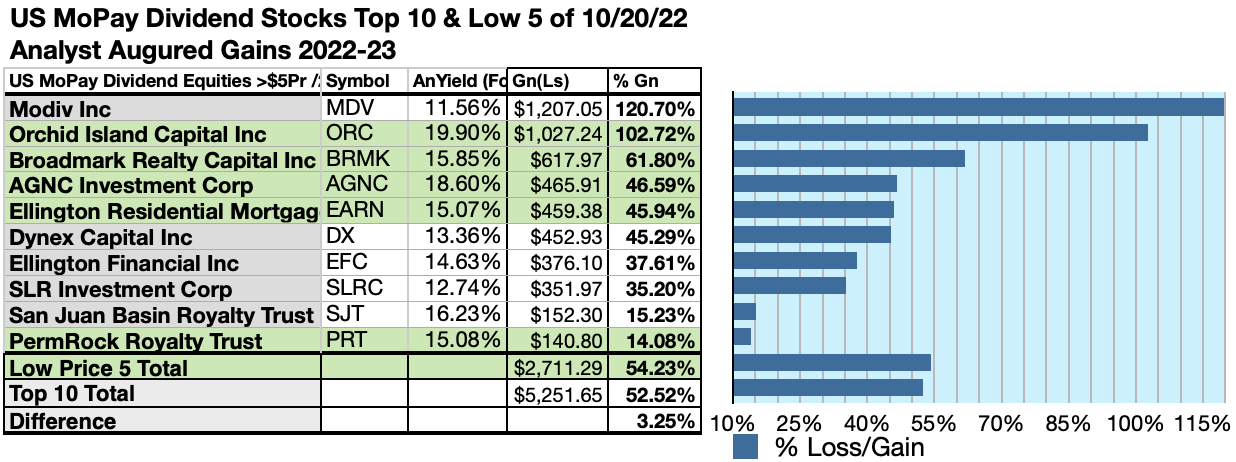
$5000 invested as $1k in each of the five Lowest priced stocks in the top ten MoPay dividend dog kennel by yield were predicted by analyst 1-year targets to deliver 3.25% more net gain than $5,000 invested as $.5k in all ten. The sixth lowest-priced MoPay dividend dog, Modiv Inc, was predicted to deliver the best net gain of 120.70%.
source: YCharts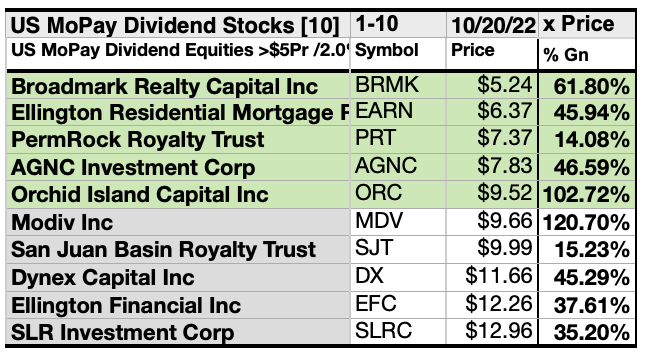
Lowest priced five MoPay dividend stocks estimated as of October 20 were: Broadmark Realty Capital Inc; Ellington Residential Mortgage REIT; PermRock Realty Trust; AGNC Investment Corp; Orchid Island capital Inc, with prices ranging from $5.24 to $9.52.
Higher priced five MoPay dividend equities, estimated as of October 20, were: Modiv Inc; San Juan Basin Royalty Trust; Dynex Capital Inc; Ellington Financial Inc; SLR Investment Corp, whose prices ranged from $9.66 to $12.96.
This distinction between five low-priced dividend dogs and the general field of ten reflects the “basic method” Michael B. O’Higgins employed for beating the Dow. The same technique, you now see, is today useful to find rewarding dogs in the MoPay kennel.
The added scale of projected gains, based on analyst targets, contributed a unique element of “market sentiment” gauging upside potential. It provided a here and now equivalent of waiting a year to find out what might happen in the market. It is also the work analysts got paid big bucks to do.
Caution is advised, however, as analysts are historically 20% to 90% accurate on the direction of change and about 0% to 15% accurate on the degree of the change.
Gains/declines as reported do not factor-in any tax problems resulting from dividend, profit, or return of capital distributions. Consult your tax advisor regarding the source and consequences of “dividends” from any investment.
Afterword
If somehow you missed the suggestion of the stocks ripe for picking at the start of this article, here is a reprise of the list at the end:
October MoPay Equities List
(Alphabetical by Ticker)
source: YCharts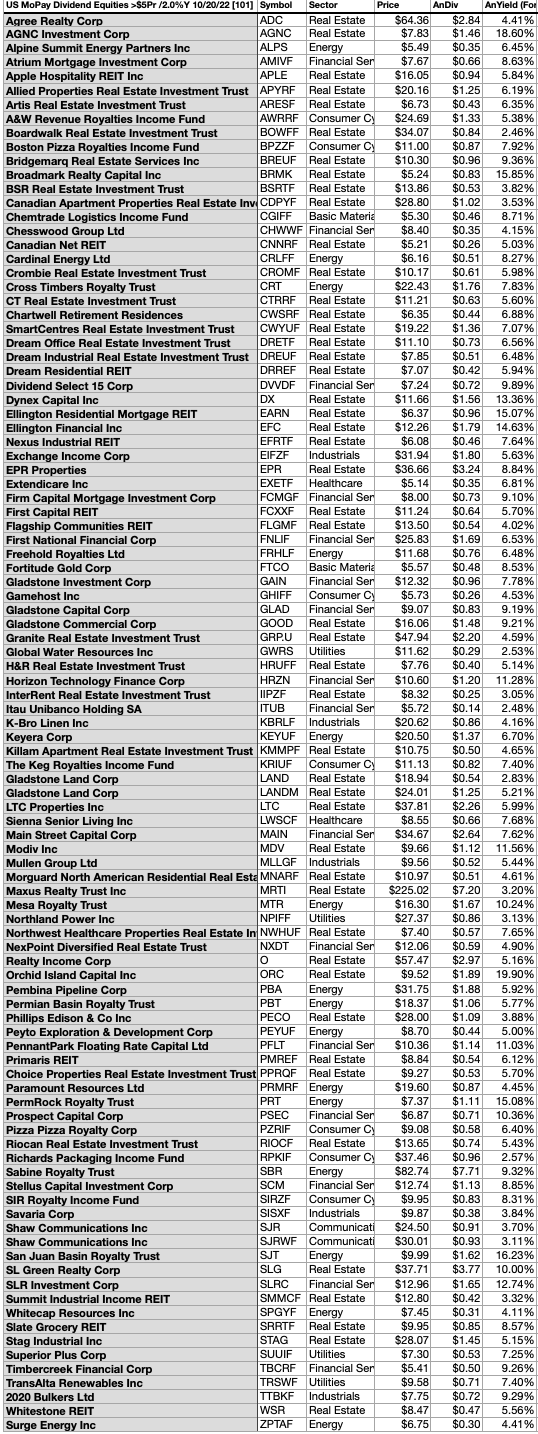
All but five equities and all of the funds listed in this October collection of monthly-paying dividend dogs live up to the ideal of annual dividends from $1K invested exceeding their single share price. Here in the MoPay collection lie affordable yet volatile and risky bargains.
Two and one-half years after the 2020 Ides of March dip, and before other pull-backs yet to come, the time to buy top yield MoPay dogs may now be at hand. There have never been more to choose from. This month’s list of 101 was accomplished by holding the maximum yield to under 20%, setting the minimum price per share for selection at $5, and boosting the minimum yield to 2.46%.
Stocks listed above were suggested only as decent starting points for your MoPay dividend stock purchase or sale research process. These were not recommendations.
Disclaimer: This article is for informational and educational purposes only and should not be construed to constitute investment advice. Nothing contained herein shall constitute a solicitation, recommendation or endorsement to buy or sell any security. Prices and returns on equities in this article except as noted are listed without consideration of fees, commissions, taxes, penalties, or interest payable due to purchasing, holding, or selling same.
Graphs and charts were compiled by Rydlun & Co., LLC from data derived from www.ycharts.com; www.dividend.com; finance.yahoo.com; analyst mean target price by YCharts. Open source dog art from dividenddogcatcher.com
Be the first to comment